


1. Introduction
Social mobility has risen in prominence in UK public and political discourse over the past decade. The Deputy Prime Minister unveiled his Social Mobility Strategy in 2011 and improving social mobility was described as the ‘principal goal’ of the coalition's social policy (Cabinet Office, 2011). In both the UK and US increased public investment in education is often mooted as the solution to the perceived problem of the intergenerational transmission of inequality. For example, in 2014, President Obama stated ‘There aren't many things that are more important to that idea of economic mobility… than a good education’ and the UK Government monitors 17 ‘leading indicators’ of mobility, 11 of which are based on educational achievement gaps between those coming from more and less advantaged backgrounds.Footnote 1
Studies on the role of education in intergenerational mobility date back to the early 1980s within the economics literature (Atkinson, Reference Atkinson, Hughes and Heal1980; Atkinson and Jenkins, Reference Atkinson and Jenkins1984) and are found even further back within sociology (Duncan and Hodge, Reference Duncan and Hodge1963). The idea is that the stronger the association between family background and education, the more persistent intergenerational inequalities will be. Recent empirical studies have sought to decompose the association between status across generations into two parts; one related to education and the other quantifying the direct impact of family background on children's outcomes. In the UK education measures can account for over 50 per cent of this link across generations (Blanden et al., Reference Blanden, Gregg and Macmillan2007).
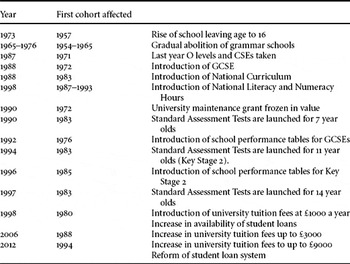
Educational achievement has expanded dramatically across the world in recent years. In 1960 just five per cent of British young people attended university and growth was slow until the late 1980s when it took off dramatically, rising by more than 15 percentage points in five years. By the mid-1990s university attendance rates topped 30 per cent and have remained above this level ever since (Finegold, Reference Finegold2006). The growth in demand for university education has been enabled by an increase in educational attainment at earlier stages in the system, which started with the introduction of the GCSE in 1988. Government allowed universities to respond by increasing supply but growing financial pressures led to the introduction of fees and a switch from public support to loans; with an accompanying debate about the impact of reforms on social mobility (Dearden et al., Reference Dearden, Fitzsimons and Wyness2011). Table 1 presents the main policy changes in education; these also include the phasing out of grammar schoolsFootnote 2 , the shift to a national curriculum for all state schools and the use of standardised assessment at earlier points in the schooling system to generate school league tables.
TABLE 1. Education policies in the UK
In principle, educational expansion can both drive increased social mobility and prevent it, depending on who is primarily benefitting from the expansion. Blossfeld and Shavit (Reference Blossfeld and Shavit1993) found stable educational inequality across countries during a time of mass educational expansion throughout the twentieth century although, more recently, Breen et al. (Reference Breen, Luijikx, Muller and Pollak2009, Reference Breen, Luijikx, Muller and Pollak2010) found a more positive picture of narrowing inequalities across a range of countries. Blanden and Machin (Reference Blanden and Machin2004, Reference Blanden and Machin2013) showed that the better-off were the main gainers from the expansion of higher education in the UK in the 1980s and 1990s. If relative achievement matters more to employers than absolute achievement, then educational expansion will encourage employers to use a different standard to select workers. Provided better-off children continue to out-perform poorer children then their advantage in the labour market will be maintained. Lucas (Reference Lucas2001) describes ‘Effectively Maintained Inequality’ whereby qualitative dimensions of inequality (school attended, subjects studied, etc) distinguish children from higher class socio-economic backgrounds. In a similar vein, Goldthorpe (Reference Goldthorpe2013) describes education as acting as a positional good that can be manipulated by the middle classes to maintain class status. This study contributes to this evidence base.
Our analysis attempts to assess the evolution of educational inequality and its consequences for intergenerational mobility. We proceed in three stages: initially we use the available evidence on the relationship between educational achievements and socio-economic background to build a picture of changes in educational inequality across cohorts over the past forty years. We then assess the association between trends in educational inequality and overall levels of attainment, considering the relationship between educational inequality and educational expansion. Finally, we switch focus to the labour market to consider the returns to different levels of education in the labour market for more recent cohorts; and we use this to speculate on trends in intergenerational income persistence.
We find that educational inequality has declined over recent cohorts, driven by the improved performance of children from more deprived backgrounds. The relationship between educational inequality and overall attainment is concave: educational inequality increases up to some threshold of overall attainment before declining as a critical mass of each cohort reach the expected level. Consistent with the predictions of Boudon (Reference Boudon1974), when our findings are adjusted for the growing supply of educated young people we find no narrowing of educational inequalities. We also find support for claims that relative educational achievements matter. In line with Lucas's (Reference Lucas2001) ‘Effectively Maintained Inequality’ hypothesis, intergenerational inequality has not narrowed at elite levels of education. On the demand side, we find constant returns to these skills over the past 20 years despite increases in the supply of individuals reaching expected levels of attainment. When combined with a reduction in educational inequality, this could signal an improvement in mobility for more recent cohorts. On the other hand, if we consider the evidence on inequality at higher levels of attainment and combine this with research which suggests that returns to finer grade measures of education vary widely, the picture is less promising.
In the next section we discuss the concepts and the measures that we use here. In section 3 we bring together evidence on trends in educational inequality over the last 50 years and in section 4 we assess the relationship between educational inequality and educational expansion. Section 5 presents new evidence on returns to qualifications and Section 6 ends with a discussion of the implications of this evidence.
2. Concepts and measures
Educational inequality
We begin by focusing on the trends in educational inequality across education levels for the expected level of attainment at each stage. For example, the proportion reaching the expected level (Level 4) of achievement in English and Maths at age 11 (Key Stage 2) and the proportion achieving 5 or more GCSEs at grade A*–C including English and Maths. These are standard measures of attainment that have been used in a number of analyses of trends in educational attainment (see Lupton and Obolenskaya, Reference Lupton and Obolenskaya2013) and are often used as measures of school performance. In order to create a detailed picture of educational inequality we wish to use data from as many sources as possible including some of those used as Government Social Mobility Indicators (SMIs) listed in Table 2. We use survey data, the National Child Development Study (NCDS) of those born in 1958, the British Cohort Study (BCS) of those born in 1970, cohorts constructed from the British Household Panel Survey (BHPS), of those born in 1974–1986, the Longitudinal Survey of Young People in England (LSYPE), born 1990–91, and the Avon Longitudinal Survey of Parents and Children (ALSPAC), born 1991–92. We also use evidence from administrative data sources, the National Pupil Database (NPD, England and Wales only) and the Higher Education Statistics Authority (HESA) data. For the linked NPD-HESA data we present evidence for cohorts born between 1986 and 1991 while, for the NPD data, we examine trends at various education levels for cohorts born between 1987 and 1999. We consider both sexes together. All of the data and measures used here are listed in Table 3, and a graphical representation of the cohorts and educational stages is given in Figure 1.
TABLE 2. Government social mobility indicators across the life-cycle

TABLE 3. Data sources with preferred measures of family background and educational attainment


Figure 1. Description of available data by education level and time
Throughout, we use a measure of ‘educational inequality’: this is the gap between the attainment of a privileged group and that of a disadvantaged group. The definitions of privilege and disadvantage vary depending on the data. Survey data such as the cohort studies enable us to compare performance across the distribution of parental income; and we commonly focus on the top and bottom quintiles, although we check the robustness of our trends against those using other measures. Administrative data sources provide fewer options, and a common way to split the data is on the basis of Free School Meals receipt, which is available in the administrative education databases. Around 14 per cent of English pupils are in receipt of free school meals, a statistic that has remained broadly stable across the past decade into the Great Recession. Children are eligible for Free School Meals based on their parents’ low income or weak labour market attachment. The indicator is therefore primarily looking at gaps between ‘the disadvantaged’ and the rest.Footnote 3 For the linked NPD-HESA data, the difference in attainment between the top and bottom quintiles of socio-economic status (SES) are compared, combining information on individual level FSM status with neighbourhood measures (see Crawford, Reference Crawford2012, for full details). When we model all the data together we control for differences in the measure of family background used, to ensure these differences are not driving our results.
The nature of our data means that the information available for different cohorts is derived from different sources. The starkest differences are between the administrative data (NPD) and the data from surveys. In particular the results based on the NPD do not include information on children attending private schools; a potentially important driver of educational inequality. As documented by Green et al. (Reference Green, Machin, Murphy and Zhu2011), attending a private school leads to substantial education and labour market advantages, and the share of pupils who are educated in them has varied over time. It is therefore important to check if the inclusion of private school pupils affects the trends in educational achievements that we find.
To explore the hypotheses of ‘Effectively Maintained Inequality’, or education as a positional good, we include trends in educational inequality in higher levels of achievement in our analysis, such as achieving level 5 at KS2 or obtaining 6 or more GCSEs A*–C in English BaccalaureateFootnote 4 (EBacc) subjects. By doing this we can directly test whether trends in educational inequality at high levels of education are different. Are relative advantages being sustained as overall levels of attainment increase? If so, we would expect to see increases in overall levels of attainment at higher levels of education combined with an increase in educational inequality in these measures.
To understand the evolution of educational inequalities we pool all the information available and use regression techniques to model the relationship between education gaps and cohort of birth. The education attainment gap (ed_gap) for cohort c, at education level l, by family background measure s, is the dependent variable and we model this as a function of cohort (c). As discussed, data limitations mean that these gaps are based on different measures of family background and education, and so we need to account for this by including the level of the educational qualification (level) and the family background measure used (SES). To allow for the possibility that the influence of using different background measures varies by education level we include interactions of these variables. The variable high indicates those observations which measure education gaps at higher levels of educational attainment for given levels of education, l, and an interaction between this indicator and the level of education: for example, success in the EBacc is the higher level measure of success at GCSE.
 $$\begin{eqnarray}
ed\_ga{p_{lcs}} &=& \widehat {{\alpha _1}} + \hat \pi c + \hat \varphi leve{l_{cs}} + \hat \omega SE{S_{lc}} + \hat \theta level*SE{S_c} \nonumber\\
&&+\, \hat \vartheta hig{h_{lcs}} + \hat\mu high*leve{l_{lc}} + {\hat u_{lcs}}
\end{eqnarray}$$
$$\begin{eqnarray}
ed\_ga{p_{lcs}} &=& \widehat {{\alpha _1}} + \hat \pi c + \hat \varphi leve{l_{cs}} + \hat \omega SE{S_{lc}} + \hat \theta level*SE{S_c} \nonumber\\
&&+\, \hat \vartheta hig{h_{lcs}} + \hat\mu high*leve{l_{lc}} + {\hat u_{lcs}}
\end{eqnarray}$$
As is made clear in Figure 1, we observe educational histories up to young adulthood for the older cohorts observed; while information on younger cohorts is incomplete. This is a potential limitation when we estimate model (1) and could lead to a bias in our assessment of changes of educational inequality over time. We will examine the implications of this when considering the robustness of our results.
Educational inequality and the expansion of education
We use the data gathered to assess the development of educational inequality in the context of a general improvement in measured educational outcomes. The Coleman report of 1966 (Coleman et al., Reference Coleman, Campbell, Hobson, McPartland and Mood1966) and Boudon (Reference Boudon1974) argued that rising education levels would reduce educational inequality, as those from poorer families would see rising educational participation while the well-off would plateau. This is particularly likely when, as here, measures of educational attainment are discrete, making them subject to ceiling effects.
To explore directly the relationship between educational inequality and the expansion of education we add a variable that accounts for the proportion of a given cohort achieving the expected education level (prop) as illustrated in equation (2). We adopt a flexible functional form here, f (prop) noting that the relationship between gaps and achievement may be non-linear and subject to a ‘tipping point’. Changes in the coefficients on the cohort dummies (c) between equations (1) and (2) will indicate the extent to which observed changes across cohorts can be explained by educational expansion.
 $$\begin{eqnarray}
ed\_ga{p_{lcs}} &=& \widehat {{\alpha _2}} + \hat \pi c + \hat \tau f\left( {pro{p_{lc}}} \right) + \hat \varphi leve{l_{cs}} + \hat \omega SE{S_{lc}} + \hat \theta level*SE{S_c} \nonumber\\
&&+ \hat \vartheta hig{h_{lcs}} + \hat \mu high*leve{l_{lc}} + {\hat u_{lcs}}
\end{eqnarray}$$
$$\begin{eqnarray}
ed\_ga{p_{lcs}} &=& \widehat {{\alpha _2}} + \hat \pi c + \hat \tau f\left( {pro{p_{lc}}} \right) + \hat \varphi leve{l_{cs}} + \hat \omega SE{S_{lc}} + \hat \theta level*SE{S_c} \nonumber\\
&&+ \hat \vartheta hig{h_{lcs}} + \hat \mu high*leve{l_{lc}} + {\hat u_{lcs}}
\end{eqnarray}$$
The returns to education
In the final part of this paper we consider the earnings differentials associated with qualifications. These are an indication of the labour market earnings that are associated with a given level of education, and allow us to predict the implications of the educational inequalities observed for future trends in intergenerational mobility. As overall education levels increase, we may expect the increasing supply of skills to lead to a decline in the value of an additional qualification in the labour market, reducing intergenerational inequality still further.
To analyse recent trends in the labour market returns to academic qualifications, we present new estimates from the Labour Forces Survey 2004 to 2010, pooling quarterly data each year for all full-time employed males aged 26 to 65. We estimate equation (3), regressing log hourly earnings, on all academic qualifications attained for each survey year. By including all academic qualifications rather than the highest attained, the returns can be viewed in an additive sense.Footnote 5 The typical person with a degree will get returns to GCSEs, A levels and their degree compared to someone with no qualifications. X i is a vector of control variables including ethnicity, region and a quadratic function of age.
 $$\begin{equation}
y_i^{} = \widehat {{\alpha _3}} + \hat \rho ed_i^{} + \hat \delta X_i^{} + {\hat u_i}
\end{equation}$$
$$\begin{equation}
y_i^{} = \widehat {{\alpha _3}} + \hat \rho ed_i^{} + \hat \delta X_i^{} + {\hat u_i}
\end{equation}$$
Our returns analysis has two limitations. One is that the information we have is not detailed enough to be able to observe the returns to elite levels of attainment. Second, we can only observe trends in labour market returns for those cohorts who are already old enough to be working in the labour market; we do not have sufficient sample size to consider returns for recent labour market entrants only. As a consequence the picture of mobility for younger cohorts remains incomplete. For both these reasons we therefore use the evidence on trends in the returns to education to inform our discussion rather than to assert any strong conclusions about future trends in mobility.
3. Trends in educational inequality
We begin by examining trends in degree attainment and higher education participation by family background. Panel A of Table 4 presents estimates of degree attainment by age 23 from the NCDS and BCS cohorts constructed from the BHPS. Educational inequality (measured as the gap in degree attainment between the top and bottom 20 per cent of parental income distribution at age 16) begins at 14 percentage points (ppts) in the NCDS before increasing dramatically to 30ppts in the BCS. This is driven by a large increase in the proportion of those from the top income quintile obtaining a degree during this period. Educational inequality continued to increase slightly for the later BHPS cohorts reaching 34ppts for the most recent cohorts.
TABLE 4. Proportion achieving expected levels of attainment over time by family background

Notes: Panel A, BHPS parental income measured using the Jenkins net household income files removing any additional labour income. N =5706, 4706, 383, 535. Source: Blanden and Machin (Reference Blanden and Machin2013) and additional calculations. Panel B, SES defined by combining Free School Meals (FSM) status with neighbourhood based measures of Index of Multiple Deprivation (IMD), their ACORN type, the proportion of individuals who work in high class jobs, the proportion of highly educated individuals, and the proportion who own their home. Source: Crawford (Reference Crawford2012). Panel C, Based on the authors own calculations using parental income. N = 7841 in the NCDS; N= 3769 in the BCS; N= 638 in the BHPS 1975–1980; N= 401 in the BHPS 1981–1986; N= 6319 in the LSYPE. Panel D, Source: Gregg and Macmillan (Reference Gregg and Macmillan2010)
Panel B of Table 4 presents results from Crawford (Reference Crawford2012), who analyses higher education participation at 18/19 for those born between 1986 and 1991 who turn 18 between 2004 and 2009, slightly later than the last cohort in panel A. Looking across the two tables demonstrates the underlying expansion of the HE sector, with total participation increasing from just 10 per cent for those born in 1958 to 34 per cent for those born in 1991. The results from Panel B demonstrate that participation increased faster for the most deprived quintile, where it was 5.8ppt higher for those born in 1991 than for those born in 1986, compared to the least deprived quintile where participation increased by 3ppts. This reduced the participation gap between the two groups from 40ppts for those born in 1986 to 37.2ppts for those born in 1991.
The reduced educational inequality found by Crawford is greater, in terms of percentage points, than that found in the University Participation Social Mobility Indicator which shows a slight fall in the FSM-Non-FSM gap of 1 percentage point from 19 to 18ppts between 05/06 and 10/11 (see Appendix Table A1). The precise measures used to capture family background appear to matter, although in this case trends clearly point in the same direction. If we return to Table 1 we notice that, while there was a slight increase in university fees affecting students who were turning 18 in 2006, the data is not up to date enough to capture cohorts affected by the more dramatic changes introduced in 2012.
Panel C, Table 4, presents evidence of the proportion attaining at least 1 A-levelFootnote 6 for the most deprived and least deprived family income quintile across a range of cohorts. The NCDS, BCS and BHPS are presented in the first four rows with new data from the Longitudinal Survey of Young People in England (LSYPE)Footnote 7 in the last row. Educational inequality peaks for the first BHPS cohort born in the late 1970s and then declines steadily to the most recent cohort born in 1990Footnote 8 . We can see a large increase in A-level attainment; rising from 14 per cent in the NCDS to 50 per cent in the last three cohorts.
Panel D of Table 4 presents trends in GCSE attainment by FSM status for cohorts born from 1986 up until 1995 using the NPD. The measure here is the proportion reaching 5 A*–C grades at GCSE level, with the proportion reaching this benchmark increasing from just over 50 per cent for the earliest cohort to almost 80 per cent by the latest cohort. Over this period educational inequality has been declining as FSM children catch up. Appendix Table A1 presents data from the older cohorts (counting GCSE equivalents to the O level and CSE examinations they took) by the most and least deprived families in terms of quintiles of family income. We see the gap in attainment at age 16 declining since its peak in the BCS cohort born in 1970. This result should be put in the context of the switch from O level/CSEs to GCSE in 1988 which means that the BCS was one of the last cohorts to be examined under the old system; once the GCSE was introduced, attainment increased rapidly.
Finally, we can consider trends in educational inequality at age 11 (Key Stage 2) for those born most recently. The final panel (E) of Table 4 provides the first available estimates of educational inequality for those born in the late 1990s up to 2000. The most recent cohort of observable pupils are currently in their early teens and will be sitting their GCSEs in the next few years. The table presents the percentage of children reaching level 4 in English and maths at Key Stage 2 by FSM status. For those born at the start of the 1990s, the gap between non-FSM and FSM eligible children in this measure was 27ppts. For those born by the end of the decade, this gap had fallen to 20ppts, a 7 point decline in the relative attainment at this threshold for non-FSM and FSM children. This decline in educational inequality occurred over a period when these results were included in league tables as a key measure of school performance.
Our analysis so far has focused on comparing the socio-economic status attainment gaps in the expected level of attainment across different education levels. While this is an obvious place to look, given the focus on these targets in school league tables, this may hide attainment gaps by family background higher in the attainment distribution, somewhat away from the Government's focus. We consider five alternative measures of achievement that signal higher attainment at different levels of the education system: post-graduate qualifications; attending high-status higher education institutions; attaining A*–B in three or more ‘facilitating’ A-level subjectsFootnote 9 ; reaching the equivalent of the EBacc at Key Stage 4; and reaching level 5 at Key Stage 2. These are all presented in Table 5.
TABLE 5. Proportion achieving higher levels of attainment over time by family background

Notes: Sources Panel A: Lindley and Machin (Reference Lindley and Machin2012), Panel B: Crawford (Reference Crawford2012).
Panel C: https://www.gov.uk/government/publications/social-mobility-indicators/social-mobility-indicators.
Panel D and E based on the authors own calculations.
Lindley and Machin (Reference Lindley and Machin2012) use the cohort studies to demonstrate that the greater part of the recent growth in postgraduate qualification between the cohort studies is to be found among those from higher social backgrounds. These results are shown in the top panel of Table 5, revealing faster growth in postgraduate attainment among those in the richest family income group between the NCDS and BCS (8 per cent to 13 per cent) compared with those in the poorer group (1 per cent to 2 per cent).Footnote 10 This aspect of educational inequality has received minimal attention at present, and is not yet addressed in the Government's SMIs.
At first degree level, it is becoming increasingly clear that institutions and courses attended are crucial to determining success (Hussain et al., Reference Hussain, McNally and Telhaj2009; Chevalier, Reference Chevalier2011; Walker and Zhu, Reference Walker and Zhu2011). The Government acknowledges this by including as a social mobility indicator the share of A-level students who are attending the most prestigious universities at age 19, by school type. Large inequalities are found in this measure with a gap of almost 40ppts. Over the four years for which this information is available, there is little evidence of change. Crawford repeats her analysis presented in Table 4 for high status institutionsFootnote 11 only and similarly finds no change in the gap in participation between the least deprived and most deprived quintiles of socio-economic status (Panel B, Table 5). This suggests that, while gains are being made in increasing the participation of the poorest students at universities overall, this is not filtering up to the elite institutions.
The subjects that are studied at A-level play an important role in the application process for universities, particularly elite institutions. This is acknowledged in the government's SMIs by looking at the proportion of students from state and private schools that obtain at least 3 A*–B grades in facilitating subjects that appeal to elite institutions. As can be seen in Panel C of Table 5, there is no clear trend in the gap between non-FSM and FSM pupils hitting this target across the period. This suggests that the gains being made in terms of educational inequality are not playing out at the very top of the attainment distribution.
The issue of subject choice is also pertinent at GCSE. Evidence from Sullivan et al. (Reference Sullivan, Zimdars and Heath2010) suggests that children from more affluent backgrounds are choosing subjects that are more suited to further study at A-level and beyond (such as single sciences, humanities and languages). At the other end of the scale there is a concern that some children have been pushed towards ‘soft-options’ in order to meet targets. In Panel D of Table 5 we consider attainment in the synthetic English Baccalaureate by FSM status. First, it is startling how few children reach this milestone: just 18 per cent of the cohort in 2004 and 15 per cent in 2010. The proportion of children who are eligible for Free School Meals who achieve at this level is extremely small, around four per cent throughout. There is slight evidence of a fall in this gap, which is driven by the worsening of performance among the non-FSM group. The evidence at GCSE suggests that the reduction in inequality, observed at the benchmark level of attainment at age 16, is not present at higher levels of attainment at the same stage.
Finally, we consider trends in educational attainment by FSM status in the higher end of the distribution of Key Stage 2 test scores for more recent cohorts. We observed that the attainment gap has been closing for children reaching Level 4. The final panel (E) of Table 5 presents attainment at Level 5 in English and Maths: we can see that the proportion of FSM and non-FSM children reaching this higher threshold has increased over the past decade from 6.6 per cent to 10.3 per cent for FSM children and from 25.5 per cent to 32.0 per cent for non-FSM children. The findings show that non-FSM children slightly extended their advantage over FSM children over the period: the attainment gap increased from 19ppts in 2002 to 22ppts in 2010.
Taken together, the evidence on the most elite educational achievements shows that young people from more disadvantaged backgrounds are failing to catch up with their more advantaged peers.
To pull together all of the evidence on educational inequalities and visualise the evolution of educational inequalities over time, we model the relationship between cohort of birth and 59 attainment gaps at expected levels of achievement across cohorts and education level (Table 4 and Appendix Table A1) and an additional 18 attainment gaps from Table 5. Figure 2 plots the birth cohort coefficients from estimating model (1) on this data.

Figure 2. Trends across time in attainment gaps
It is clear that educational inequalities initially rose for cohorts born up to the late 1970s and then fell for more recent cohorts. A picture is emerging therefore of an increase in educational inequality between those born in 1958 and those born in 1970, which continued into the early 1970s, consistent with the decline in overall levels of intergenerational income mobility found by Blanden et al. (Reference Blanden, Goodman, Gregg, Machin, Corak and Corak2004). For those born in the late 1970s and early 1980s, this trend appears to have slowed, followed by a reduction in educational inequality at Key Stage 4 which has been borne out in a reduction in educational inequality in higher education participation for the youngest cohorts to have reached this stage so far. For the youngest group, born in the late 1990s, this reduction in educational inequality has continued and can be observed in their Key Stage 2 test scores at age 11.
Robustness
In Section 2 we described several possible limitations of our data. The first of these is that our models are based on a variety of different measures of family background. Ideally we would show our results to be robust when using any and all measures of family background, but this is not possible as not all are available in every dataset. As a first step we use measures of educational inequality based on free school meals receipt where possible (in the BHPS we use parental receipt of Income Support or Job Seekers Allowance as a proxy). The results of this are shown in Appendix Figure 1, based on 51 observations of educational inequality by FSM. Focusing on one measure of family background, the overall trend across cohorts in educational inequality is unchanged. We have also experimented with a number of other measures of family background in the NCDS, BCS and BHPS and results are also robust to these, as shown in Appendix Table A2.
A second concern was that the administrative data does not include those educated in private schools although these are featured in the survey data. Data provided in Green et al. (Reference Green, Machin, Murphy and Zhu2011) indicates that although the share of English pupils in private schools varied from 1964–1990 it has remained close to 7 per cent since 1993, indicating that the exclusion of private school pupils from the more recent data should not affect measured trends in educational inequality. An alternative approach would be to assess the trends excluding private school pupils from the survey data whenever possible. The results from this are included in Appendix Figure 2, and again it is notable how little difference this makes.
Our final concern is that the observed recent gains in educational inequality are based only on early educational achievement: this may bias our assessment. It is impossible to know if recent declines in educational assessment will persist as cohorts age. Nonetheless, we have examined lifecycle and cohort changes in the NCDS and BCS and can demonstrate that changing patterns of inequality at age 11 and 16 were mirrored at degree level.
In summary, our results appear to be robust to differences in measurement and sample selection. As far as we can tell, the recent decline in educational inequality is not a consequence of the missing data on more recent cohorts.
4. Educational inequality and the expansion of education
In section 3 we observed evidence of improvements in educational inequality during educational expansion, as disadvantaged students catch up with their more advantaged peers. The recent decline in educational inequality has been driven by those at the bottom catching up rather than those at the top falling back. At higher levels of attainment, educational inequality is stable in the context of a constant (and low) proportion of each cohort reaching these elite levels. We therefore suspect a strong relationship between the proportion of children crossing the line and inequality by background.
To understand how to best account for this we look at the raw relationship between educational inequality and educational expansion. Figure 3 plots a locally weighted regression estimator (lowess)Footnote 12 of educational inequality across all 77 observations of attainment gaps and total rates of attainment. The relationship between educational inequality and educational expansion is concave: educational inequality is increasing in total attainment rates up to some critical threshold, when around 40–50 per cent of the cohort reaches the given level of attainment, at which point educational inequality declines as the total proportion reaching any given level of attainment increases further.

Figure 3. The raw relationship between educational inequality and educational expansion
Our second model therefore additionally controls for a quadratic function of total attainmentFootnote 13 to allow for a possible peak in educational inequality. Comparing the dashed and solid lines in Figure 4, conditioning on overall attainment levels eliminates the improvement in educational inequality that we witnessed for more recent birth cohorts, suggesting that this can be explained by recent expansions in educational attainment.
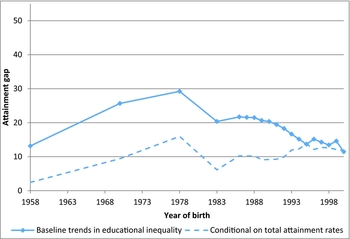
Figure 4. Conditional trends across time in attainment gaps
The coefficients on total attainment and its square confirm that the relationship between expansion and educational inequality is a concave function, increasing in total levels of attainment up until a turning point when 40 per cent of the total cohort reaches the threshold of attainment and then decreasingFootnote 14 . This is consistent with Boudon's suggestion that, beyond a tipping point, increasing overall attainment (or increasing participation where that is relevant) reduces educational inequality as individuals from the bottom of the income distribution catch up with those at the top. Ram (Reference Ram1990) finds a very similar pattern, when considering evidence from 100 countries on educational inequality and average levels of schooling.
In early cohorts the total proportion attaining given levels of qualifications are far below 40 per cent. Expansions in educational attainment are therefore coupled with increases in educational inequality for these cohorts and measures of attainment. Between the NCDS and BCS birth cohorts, increasing educational inequality accounted for up to 85 per cent of the decline in intergenerational income mobility over time in the UK (Blanden et al., Reference Blanden, Gregg and Macmillan2007). For more recent cohorts, educational expansion has passed the critical threshold at expected level of attainment at Key Stage 2, 4 and 5, leading to a decline in educational inequality at these levels. While educational inequality has begun to decline in degree participation, these trends are less pronounced as the total participating is still short of the 40 per cent mark.
At higher levels of attainment, the total proportion reaching this threshold is quite far below this turning point and so we are likely to see a widening of educational inequality as the total proportion attaining these qualifications increases in the coming years. This would be consistent with the hypothesis of education being used as a positional good.
5. The returns to education
Up until this point our focus has been on estimating trends in educational inequality. We now turn our attention to the other side of the story, the reward to qualifications in the labour market. If educational inequality declines over time, due to an increasing number of individuals achieving the expected level of qualifications, this could lead to a reduction in the returns to education. The combination of decreasing educational inequality and lower labour market returns would mean that education will play a less important role in the transmission of SES across generations.
The results from estimating equation (3) are presented in Table 6. As discussed in section 2, the models include all academic qualifications attained for each individual rather than the highest level of qualification and, therefore, the returns to each qualification level are additive.
TABLE 6. The returns to qualifications over time from the Labour Force Survey 2004–2010 – All full-time employees, males

Notes: Based on the authors’ own calculations. No qualification data available in Jan-Mar 2004 and 2005 hence smaller samples. * sig at 1%, + sig at 5%. Standard errors in parenthesis. Controls for age, age squared, region and ethnicity.
The estimated earnings differentials associated with qualifications are broadly flat over the past 15 years (from 1996 onwards) following a rise in the previous 15 years (Harkness and Machin, Reference Harkness and Machin1999). If anything there is a slight increase in the average earnings differentials for first and higher degrees. This is despite the proportion of people taking these qualifications continuing to rise (3.8ppt increase for degrees, 2.1ppt increase for higher degrees). This suggests continuing increases in demand by employers for high level academic qualifications.
The estimates shown in Table 6 only provide information on the average earnings differential. This may mask heterogeneity in returns, which will be of particular interest if they are associated with family background. Family background measures are limited in the LFS but we have investigated returns among the upper and lower quartile of earnings. There is no evidence of significant change in these measures across the period.
6. Conclusions
This paper reviews the evolution of educational inequalities among recent UK cohorts which are intimately connected with social mobility. Despite substantial changes in the provision of, and access to, education over the last half of the previous century, the most recent evidence available in the UK suggests that social mobility has not improved (Blanden et al., Reference Blanden, Goodman, Gregg, Machin, Corak and Corak2004, Erikson and Goldthorpe, Reference Erikson and Goldthorpe2011). While education has been shown to be a key driver of immobility (Blanden et al., Reference Blanden, Gregg and Macmillan2007; Blanden and Machin, Reference Blanden and Machin2004, Reference Blanden and Machin2013), questions have been raised about whether education policy can serve to weaken the relationship between socio-economic positions across generations (Goldthorpe, Reference Goldthorpe2013). We re-consider the role of education in promoting/limiting social mobility, assessing the relationship between educational inequality, educational expansion and family background over time.
It is very clear that gaps have narrowed by family background at several important education milestones. This occurred at a time when educational outcomes were improving, as a policy focus on education led to increased public educational investment, a prescriptive focus on standards and an increasing use of school league tables from the mid-1990s onwards. As predicted by Boudon (Reference Boudon1974), this expansion in educational attainment has had the desired effect of raising the attainment of those at the bottom of the income distribution to bring them closer to their more affluent counterparts. This decline in educational inequality is clearly encouraging for the promotion of children's life chances and may lead to improvements in mobility if returns to education remain stable as they have been over the past fifteen years in the UK.
On the other hand, there is little evidence that these improvements have reduced inequality at the highest levels of attainment: this can be taken to provide evidence of the ‘regime's important self-maintaining properties’ (Goldthorpe, Reference Goldthorpe2013: 443), or it can simply be seen as a consequence of increased educational attainments improving outcomes of the top attainers as well as other groups. Our findings suggest that, as the total proportion moving into these higher levels of attainment increase in the coming years, this will lead to an increase in educational inequality. It is therefore important the Government monitors inequalities in elite attainment in the SMIs.
We cannot predict how the returns to higher-level, or more finely grained, measures of education will evolve in the labour market, but evidence from other studies suggests that the type of institution attended and subject choice matters. Those who take the ‘right’ subjects and attend highly regarded institutions receive higher earnings later in life (Hussain et al., Reference Hussain, McNally and Telhaj2009; Chevalier, Reference Chevalier2011; Walker and Zhu, Reference Walker and Zhu2011). Combining this evidence with stable, and likely increasing, educational inequality in higher attainment in the coming years, the picture for future trends in mobility is less positive.
Overall then our conclusions on the likely trends in intergenerational mobility following recent educational expansion are mixed. While there is some cause for optimism it also seems likely that the goalposts are moving, and this must be reflected both in research and policy. However, we should not see the policies which have succeeded in closing the gap in educational attainment between more and less deprived children as a failure. Relative social mobility is not the only goal of education policy: the life chances of these children have improved in an absolute sense; higher skills clearly have intrinsic benefits.
Nonetheless the recent UK experience leads to some challenging questions. If relative education matters then more radical interventions are required to help disadvantaged students keep up or, alternatively, better-off parents need to be prevented from using all the resources at their disposal to push their children. Two examples of such policies would be the use of lotteries to determine access to the best schools, breaking the link between residence and access, or the use of contextual admissions policies by universities, which favour children brought up in poorer areas or attending worse schools. Such interventions raise other challenging questions about fairness and efficiency. An alternative view is that educational policy is likely to be ineffectual in a nation where income inequality is high, and well-off parents have the means and incentives to ensure their children do well. These important issues are beyond the scope of our research, but the trends examined here should help to inform this debate.
Appendix
TABLE A1. Other attainment data included in the analysis of the relationship between educational inequality and overall attainment
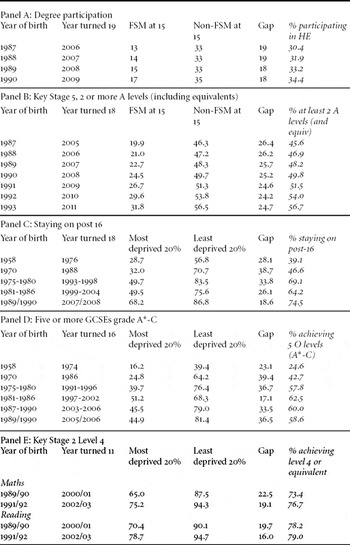
TABLE A2. Educational inequality in degree attainment across a range of measures of family background


Appendix Figure 1: Trends across time in attainment gaps – based on Free School Meals onlyNote: Sample size is 51

Appendix Figure 2: Trends across time in attainment gaps – Private School pupils excludedNote: Sample size is 77


