


Introduction
Governance research in regulation often focusses on two subjects: explaining the independence of sector regulators (Levy and Spiller Reference Levy and Spiller1994; Gilardi Reference Gilardi2002; Guardiancich and Guidi Reference Guardiancich and Guidi2016; Badran Reference Badran2017; Hanretty and Koop Reference Hanretty and Koop2017) and assessing the effects on markets of regulations produced by independent regulators (Stern and Cubbin Reference Stern and Cubbin2003; Andres et al. Reference Andres, Guasch and Straub2007; Bloomfield et al. Reference Bloomfield, Brüggemann, Christensen and Leuz2017). However, we argue that markets are not regulated by one sector’s regulator but rather by a multitude of public organisations that influence each other when making regulatory decisions. Sector regulators must interact with other public organisations (Jordana and Sancho 2004; Aubin and Verhoest Reference Aubin and Verhoest2014; Mathieu et al. Reference Mathieu, Verhoest and Matthys2016), while at the same time, several other actors (i.e. market operators, trade organisations) may try to influence the regulatory decision-making processes. Knowledge about the extent to which such public and other types of actors actually influence each other when making regulatory decisions is still limited (see, e.g. Ingold et al. Reference Ingold, Varone and Stokman2013; Koop and Lodge Reference Koop and Lodge2014). However, in the literature, the way in which such de facto patterns of influence between these actors can be explained is still underdeveloped, with the exception of the literature on regulatory capture.Footnote 1
Some research has focussed on studying the interaction and coordination between regulatory bodies in the context of European regulatory networks (Levi-Faur 2011; Iborra et al. Reference Iborra, Saz-Carranza, Fernández-i-Marín and Albareda2017). This literature focusses on the interaction between regulatory networks and national regulatory agencies (Levi-Faur 2011), the reasons why these networks emerge (Mathieu Reference Mathieu2016), the governance of such networks (Iborra et al. Reference Iborra, Saz-Carranza, Fernández-i-Marín and Albareda2017) and their effects (Maggetti Reference Maggetti2014). Typically, such regulatory networks bring together the different national sector regulators with or without a supranational (European) regulatory actor. Although this literature is valuable, the focus in this article is on the interaction between regulatory actors within a given country who are involved in making regulatory decisions about a specific market. This interaction occurs among the sector regulator, other public actors with some regulatory functions in the same sector (like ministries), the competition regulator, regulators from other adjacent policy sectors that are involved in regulating operators in that sector’s market and regulatees.
Thus, this article aims to study the way de facto regulatory decisionmaking occurs in a multiactor regulatory arrangement.Footnote 2 More specifically, we seek to explain the extent to which actors actually influence each other when making regulatory decisions. This article targets the regulatory decision-making process itself and not the outcome of a given regulatory decision. However, we argue that our analyses can help to understand regulatory policy outcomes since the manner in which regulatory decisions are made influences the outcomes of such decisions.
This article uses inferential social network analysis (SNA) techniques. This approach allows us to include and assess the de facto role in the regulatory arrangement of all the relevant actors, including the regulatees, who are considered by the other actors to have influence on the regulatory decision-making processes. In contrast, studying these relations between actors by analysing the formal decision-making processes as stipulated in legislation, collaboration agreements and procedures (see, e.g. Koop and Lodge Reference Koop and Lodge2014; Mathieu et al. Reference Mathieu, Verhoest and Matthys2016) runs the risk of excluding influential actors without a formal decision-making role.
In addition to contributing to the body of literature that focusses on the interaction among actors when making regulatory decisions by providing explanations, this article also contributes to the literature by using an innovative method that allows us to study relations between regulatory actors in a robust inferential way. We use exponential random graph models (ERGM), which are stochastic models estimating the probability of the formation of a specific observed network with a given number of nodes (actors) from the formation of all other possible networks with the same number of nodes.
The empirical analyses focus on the telecommunications market in Colombia. We study Colombia because this country began liberalising its utility sectors at the end of the 1980s and the beginning of the 1990s. Latin American countries followed a similar liberalisation path, as they all implemented the Washington Consensus recommendations. Furthermore, Jordana and Levi-Faur (2005) found that there was a contagious diffusion of these types of reforms among Latin American countries, which suggests that the liberalisation of the telecommunications sector in one country had an effect on the liberalisation of other countries’ telecommunications sectors. In the methodology section, we will explain why findings on Colombia can also be generalised to countries outside Latin America, particularly because some other studies have found similarly complex regulatory decisionmaking in countries outside Latin America.
We selected the telecommunications sector because it was liberalised sooner than other liberalised public services, thereby making this sector more mature and one that has more private actors involved (e.g. post, electricity and public transport; Bognetti and Obermann Reference Bognetti and Obermann2008). In addition, this sector is able to depend less on network infrastructure, which has allowed more actors to enter into the telecom market, as there are no longer natural monopolies (in contrast, in the energy sector, there are still submarkets that allow only one operator, e.g. energy transportation). The possibility for more private actors to be active in the market makes the interaction of actors more complex, particularly since these actors gain the opportunity to influence the manner in which regulatory decisions are produced.
In the remainder of this article, we first present the theoretical framework that we use to measure and explain the regulatory decision-making process at the de facto level. Second, the methodological choices are presented as well as the general characteristics of the Colombian telecommunication case. Then, we present the descriptive results of the analysis of the de facto influence relationships between actors in the regulatory decision-making process in the Colombian telecommunications sector. Third, we present the results of the inferential SNA, which allows us to explain these influence relationships. Finally, we present and discuss our main conclusions.
Literature review of the de facto regulatory decision-making process
Research into regulatory decision-making processes has shown that even when regulatory agencies have a great deal of independence, they must interact with other bodies when making regulatory decisions (Ingold et al. Reference Ingold, Varone and Stokman2013; Aubin and Verhoest Reference Aubin and Verhoest2014). Consequently, there is the need for coordination among the multiple actors involved in regulatory decisionmaking (Coen and Thatcher Reference Coen and Thatcher2008; Freeman and Rossi Reference Freeman and Rossi2012; Koop and Lodge Reference Koop and Lodge2014; Mathieu et al. Reference Mathieu, Verhoest and Matthys2016). The interaction between actors and the subsequent need for coordination can occur at different levels, between actors within a sector, across sectors, with supranational actors and with subnational bodies. This research has yielded interesting insights regarding the manner in which regulatory actors interact, but most of it has an important limitation; that is it mainly focusses on formal decision-making processes as they are stipulated in legal texts and not as much on de facto decisionmaking. In this article, we try to contribute to the trend of research that seeks to go beyond legal texts by looking at those interactions at the de facto level and seeking to explain them.
In particular, several researchers have used SNA methods to assess the independence of a regulatory agency at the de facto level, and these authors have found that formal independence and de facto independence differ. This finding holds for very different contexts, such as the situation in Switzerland (Ingold et al. Reference Ingold, Varone and Stokman2013; Ingold and Varone, 2014) and in Egypt (Badran and James; Badran Reference Badran2017).
This research has also found that several actors, including market operators, were able to influence the regulatory decisionmaking of the sector. This finding suggests that at the de facto level, the different actors involved in the regulation can influence each other in ways that are not considered in the legislation.
This former finding has opened a new research path in which it is not only possible to consider the involvement of public organisations in decisionmaking but also to consider the involvement of the organisations that are being regulated, the regulatees, and to explore how the latter exert influence (Black 2002).
The current research regarding the de facto regulatory decision-making process is very valuable, but it suffers from two main shortcomings. First, it looks at the different interactions in the regulatory decision-making process from the viewpoint of the sector regulator without looking at the whole structure of the network of interactions. Second, it uses mainly descriptive social network measures, which are powerful tools but do not offer explanations for the influence dynamics in regulatory decisionmaking.
In this article, we aim to overcome these limitations by studying the whole network of actors in terms of the dynamics of influence relationships in the de facto regulatory decision-making process and by relying on inferential SNA models to explain the dynamics of these influence relationships. Based on the above, we formulate two research questions that are addressed in this article.
RQ1. To what extent do the actors involved in the regulatory decision-making process in the telecommunications sector in Colombia influence each other?
RQ2. What factors explain the existence of influence relationships among the actors involved in the regulatory decision-making process in the telecommunications sector in Colombia?
Theoretical framework
To study the de facto regulatory decision-making process, one examines actual relations between organisations and the actual relative power position of each organisation in the arrangement. Therefore, we draw on the two-stage model of policymaking of Stokman and Zeggelink (Reference Stokman and Zeggelink1996) and Stokman and Van den Bos (Reference Stokman and Van den Bos1992), in which they study network structures in specific policy domains. Both articles argue that although an actor in a given network may not be the final decisionmaker, the actor’s power not only relates to that actor’s final vote but also to the actor’s capacity to influence the decision-making process and therefore make their interests heard.
Based on this idea, we developed a theoretical framework that explains how decisions are made at the de facto level by studying how actors (regulators and regulatees) generate influence relationships with each other when making regulatory decisions. The proposed model has three parts: first, a discussion about the concept of influence, the dependent variable of the study; then, a discussion regarding the implementation of the two-stage model of policymaking; and finally, the consideration of some network structural characteristics, which are discussed to account for the network nature of the data.
How to study influence
The aim of this article is to explain the existence of influence relationships among actors involved in the de facto regulatory decision-making process. For that reason, it is crucial to explain the manner in which influence is conceptualised. The interest group literature has substantially dealt with the concept of influence, relating it to the notion of the power that an organisation has (Dür and de Bièvre Reference Dür and De Bièvre2007; Dür Reference Dür2008). Power, in turn, can be understood as the property of an organisation or as a capability that an organisation has, which will imply a causal relationship (Hart Reference Hart1976) in which that capability produces a given outcome.
Dür and De Bièvre (Reference Dür and De Bièvre2007) suggest three ways in which to understand the influence of organisations as related to the power these organisations have: control over outcomes, control over resources and control over actors. This approach to influence implies studying the effects of power rather than power itself. In this article, we follow the control-over-actors approach to understand the influence that was mentioned by Dür and De Bièvre (Reference Dür and De Bièvre2007). The control-over-actors approach is based on Hart (Reference Hart1976), which takes the notion of Dahl, that is, “the ability of A to make B to do something, which he would otherwise not do”.
Dür (Reference Dür2008) distinguishes in the literature between three main approaches to measure an actor’s influence. The first one is by using process tracing (Pedler Reference Pedler2002; George and Bennett Reference George and Bennett2005; Michalowitz Reference Michalowitz2007). This approach studies variables, such as groups’ preferences, influence attempts, access to decisionmakers, response to influence attempts and the extent to which groups’ preferences are reflected in the decision outcome (Dür Reference Dür2008). The process tracing approach makes it possible to assess different factors and rival explanations and to evaluate whether the influence of a given organisation has a real effect on the outcome of a given decision. However, this approach also has some shortcomings (Dür Reference Dür2008). First, causal inferences are somehow difficult to determine (Loomis 1983), and it is problematic to generalise from these studies due to their small N design.
The second method to assess influence is by assessing the degree of preference attainment, that is the assessment of the extent to which the preferences of a given actor are ultimately incorporated into a policy outcome or decision. This method allows the assessment of influence when there is no visible process happening (i.e. secret lobbying). However, the first shortcoming is how to determine the preferences of actors (Tsebelis Reference Tsebelis2005). The second is using this method does not allow one to control for other possible explanations that are not related to the actor’s influence.
The third methodological approach, and the one that is taken in this article, is to measure the attributed influence. This is done by using surveys in which actors provide a self-assessment of their own influence or the influence of other actors. The major benefit of this approach is that it is relatively simple to use compared with other methodologies (Dür Reference Dür2008). Nevertheless, this method also has some limitations. The first one is that self-reported information can be biased, both in terms of overestimating influence (to stress the relevance of the organisation) and in underestimating influence (to avoid counter-influence responses). Furthermore, this approach does not measure real influence but perceptions of influence.
In this article, we measure attributed influence and argue that despite its limitations, it is the best measure to address the actors’ influence in a more systematic manner that allows for replication and generalisation. In addition, as will be seen in the methodological section, to overcome some of the shortcomings of this method, we accompanied the survey with interviews.
After presenting the conceptualisation of influence, in the remaining part of this section, we present the main theoretical factors that are used to explain influence relationships. This is divided into two parts. First, we present the main theoretical approach, the two-stage model of policymaking. Then, we present the network structure characteristics that we argue affect the influence relationships among actors involved in telecommunications regulatory decisionmaking.
The two-stage model of policymaking
Stokman and Van den Bos (Reference Stokman and Van den Bos1992) suggest that in a collective decision-making process, the final decision on a given issue is the result of the combination of two main moments: first, the actual decision moment, which is reflected by the voting power that each actor has, and second, a previous round of interactions in which each actor tries to influence the outcome of the decision based on their influence capacity.
The level of access each actor has and the power resources it owns to persuade the final decisionmakers to include its claims determines its influence. In sum, Stokman and Van den Bos (Reference Stokman and Van den Bos1992) suggest that in a decision-making process, there are three fundamental elements: voting power, timely access and power resources. These three factors determine the potential influence of each actor in a decision-making process.
Voting power is normally granted in legal texts and reflects the capacity of each actor to take or influence the actual decision-making moment. Timely access is defined as the contacts and interactions between organisations. An actor has more access when that actor is capable of greater interaction with actors in the network. Power resources are sector-based, meaning that they vary according to each sector and normally are related to the actor’s knowledge of the sector and specialised capacities.
It is possible to link the notion of the power resources suggested in the two-stage model of policymaking: with the resource dependency theory and with the interest group literature. The resource dependence theory (Pfeffer and Salancik Reference Pfeffer and Salancik1978; Alter and Hage Reference Alter and Hage1993) predicts that interactions happen because organisations cannot possess or control all of the resources needed to perform their functions or achieve their goals. Therefore, organisations generate ties strategically to access the resources that they need (Rethemeyer and Hatmaker Reference Rethemeyer and Hatmaker2008). These ties mean that an organisation in need of certain resources will try to access them by influencing the organisation that owns those resources. Linking this to the two-stage model of policymaking implies that one of the ways that an organisation influences the decision-making process will be by exchanging its resources for influence capacity.
There are two main types of resources that organisations in regulatory arrangements can depend on: information and the control of scarce sector-specific resources. Information refers to the information regarding regulatees’ activities, financial information and the regulatees’ compliance with regulations that regulators need in order to produce sufficient and appropriate regulation for a competitive market. To handle this information asymmetry and to obtain the required information, regulators can establish informal influence relationships with regulatees.
The argument that organisations use their resources to influence other organisations is also common in interest groups literatures (Gerber Reference Gerber1999; Hall and Deardorff Reference Hall and Deardorff2006). In this regard, the interest group literature has suggested that interest groups have special knowledge that can facilitate the tasks of decisionmakers; specifically, they have market information that decisionsmakers need (Hall and Deardorff Reference Hall and Deardorff2006).
Furthermore, the interest groups literature has highlighted that not all interest groups are equally able to influence policymaking. Interest groups that are composed of firms (such as those considered here) rather than individuals tend to have more capacity to mobilise their resources (Gerber Reference Gerber1999; Dür and Mateo Reference Dür and Mateo2014).
In addition, the capacity that interests groups have to exchange their resources for influence is linked to the demand that decisionmakers have for such resources (Kohler-Koch Reference Kohler-Koch1994). This demand is affected by two elements: the value of those resources for public actors in terms of reelection or in terms of achieving certain policy objectives and, second, the availability of alternative resources (Dür Reference Dür2008). In the case of regulators and regulatees, the resources that the latter have can be considered both as substantial in terms of achieving the policy objectives of the regulators (not in terms of reelection, as they need not be reelected) and as irreplaceable, as regulators would have no place else to obtain that information.
Another issue that is discussed in the interest group literature is the relation between the type of issue (i.e. policy type, degree of technology and public salience) and the influence that interest groups can have over it (Lowi Reference Lowi1964; Dür Reference Dür2008). Particularly relevant for this article is the argument that when issues are more technical, interest groups are more able to influence them (Greenwood Reference Greenwood2007; Beyers Reference Beyers2008). The decisionmakers of high technical issues depend largely on the information that interest groups can provide (Bandelow et al. Reference Bandelow, Schumann and Widmaier2000).
For all these reasons, we believe that the resources that an actor has are significantly related to their capacity for exercising influence.
Following this argument, we suggest that in the regulatory decision-making process of Colombia, although the sector regulator, the telecommunications ministry, or other bodies have the final decision-making power, other actors try to influence the decisions in favour of their interests. In addition, this influence is determined by the access that actors have to the decision-making process and the power resources they own to exert that influence.
In addition to the potential power that each actor has, it is important to consider the actual mobilisation of that power. According to Zelditch and Ford (Reference Zelditch and Ford1994) and Stokman and Stokman (Reference Stokman and Stokman1995), the actual exercise of the potential power in a decision-making process depends on the expectation of each actor regarding the deviance of the outcome from their preference. An actor only tries to influence a decision-making process when there is a divergence of position with the actor or actors that make/s the final decision.
In this article, we concentrate on the decision-making process but not on the outcome of the regulatory decision itself. Thus, we focus our attention on the influence part (second stage) of the model rather than on the actual decision phase (first stage) of the model.
Based on this model, our initial hypotheses are the following:
Hypothesis 1: The more access an actor has to other organisations, the more likely it is that the actor will generate influence over those other actors.
Hypothesis 2: The larger the actor’s divergence in opinions from other actors in a decision-making process is, the more likely it is that the actor will generate influence over those other actors.
Regarding power resources, we propose the following hypotheses:
Hypothesis 3: Because regulatees control information that is needed by regulators regarding their operations, regulators will generate influence relationships with regulatees.
The control of sector-specific scarce resources predominately affects the regulatees because they must compete for those resources and for the opportunity to enter the market. Some examples of scarce resources include the use of the frequencies in telecommunications, the use of electrical infrastructure or a permit to run a health institute. Regulatory frameworks establish how these resources should be allocated. The decisions over scarce resources can also be located in different regulatory bodies. Hence, the linkages between regulatees and regulators will depend on which actors control those resources. Based on the above, we draw the following hypothesis:
Hypothesis 4: Because regulators control sector-specific scarce resources that are needed by regulatees, regulatees will generate influence relationships with regulators.
Hypotheses 3 and 4 suggest that both regulators and regulatees control some resources that the other group needs. For that reason, in the analysis, we include a statistic that accounts for the possibility of reciprocal influence.
Although it is possible to identify the different resources that the actors control in the regulatory framework, an organisation can have different kinds of resources, as suggested by the interest groups literature (see Gerber Reference Gerber1999; Hall and Deardorff Reference Hall and Deardorff2006). These resources can be related to the knowledge, expertise or experience that an actor has and can give an actor the power to influence other actors. For that reason, we generate a more general hypothesis that aims to capture the more general power resources that actors have.
Hypothesis 5: The more power resources an actor has, the more likely that the actor can generate influence relationships with other organisations.
Network level variables
As noted by Cranmer and Desmarais (Reference Cranmer and Desmarais2011), when working with relational data such as ties of influence, it is not possible to expect that the relation or interactions between two actors are independent from the interactions among the other actors in the network. The authors suggest that ties that are present in a given network not only reflect the actors’ characteristics but also the whole network structure. For that reason, we included some network characteristics to explain how decisions are made at the de facto level.
Embeddedness
The notion of embeddedness is based on the argument that when two organisations have a relationship, the trust between them increases and the likelihood of having new interactions in the future increases as well. This explanation is rooted in the concept of embeddedness (Granovetter Reference Granovetter1985), which refers to the tendency of individuals and organisations to have transactions with individuals or organisations with a good reputation.
Gulati and Gargiulo (Reference Gulati and Gargiulo1999) distinguish between three types of embeddedness. The first type is relational embeddedness, which suggests that previous ties between organisations enhance the mutual knowledge of each other’s capacity and reliability and increase the chances that those two organisations will have ties in the future. The second type is structural embeddedness, which is the idea that if two organisations have previous links with the same third organisation, it is likely that the two first organisations will generate ties with each other. These two organisations can obtain information about each other from the common third organisation, and it is important that both organisations are considered trustworthy by that same organisation. The third and final type is positional embeddedness. Because centrally positioned organisations in the network are better positioned to obtain information and to gain access to resources, they are attractive to other organisations that seek to establish ties with them (Freeman Reference Freeman1979). We focus only on the two latter forms of embeddedness, as we only measure decisionmaking at a given moment in time and do not measure it repeatedly.
Based on this explanation, we have developed the following hypotheses:
Hypothesis 6: We expect to see influence relationships generated between organisations (either regulators or regulatees) with common links to a third organisation.
Hypothesis 7: We expect to find more influence relationships generated towards the organisations (either regulators or regulatees) with a more central position in the network.
Methodology
In this section, we discuss the case selection, and we describe how the data were collected and analysed in order to answer the research questions and test the proposed hypotheses.
Case selection
Figure 1, presenting the timeline of the liberalisation process in Colombia, shows that Colombia started its process of liberalisation in the late 1980s and reached a fully liberalised market by 2003. A simplification of the regulatory framework, which is still in place, occurred in 2009.
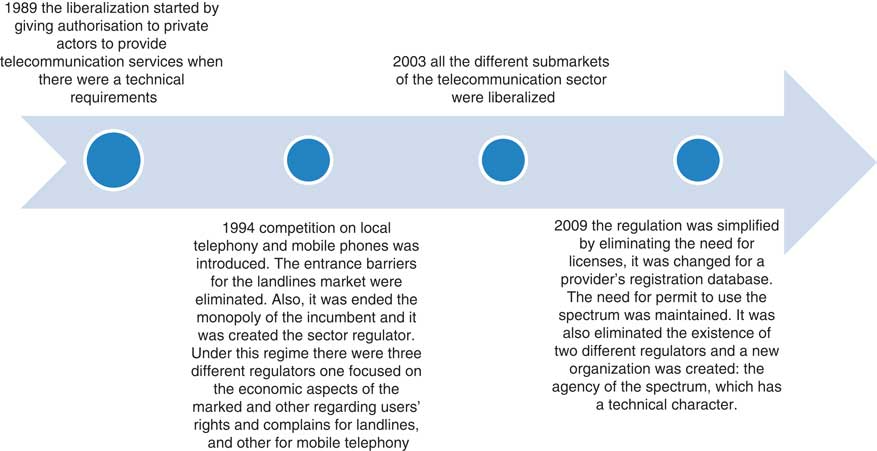
Figure 1 Timeline of the Colombian liberalisation process.
Today, Colombia has a rather complex regulatory arrangement in which several actors interact. The main sector regulator (Comisión de Regulación de Comunicaciones) mainly provides economic and social regulations. The telecom ministry, the national planning department, and three sector experts are represented on the board of the sector regulator. The telecom sector regulator also has some functions related to broadcasting, particularly the classification of television services and the regulation of non-subscription broadcasting.
The spectrum is managed by the spectrum agency and the telecom ministry. The telecom ministry is also in charge of funding the telecommunication network infrastructure in order to assure universal service. The environment ministry regulates the location of the antennas. The competition authority performs the ex post regulation related to anticompetitive behaviour and violations of consumers’ rights for both telecommunications and for broadcasting services. Finally, the specific functions of the broadcasting regulator are to grant licenses and permits for broadcasting services and to coordinate the administration of the spectrum for these services with the spectrum agency.
The market has three main national operators, one of which (Claro) was declared by the regulator as having a dominant position in the market. There is also a relatively large operator that is only regionally active in Bogotá. All these four telecom operators have expanded their activities into the broadcasting market. There are also three other virtual operators who do not have their own infrastructure. Finally, there are two main trade organisations that defend the interests of all the operators.
As can be seen, the situation in Colombia is one in which liberalisation has been completed and in which regulation presents a complex picture, with regulators needing to interact with each other and in which operators, acting in different markets, have significantly different market shares. For these reasons, Colombia is an interesting case to study how actors influence each other.
The specific components of the Colombian case complexity are, of course, specific to this case. However, the case of Colombia is also worth studying in its relation to other Latin American cases. As mentioned in the introduction, however, for several reasons, we argue that it is possible to generalise the Colombia case to other countries outside Latin America and even to developed countries. First, Colombia has been part of the International Telecommunication Union since 1914 and has adopted most of the organisation’s policy recommendations, which implies that the management of the telecommunications sector in this country is similar to that in many other countries that have adopted these recommendations. Furthermore, recently, Colombia started the process of becoming part of the Organisation for Economic Cooperation and Development (OECD): this process has required Colombia to make several reforms to meet the OECD standards, particularly with respect to the structure and independence of the sector regulator. This reform has made the regulation of the telecommunications sector of Colombia more similar to that of the OECD countries.
Moreover, other countries in the world have similar levels of complexity in their regulatory arrangements. González (2017) studied four Latin American countries (including Colombia) and found that similar complexity existed in Ecuador and Peru. There are multiple public actors with regulatory competences involved in the arrangement. In addition, González et al. (Reference González, Amin and Verhoest2014) did a similar study in which they analysed the telecommunications arrangement of nine countries: three European, three Latin-American and three South-Asian. In all countries, with variations of course, it was found that the regulatory decisionmaking involved complex interplays among actors with regulatory functions.
Furthermore, as mentioned earlier, using SNA techniques, some studies were conducted both in developed (Switzerland) (Ingold et al. Reference Ingold, Varone and Stokman2013; Ingold and Varone, 2014) and developing (Egypt) countries. Badran and James (Reference Badran and James2012) and Badran (Reference Badran2017) have found descriptive results that are compatible with those in this article in terms of the interactions among different public and private actors in regulatory decisionmaking.
Data collection
To collect the data for this article, we conducted a survey based on SNA. In this data collection technique, the main element is the mapping of the linkages between individuals or organisations. The main objective of SNA is to address relational data (Scott Reference Scott2000). These relations can take the form of a meeting, contact, formal or informal communication, and so on. In this case, we are interested in studying the influence linkages when making regulatory decisions between regulators and each other and between regulators and regulatees.
There are two fundamental elements when conducting an SNA: the nodes (actors or cases) and the ties (or linkages) (Hanneman and Riddle Reference Hanneman and Riddle2005). In our case, the nodes are all the public regulators involved in regulating the telecommunication market and all the telecommunications providers (regulatees) in Colombia. In our data collection, we also included all the other organisations with a role in the telecommunications sector, such as the providers’ associations or user organisations. The ties are the self-reported interactions that each actor has with other actors when making regulatory decisions.
To conduct the analysis, we interviewed the abovementioned actors in Colombia and asked them to fill in an instrument. The specific questions asked and used for the analyses are described in Table 2.
Initially, we identified 16 actors. To do so, we first analysed the legislation of the sector and listed all actors mentioned in that legislation as being involved in regulatory decisionmaking. We then performed an exploratory interview and asked a sector expert (a former senior officer of the telecom ministry) to list the organisations involved in the sector. In addition, when the survey was distributed, we asked the actors to suggest any other body with an important role in the telecommunications sector that could be missing from our list. One additional actor was suggested, and we ended up with a list of 17 actors. Based on this process, we believe that these actors are the relevant actors that play a role in Colombia’s telecommunications regulatory decisionmaking.
The 17 organisations were contacted for interviews and provided with surveys. We obtained responses from 14 actors, which is an 82% response rate. Table 1 presents an overview of the organisations and the respondents that were interviewed. The three actors that were not surveyed are three virtual operators, which are operators that do not have their own infrastructure and pay to use the networks and antennas of other operators. Therefore, they do not use the spectrum directly, and for that reason, we can expect that these actors do not need to interact as much with the public organisations that hold regulatory functions over the sector as the surveyed operators do. Moreover, these operators have a rather small market share. Therefore, we believe that excluding those operators from the sample is not very problematic for the validity of the results.
Table 1 Summary of organisations interviewed
Data analysis
For data analysis, we used a twofold strategy. First, we used the software Netdraw to present the descriptive results by generating a graphical representation of the influence ties. The second part of the data analysis strategy involves hypotheses testing. For this part, we used a recently developed technique of inferential network analysis, the ERGM (Cranmer and Desmarais Reference Cranmer and Desmarais2011). This statistical technique allows inferential analysis with relational data by using the characteristics of nodes (actors) and links (types of relations between actors, which normally take the form of a network of relations) and taking network structures into account.
The use of the ERGM model originated from the idea that network data are interdependent, meaning that every tie in the network depends on the existence of the other ties. Therefore, conducting a normal statistical analysis, such as logistic regression, is not possible because network data violate the assumption of independence of the observations. More precisely, when one is studying the relation between organisations, it is reasonable to expect that the relation between two actors will be affected by the relation patterns of all other actors in the network. Therefore, ERGM was developed to model whole network structural characteristics. The model treats a given network as a unique case, where N is equal to one, and then the model estimates the probability of having such a network over all of the other network possibilities that could exist with the number of actors (nodes) present. This is achieved through a stochastic process.
“Network characteristics” are the combination of relations that are likely to be present in a network because of the type of network. One example of this network structure is transitivity, which means that if one organisation has a relationship with two actors, those two actors are likely to have a relationship with each other. Another example is reciprocity, a characteristic applicable in the situation in which an actor will generate a tie with another actor that offers it a tie.
There are some reasons to believe that in the case of Colombia, influence relationships among the actors that are involved in the telecommunications sector will exist and that actors have knowledge of such interactions. First, Colombia is experiencing a rapid change in telecommunications technology, particularly in the mobile phone submarket, which has required operators to compete for new frequencies and portions of the spectrum. This has resulted in large packages of regulations and a tender process, which can incentivise operators to try to influence regulators’ decisions. This process has an open phase in which all operators meet with the sector regulator and present their positions and arguments regarding a specific regulation. In this moment, each operator gets to know the position and argumentation strategy of the other actors. In addition, the three main operators of the market belong to a common organisation that functions as a lobby when there is a common position over a given topic. However, when actors differ on their position, they engage in their own strategies, and thus, the other providers are aware that those actors are doing so.
Second, as the telecommunications framework of Colombia has divided the regulatory and control functions into different public bodies (González et al. Reference González, Amin and Verhoest2014), operators need to interact with various public bodies, and since the regulatory decisions are dispersed among many actors, it is likely that those public organisations need to influence each other in order to pursue their own regulatory position.
This model suits our purpose well because we included as explanatory factors in our theoretical framework the actors’ characteristics (e.g. resources), relational characteristics (e.g. the access that each actor has to each other individual actor, thus a network of access) and structural network characteristics (e.g. embeddedness). To assess the model, we used two different strategies. First, we used the Markov chain Monte-Carlo (MCMC) diagnosis function of R to check for degeneracy. This provides different statistics for each covariate and produces information about how well the model performs over time. It produces an MCMC chain over time as well as the respective histogram. In our case, both centred on 0, which is what is expected.
Moreover, we tested for the goodness-of-fit of the model. This is done by comparing the observed network with the simulated networks generated in the MCMC estimation process. It is expected that if the model is performing correctly, the observed and simulated networks look alike. This diagnosis produces Monte-Carlo empirical p-values, which represent the portion of the simulated values that are as extreme as the observed value (Luke Reference Luke2015). When these are small (less than 0.05), this indicates that the model is not capable of producing a particular network characteristic. We did not find such a case for any of the model specifications.
Based on the theoretical section, Table 2 presents the variables and network characteristics included in the model and how these variables are operationalised. The dependent variable of the model is the answer that every actor gave to the following question: “On a scale from one to five, what organisations have an influence on the decision-making processes of your own organisation regarding the execution of your tasks?” We only considered the report of incoming influences given by each organisation in the analysis, although we also asked for actors’ perceptions of the influence of their own organisation on other organisations. We focussed only on incoming influences because we believe that an organisation’s answers to questions about their own influence on others could be more biased than their answers about the influence of other organisations on their own organisation. This question is consistent with the conceptualisation of influence presented above, as it tries to capture the influence relationships among actors (control-over-actors) in the whole regulatory decision-making process and particularly as it specifically asks about the organisation’s decision-making process and not the decision itself. The notion of influence that is used was clarified during the interviews that accompanied the surveys. This was done in order to clarify any misunderstanding that might have emerged during the survey’s completion.
Table 2 Summary of the theoretical framework and operationalisation

Thus, this variable tries to capture the interactions that occur in regulatory decision-making processes.
The answers from the one-to-five scales were then recoded into a dichotomous variable, which takes the value of 0 when the reported score ranged from 1 to 2 and the value of 1 when the reported score ranged from 4 to 5. When an actor marked a 3 as the answer to the question, we used a different coding rule. This value could be coded as either 1 or 0, depending on the answer given by other actors to the question about perceptions of the influence of their own organisation on other organisations. Thus, if an actor A in a market with actor B claimed that actor B had an influence of 3 over their organisation, we then looked the degree of influence that the actor B claimed to have over actor A; if that influence was less than 3, then we coded the influence of B to A as 0. However, if the influence that actor B claimed to have over actor was more than 3, we coded the influence of B to A as 1.
Results
In this section, we present the results of this research. First, we present and interpret some descriptive results, particularly how the influence network looks graphically. Then, we present the findings of the ERGM models.
Descriptive results
Figure 2 shows the network that captures the influence relationships between different actors in the regulatory decision-making process of the telecommunications sector in Colombia. The graph represents the influence ties that are present. Each line represents an influence relation. Because the survey question asked each actor to indicate which other actor/s influence their decision-making process, we changed the direction of the lines in order to make the graph more interpretable. The actor located on the head end of the arrow is the actor that is influenced by the organisation that is at the other end of the arrow. Therefore, the more incoming head ends of arrows that a particular body receives, the more it is influenced by other organisations.
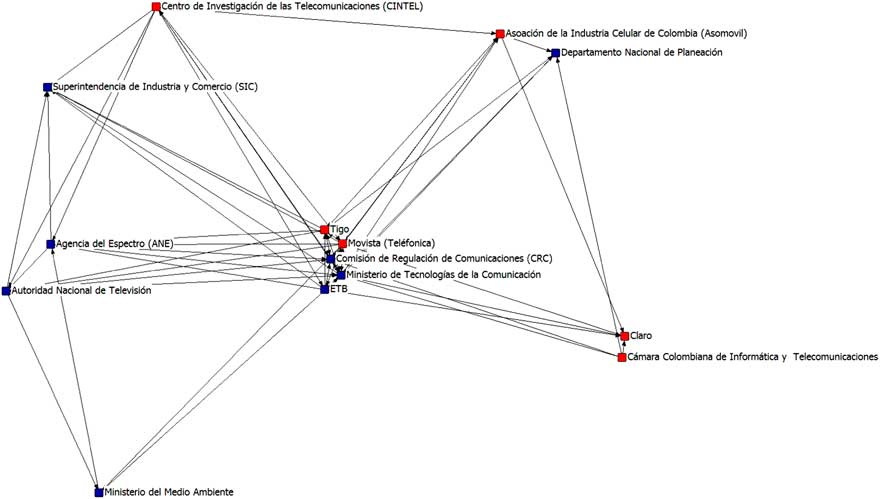
Figure 2 Network of influence relations.
The layout of Figure 2 was selected using the nonmetric multidimensional scaling feature of the Ucinet software, locating each node according to how similar it is to others. Hence, the nodes that are more similar are located closer together. In this case, similarity is understood as the nodes having similar shortest influence paths to all of the other nodes, which can be translated in the context of this article as having similar influence profiles. Thus, the location of the actors reflects their influence profile in terms of their capacity to influence other actors. Moreover, in this type of graph, the location of the node in relation to the overall network has a meaning. In Figure 2, the colours of the nodes represent whether the organisation is a public organisation with regulatory functions (nodes in colour blue) or whether the organisation is a private actor (nodes in colour red).
Figure 2 shows a major cluster in the centre of the network, which shows various types of actors. This cluster is composed of three public organisations, namely, the CRC (sector regulator); the telecom minister and the ETB (public operator); and two private operators, Tigo and Movistar. These organisations influence a similar range of actors.
In the bottom left part of the graph, there is a cluster of two private organisations: Claro, the largest operator in the market, and a trade organisation. The other regulators are the following: ANE (the spectrum agency), SIC (the competition authority), the environment ministry, and Autoridad Nacional de Televisión (the broadcasting regulator). These regulators are located on the left side of the graph and do not cluster with other organisations.
As mentioned, the location of each actor on the graph in relation to all the other actors represents similar influential profiles, which means that the organisations that are located closer together both influence similar organisations and receive influence from similar organisations. Thus, based on the previous findings, this positioning also means that the sector regulator’s role in the network is equivalent to that of the telecommunications minister and the three operators, which suggests that there are several organisations that have a capacity to influence that is similar to that of the sector regulator and that many of these are private operators.
Results of the ERGM model
In this section, we present the results of the ERGM models. With these models, based on the covariates and network characteristics specified, we give an explanation of the network of influence relationships presented in Figure 2. Thus, the results indicate the effect that each model specification has on the emergence of influence relationships in the given network. Table 3 presents the results of the models.
Table 3 Summary of the ERGM models

Significance codes: ***p<0.001 **p<0.05 *p<0.1.
To show the effect of including network statistics and the effect of the resulting possible bias if those statistics are not included, we present two different models: one including the network statistics and one without the network statistics.
The first element to note in Table 3, which compares the two models, is that two variables are significant with the same effect in the two models: access (with a positive effect) and power resources (positive effect). The other variables included in the models present different results across the two models, suggesting that the effect of those factors is affected by network structural characteristics. In Model I, the divergence of positions shows a negative effect.
Furthermore, when examining the size of the variables’ effect and the level of significance of the variables, one can see that they do differ across models. In Model II, the model without network statistics, some of the covariates’ effects are larger. This suggests that the effects of covariates may be inflated when not considering network statistics.
The goodness-of-fit of an ERGM model can be determined by the Akaike information criterion and the Bayesian information criterion statistics. The lower those statistics are, the better the model fits and explains the data (Luke Reference Luke2015). Model I, which includes network statistics, better fits the data. Of the five network statistics included in the models, two of them proved to be significant: idegree and 2-out start, both having a positive effect. The positive effect of the idegree variable suggests that the in-degree centrality of an actor helps to explain the existence of influence relationships. Thus, the popularity of an actor explains why that actor receives more influence relationships. The 2-out start statistic suggests that actors in a network tend to generate links with at least two distinct actors. The significant effect may indicate that actors involved in the regulatory decision-making network in Colombia try to influence multiple actors instead of focussing their efforts on influencing the decision-making processes of one actor.
Regarding the specific effect size of the significant variables, the variable with the largest effect is the access variable, which measures the amount of contact organisations have: this variable turned out to be the most relevant variable of the model. Another variable with a comparatively large effect is the reputational power variable; the other significant variables have a rather small effect. Table 4 presents the results of these analyses in terms of the specific hypotheses presented in the theoretical section.
Table 4 Summary of findings

Discussion and conclusions
In this article, we sought to explain how regulatory decisionmaking occurs in a de facto manner in the telecommunications sector in Colombia. After building a theoretical framework, we surveyed the actors involved in the telecommunications sector in Colombia. Then, using social network techniques, we generated analyses that answer the descriptive research question and the explanatory research question.
The results suggest that the regulatory decisionmaking at the de facto level in the telecommunications sector in Colombia functions as a network in which actors can and do influence one another’s decision-making processes. This finding is relevant because studies that only look at the decision-making process in a formal manner fail to perceive these situations. The findings of this study show that operators and regulators have similar influence in the decision-making process and that the ways in which they influence other organisations are similar. Furthermore, we show that some elements, such as the access an actor has to other organisations and the power resources of an organisation, are crucial for understanding why influence relationships occur.
The results of this article have important theoretical and methodological implications. First, in terms of theory, following the two-stage model of policymaking proposed by Stokman and Van den Bos (Reference Stokman and Van den Bos1992) and Stokman and Zeggelink (Reference Stokman and Zeggelink1996), we found that actors do try to influence each other in the decision-making process. From the three variables they use to operationalise influence, however, we only found solid support for the amount of access that an actor has to other actors as an explanation for the formation of influence ties. Furthermore, we found that the fact that an actor has a divergence of positions from other actors is not a trigger to try to influence the decision-making process of other actors. In contrast, we found that the divergence of positions is a motivation to try not to influence other actors.
Furthermore, the fact that the divergence of positions variable had a negative effect and that the reputational power variable had a positive effect may lend some support to Henry’s (Reference Henry2011) finding that suggests that these two variables interact. He found that in regional planning subsystems in California, actors do seek to generate ties with actors that are perceived as more powerful, but only with those that have similar ideological positions to them.
Regarding specific sector resources (information and control of scarce resources), we found that this was not relevant in explaining the influence relationships among actors involved in the telecommunications regulatory decision-making process in Colombia since both hypotheses were significant but had negative effects. However, we found that when an actor is perceived as having sufficient specialised knowledge and resources, that actor does receive more influence relationships. Thus, this might imply that what matters is not the specific resources that an actor controls but rather how resourceful these items are as perceived by the other actors. This finding may imply that the potential effect of resources in generating influence relationships needs to be interpreted in a broader manner. What are relevant are not so much the resources that an actor holds and another actor needs (information and scarce resources) but rather the perceived resources an actor has (in terms of knowledge and expertise) in the eyes of the other actors.
Furthermore, regarding the resource dependence theory, our findings have some particular implications for principal agency theory (Williamson 1981). In particular, these theories predict that the information asymmetry between the principal and the agent in favour of the latter causes the agent to be able to deviate from the received mandate. Therefore, the principal will attempt to exert control over the agent to prevent this from occurring. In our findings, information asymmetry (regulatees possessing information that regulators need) was not a trigger for the agent (organisations with regulatory functions) to attempt to influence the principal (regulatees).
An interesting finding of this article is that actors do not try to influence just one actor but rather to diversify their portfolio of influence. This may indicate that actors could strategically diversify their influence relationships over multiple actors to increase their possibility of influencing the decision-making process. This phenomenon relates to the fact that, as suggested in the two-stage model of policymaking, actors try to influence the final decisionmaker. Because the regulatory decisions are allocated to different actors, actors that seek to influence the decision-making process must influence different actors in different decision-making processes. This pattern goes in the same direction as what has been shown by Aubin and Verhoest Reference Aubin and Verhoest(2014), González et al. (Reference González, Amin and Verhoest2014) and Mathieu et al. (Reference Mathieu2016) regarding the fact that in regulatory arrangements, decisions are formally allocated to different actors and that different actors formally interact in the decision-making process.
An additional theoretical implication of this research concerns the role of the sector regulator. Research in regulatory governance has placed special emphasis on the independence of the sector regulator (Gilardi Reference Gilardi2002; Maggetti 2007; Verhoest et al. 2010; Selin 2015; Hanretty and Koop Reference Hanretty and Koop2017). The findings of this article contribute to this discussion. Here, we found that the sector regulator of the telecommunication market interacts with other actors at the de facto level. Furthermore, in the case of Colombia, for example, we found that there are many actors, including other regulators, market operators, think tanks and trade organisations, that influence the sector regulator of Colombia.
These types of interactions have been revealed by previous research in other countries (Badran and James Reference Badran and James2012; Ingold et al. Reference Ingold, Varone and Stokman2013). However, in this case, we have not only demonstrated that these interactions occur but also provided inferential statistics (ERGM) on some factors that explain why the actors involved in the regulatory decision-making process influence each other. As mentioned, we have shown that actors that have access to other actors have similar opinions and have larger power resources that can influence other actors (including the sector regulator).
These findings confirm what has been suggested by some scholars (Aubin and Verhoest Reference Aubin and Verhoest2014; Koop and Lodge Reference Koop and Lodge2014) who examine the independence of sector regulators only through formal characteristics stated in the law and assert that it is not enough to actually assess the independence of sector regulators (see, e.g. Ingold et al. Reference Ingold, Varone and Stokman2013).
Second, our findings may suggest that the notion of the independence of the sector regulator must be refined. The de facto results might imply that the independence of the sector regulator must be nuanced owing to the interactions that they have with other actors. Thus, it might be the case that a fully independent regulatory agency that is not affected by either other public or other private organisations does not exist in the real world. In this sense, research may consider reflecting on which elements and which levels of independence are achievable.
In terms of policy decisions, the aforementioned idea can be interpreted in two different ways. First, the important action is not to shield the sector regulator from interactions with other organisations in the decision-making process but to take actions to ensure that despite those interactions, the sector regulator can make its final decisions without interference. Second, if it is not possible to prevent the sector regulator from being influenced by other organisations, then the best option is to prevent certain bodies with specific interests from gaining more influence than the others.
Regarding the methodology, the results of this article support previous research conducted by Cranmer and Desmarais (Reference Cranmer and Desmarais2011), Scott (Reference Scott2000), and Hanneman and Riddle (Reference Hanneman and Riddle2005), who suggest that it is not possible to treat relational data as if the data represented independent observations. The models with network statistics, which aim to model relational dynamics, performed better than those without network statistics. Furthermore, we showed that failing to account for network dynamics leads to biased results.
In terms of policy implications, the findings of this article are also relevant, particularly for the discussion of the role of sector regulators in regulatory decisionmaking. If having a sector regulator that is not influenced by any other organisation at the de facto level is actually desired by a given country, then our findings suggest that limiting the access that other actors have to the regulator would be a means of obtaining this goal. The access variable turned out to be the variable with the most explanatory power to explain the manner in which regulatory decisionmaking occurs at the de facto level and, in particular, to explain the manner in which actors influence each other. Therefore, if the desire is for a sector regulator to not be influenced by other actors, then the amount of access that those actors have to the sector regulator must be restricted.
In terms of future research, we believe that the methodological approach, theoretical framework and findings of this study can serve as the basis for research in different sectors and other countries. We argue that what has been found here is applicable to any sector and country with a regulatory framework that includes several regulators (that hold regulatory functions) and several operators that can influence regulatory decisionmaking.
Technical annex and model diagnoses
The ERGM is a technique developed to model relational data. The basic assumption of independent observations is violated when dealing with relational data, such as network data. ERGMs were developed to replace models and statistical procedures that make said assumption.
The ERGM builds a likelihood function for a given network of interest Y that does not assume the independence of assumptions; done by considering Y as a single observation taken from a multivariate probability distribution (Cranmer and Desmarais Reference Cranmer and Desmarais2011). This means that Y is considered a unique draw from a multivariate distribution, where other networks are possible. The former does not imply that the model does not allow for modelling the effect of a given covariate in the formation of a link in a network. Once the model defines a joint distribution for the ties in the network, it infers the conditional distribution of the formation of any link given a specific covariate.
The derivation of the ERGM formula works as follows. First, it is necessary to make the following assumption: each of the calculated network statistics on a graph Y are the expected values of those statistics in all possible graphs. This means that Ε[Γi]=Γi, where Γi represents any network statistic. This is considered a strong assumption, yet as put by Cranmer and Desmarais (Reference Cranmer and Desmarais2011): “In many cases, we will only observe a single realisation of the network (i.e., there is only one realised Supreme Court citation network) and so the observed value of the statistic Γi is actually our best indication of its expected value Ε[Γi].”
The presented assumption is necessary to stablish an identifying condition to the probabilities of a network in  $$Y_{M} \,\colon\,{\rm {\rm E}}\left[ {{\rm \Gamma }_{m} } \right]{\equals}\mathop{\sum}\limits_{m{\equals}1}^M {P\left( {Y_{m} } \right){\rm \Gamma }_{m} } $$. At this point, and to finalise the identification of Y M, it is necessary to make a second assumption, and that it is only the statistics included in Γ produce observed graph, m. In other words, the model assumes a correct specification. This second assumption is included through the use of Gibbs entropy; more specifically, its maximisation on the discrete distribution of graph in Y M is represented in the following formula:
 $$S{\equals} {\minus}\mathop \sum\limits_{m{\equals}1}^M P\left( {Y_{m} } \right)\,\ln P\left( {Y_{m} } \right)$$
All these steps led to the following formula that represents the relation between the probability of seeing a network m and the network statistics Γ:
 $$P\left( {Y_{m} } \right){\equals} {{{\rm exp}\left( {{\minus}\sum_{j{\equals}1}^k {\rm \Gamma }_{{mj{\rm }}} \theta _{j} } \right)} \over {\sum_{m{\equals}1}^M {\rm exp}\left( {{\minus}\sum_{j{\equals}1}^k {\rm \Gamma }_{{mj{\rm }}} \theta _{j} } \right)}}$$
where θ represents a vector with k parameters and describes the relation between P(Y m) and the statistics included in Γ. P(Y m) estimates the probability of having the observed networks over all the other possible networks with the same number of nodes.
The previous formula creates a computational problem: its denominator demands the summation of all the possible network configurations with a specific number of nodes. In the case of an undirected network, this means  $2\left( {\matrix{ N \cr 2 \cr } } \right)$ possible configurations, value which increases drastically as N grows larger. To proceed, we need to estimate the likelihood functions as they cannot be explicitly calculated in every case. Most software that estimate ERGMs does so through MCMC maximum likelihood methods (Geyer and Thompson 1992).
The method works as follows: it uses an iterative process where the sum in the denominator is approximated by series of sampling of networks. Cranmer and Desmarais (2010: 75) describe it in the following terms “the sum in the denominator of the likelihood function is approximated using a series of networks sampled from the distribution parameterised with those parameters that maximised the likelihood using the previous sample of networks. This iterative optimisation proceeds until there is little change in the approximate likelihood function value. The covariance matrix of the parameters is then computed as the inverse of the negative Hessian of the log-likelihood function. Pseudocode for the Maximum Likelihood Estimation (MCMC-MLE) algorithm in Geyer and Thompson (1992), which is the algorithm used in most software packages for ERGM estimation.”
The ERGM model has some limitations that need to be highlighted. Two of the most relevant ones are degeneracy and sensitivity to missing data (Cranmer and Desmarais 2010). Degeneracy is a consequence of models that fit the data poorly. It indicates that it is unlikely that the parameters placed in the model would generate the observed network. In those cases, the model will not converge. This implies that one has to be careful about the covariates that fit to the model. Regarding missing data, the model is highly sensitive to missing observations and missing edge values, both of which can result in changes in the inference regarding the given covariates.
Descriptive statistics and model diagnoses
Descriptive statistics of the covariates
Goodness-of-fit for model statistics
MCMC chain over time.


