


From picking a suitable applicant from a box of application letters to choosing the right person to spend one's life with, we compare the advantages and drawbacks of each option and make the decision that yields the biggest benefit. Besides a series of rational calculations, some decisions can also be affected by our hidden primitive preferences. If you are asked to pick the object you prefer most from five similar objects that are horizontally displayed in front of you, you are very likely to pick the middle (centre) one and not the ones on the sides. This tendency, which is known as centrality preference, was first discovered and studied by Christenfeld in 1995.
Centrality and Attention
Centrality preference can be understood as an implicit rule that makes people prefer items located in the middle but not those at the extreme ends (i.e., leftmost and rightmost) (Christenfeld, Reference Christenfeld1995; Raghubir & Valenzuela, Reference Raghubir and Valenzuela2006; Valenzuela & Raghubir, Reference Valenzuela and Raghubir2009). Imagine that there is a bowl of coffee beans and people are required to sort out the good coffee beans from the bad ones. We would usually put the good coffee beans right in front of us and leave the bad ones inside the bowl or put them aside. The choice of actions and the way of sorting the coffee beans are almost spontaneous, without a moment of conscious thought. A similar pattern of putting important things or people in the middle can also be observed in other human activities. For example, the people standing or sitting in the middle of group photographs always have significant roles within the group: in pictures of a government's cabinet, the president or prime minister usually sits in the middle. In urban planning designs, the development of infrastructure usually extends from a centre point where important buildings and landmarks are located, and inner regions and outer regions are connected by ring roads, as can be seen in Paris, London, Beijing, and cities in the Middle East (Shaaban & Radwan, Reference Shaaban and Radwan2014). The tendency of putting good and important things in the centre and the tendency of choosing the things in the middle therefore match well with each other, assuming that we always want to choose the best. However, there is still no conclusive explanation as to why such tendencies (i.e., putting important things in the middle and picking things that are located in the middle) have developed.
Physical Distance and Attention
Compared to putting an item beside a person's body, putting an item right in front of a person creates the shortest distance between the item and the person, which possibly allows the person to have easy access to that particular item (Proctor & Van Zandt, Reference Proctor and Van Zandt2008). Locational convenience seems to explain why the centre item on a horizontal array is more likely to be picked than the other items shown on the same array. However, if the ease of access exclusively refers to the ease of reaching physically, one would expect an important item to be placed to one side, near the hands but not in the middle. In the design of the ergonomics of vehicles, a gear lever that requires responsive manual control is usually placed near the driver's hand. What is shown right in front of the driver is the speedometer, which demands the driver's attention (Kim, Dey, Lee, & Forlizzi, Reference Kim, Dey, Lee and Forlizzi2011). In other words, the centrality preference may not be highly related to the advantage of motor access; instead, it may be more about attention.
A visual image of the middle item is mostly projected onto the central region of the retina if a list of items is shown right in front of a person. Considering the distribution of cone and rod cells on the retina, images projected onto that area should be processed in great detail. Given that all the items are physically similar, the one located in the middle is always believed to receive a greater amount of attention than those located in the peripheral areas (Posner, Reference Posner1980). This uneven distribution of attentional focus among different items results in an ease in perceptually accessing the item in the middle, that is, perceptual fluency (Oppenheimer & Frank, Reference Oppenheimer and Frank2008). Similar to the heuristic of availability, ease of perceptual access can possibly bias the process of deciding which object should be chosen (Egly, Driver, & Rafal, Reference Egly, Driver and Rafal1994; Riegler & Riegler, Reference Riegler and Riegler2012). This bias becomes more significant when all of the shown items are highly similar (Reber, Winkielman, & Schwarz, Reference Reber, Winkielman and Schwarz1998). In other words, the uneven attentional distribution possibly explains why the centre item, which can easily be accessed perceptually, is more likely to be chosen than the items on the sides.
Attention and Memory
Given the positive relationship between attention and memory, recognition tasks or recall tests are among the common practices used to show how much an object is being attended to (Awh, Vogel, & Oh, Reference Awh, Vogel and Oh2006; Miyake & Shah, Reference Miyake, Shah, Miyake and Shah1999). In other words, if the centre item receives more attention than the neighbouring items, better memorisation of the centre item should also be expected. Shaw, Bergen, Brown, and Gallagher (Reference Shaw, Bergen, Brown and Gallagher2000) replicated Christenfeld's findings about centrality preference and further discovered that the participants in their study were more able, though not statistically significantly more able, to recall items in a poster that were located in the middle than items in posters located on the left and right sides. On the other hand, participants in other studies did not show better memorisation of a centre object compared to neighbouring ones (Raghubir & Valenzuela, Reference Raghubir and Valenzuela2006; Valenzuela & Raghubir, Reference Valenzuela and Raghubir2009). These less supportive findings cast doubt on the explanatory role of uneven attentional distribution and suggest that the amount of attention being received by items is independent of the chance of them being chosen in a preference test. Nevertheless, these inconsistent findings could also be interpreted as showing that memory tasks might not be a suitable tool for measuring attention level in this kind of preference test. This alternative interpretation does not mean that the relationship between attention and memory that has been consistently supported in different information processing activities should be rejected (Cowan, Reference Cowin1988); it only suggests that the memory tasks adopted in the studies on centrality preference might not be sensitive enough to assess the attention level. This study therefore adopted an eye-tracking technique to reveal whether, compared with neighbouring items, an item placed in the middle of an array receives the greatest amount of attention.
A Direct Measure: Eye Gazing
The locations and durations of eye fixation points provide measurable parameters in understanding how an object is visually perceived. The total looking time (i.e., total duration of the eye fixation points made within the area of interest) and the number of fixation points are generally regarded as indices of the amount of attention being shed on a particular object (Fehd & Seiffert, Reference Fehd and Seiffert2008; Li & Selker, Reference Li and Selker2001; Rayner, Reference Rayner2009; Strick, Holland, Baaren, & Knippenberg, Reference Strick, Holland, Baaren and Knippenberg2009). In one study, participants were found to spend a longer time looking when engaged in a more difficult task than when attempting a less complex task (Rayner, Reference Rayner2009). Similarly, in another study, participants were found to spend a longer time, as reflected by the longer duration of eye fixations, looking at novel objects that usually capture more attention (Strick et al., Reference Strick, Holland, Baaren and Knippenberg2009). Furthermore, memory performance has been found to be positively related to total looking time (i.e., duration of the eye fixation points within the corresponding regions; Loftus, Reference Loftus1972).
Present Study
A large amount of attention paid to a centre item leads to an ease of perceiving and accessing it that then increases the likelihood of this item being chosen from an array of similar objects. One possible drawback of this explanation is that it is not fully compatible with the prediction regarding memory performance. Two objectives were therefore built into this study: (1) to replicate the phenomenon of centrality preference; and (2) to examine the amount of attention being received by the centre object by using a recall test and an eye tracker. The findings obtained from the recall test and the eye tracker allowed us to produce a comprehensive evaluation of the attentional account in explaining centrality preference. This study hypothesised that objects shown in the middle of an array are (a) perceived longer and more often than neighbouring objects and (b) remembered better than other objects.
Methodology
Participants
Thirty undergraduate participants (23 females and 7 males) from Hong Kong Shue Yan University were recruited for this study. The age of the participants ranged from 18 to 22 years, with the mean age being 20.43 (SD = 1.96). None of the participants reported having a vision defect.
Stimuli
The stimuli usually adopted in past studies of the centrality preference were items that could be commonly encountered in daily life (e.g., a highlighter, toilet paper; Christenfeld, Reference Christenfeld1995; Shaw et al., Reference Shaw, Bergen, Brown and Gallagher2000). In this study, five types of items — pens, cups, chairs, rulers, and plates — were selected as the stimuli. In order to minimise the attentional bias, items within each type were of similar size and shape and were identical in colour (Bundesen, Reference Bundesen1990). Furthermore, the attractiveness of all the items was assessed by another 15 undergraduates (8 females and 7 males) using a 5-point rating scale. The mean score of all 25 items (5 items × 5 categories) was 2.27 (SD = 0.35). In each trial, the five items within the same type were shown on a horizontal array (see Figure 1). The areas of interest in this study were the areas within the outline of each of the five items. Due to the differences in shapes (e.g., on the screen, the width of a pen was close to 1 cm whereas the width of a plate was around 4 cm), the areas of interest among the five trials varied greatly. In general, any fixation points found within (or intercepting) the outline of the item were counted as valid eye fixation points for that particular item. For the same reason, the spacing between the items also varied; the average spacing was around 3.3 cm.
Figure 1 A sample of items being adopted in the study.
Procedure
Participants were invited to sit 60 cm in front of a 15” computer screen. They were required to put their head on a chin rest and to wear a headset, which was used to record their eye movements. To ensure the consistency of the tracking performance, the head was fixed on the chin rest and the headset was not taken off before the end of the experiment. Calibration and validation procedures using the EyeLink II system (SR Research) in binocular mode with a 9-point grid type were performed at the beginning of the experiment. Both procedures were automatically executed without intervention, and the interval between the calibration targets was 1,000 msec. The validation process continued until the calibration of both of the participant's eyes was graded as ‘GOOD’ (i.e., both pupils and corneal visible). Similarly, only participants whose performance was graded as ‘GOOD’ (i.e., errors are acceptable) in the validation process proceeded to the actual experiment. Performances in both the calibration and validation procedures were assessed and graded by the built-in software in the EyeLink II system. Considering the small number of experimental trials (N = 5) with a short viewing time (i.e., 5 sec) and the criteria in both the calibration and validation procedures, no drifting correction was performed during the experimental process.
At the beginning of the actual experiment, the sentence ‘Welcome to the Choice Preference Experiment!’ was shown to the participants for 2 seconds. After that, a fixation point (+) appeared in the middle of the screen. Participants could press the spacebar at any time to start the trials. In each trial, five items were shown on the screen for 5 seconds in a counterbalanced order so that each item had the same chance of being shown in any one of the five positions. Then, participants were required to choose their most preferred item by pressing the assigned buttons on a computer keyboard. A new trial started when a keystroke response was received. In the last trial, participants were shown a set of plates, each of which had a design showing a matchstick man holding a specific object (see Figure 1). The five different objects being held shared similar degrees of recognisability and had been checked by 15 undergraduates. Participants in this trial were first asked to choose the item they most preferred, as in the previous four trials. Then they were required, without prior notice, to recall what the matchstick man held on each of the plates. Similar to the past studies on centrality preference and memory performance (e.g., Raghubir & Valenzuela, Reference Raghubir and Valenzuela2006; Valenzuela & Raghubir, Reference Valenzuela and Raghubir2009), the participants only needed to recall the items in the last trial in order to minimise their chance of guessing the research rationale.
All keystroke responses and eye movement data were recorded by E-prime and EyeLink II respectively. If participants did not know how to write the names of the objects in the recall test, vocal responses were accepted.
Results
Choice of Preferred Items
The descriptive findings are shown in Tables 1, 2, 3, and 4. The participants showed salient preferences for the items placed at specific locations on the horizontal array, F(1.51, 43.65) = 7.66, p < .01. Post hoc tests with Bonferroni correction showed that items placed in the middle were more likely to be chosen than items in other locations (all p values were smaller than .05) except for items placed on the leftmost side of the array. Similarly, items placed on the leftmost side were more preferred than items in the other locations (all p values were smaller than .05). Apart from this, participants did not show a specific preference for the items placed in other locations.
Table 1 Probability of Each of the Items Being Chosen as ‘the Most Preferable’
Table 2 Mean Number of the Fixation Points Among the Five Items on a Row
Table 3 Mean Duration (msec) of the Fixation Points Among the Five Items on a Row
Table 4 Recall Percentage of the Objects Being Among the Five plates
Number and Duration of Fixation Points
On the basis of the current methodology, the eye fixation points collected at the very beginning of a trial might have been due to the centre fixation point (‘+’) that was shown at the beginning of each trial. Furthermore, before looking closely at each of the shown items, a short moment of time might also have been needed for the participants to be fully aware of the presence of all five items. Research on the sensory register has shown that it could take up to 250 msec for participants to be fully aware of a single item (Libet, Reference Libet2004). The time taken for the five items to be registered in the participants’ awareness was unknown in this study. To be conservative, the eye movement data collected in the first second of each trial, which were roughly equal to the total looking time of the first five fixation points, were discarded from the analysis. Undoubtedly, there is no strong theoretical support for this removal criterion. No reviewed studies have discussed the possible nature of the eye fixation points collected at the beginning of a trial. The present removal criterion is certainly a primitive proposition and needs to be further discussed and modified in future studies.
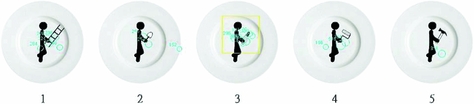
There was a significant difference in the number of fixation points collected among the five items presented on a row, F(2, 58.24) = 39.04, p < .001. Post hoc tests adopting Bonferroni correction showed that participants looked at the middle item significantly more often than the other items (all p values were smaller than .01; see also Figure 2 for an example from one of the participants). Furthermore, there were also significantly fewer eye fixation points collected on the items placed on the rightmost side compared to the other locations (all p values were smaller than .01).
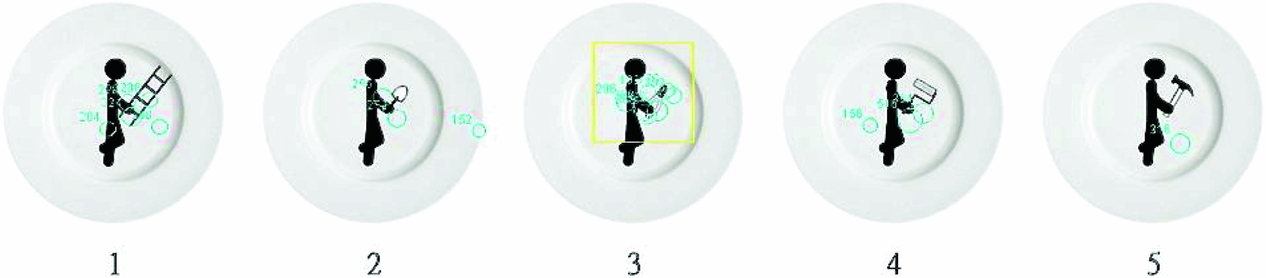
Figure 2 A sample showing all five plates with the circles representing the eye fixation points.
Similarly, the total looking times (i.e., the total duration of all fixation points made within the area of interest) of the five items placed at different locations were also significantly different, F(1.43, 41.52) = 8.476, p < .01. The findings in the post hoc tests with Bonferroni correction indicated that the participants spent a longer time looking when they gazed at the middle items compared to when they gazed at the other items (all p values were smaller than .05). On the other hand, there was no significant difference in terms of the looking time between the items on the leftmost side and other items placed in different locations (except compared to the centre items), given that the leftmost items had fewer eye fixation points.
Recall Test
In order to minimise the effect of guessing (Valenzuela & Raghubir, Reference Valenzuela and Raghubir2009), a recall test was only conducted in the last trial, that is, the plate set. Any correct recalling of the object being held by the matchstick man shown on the plate was coded as 1 whereas a recall failure was coded as 0. Results from the Cochran's Q test showed that there was no significant difference in remembering the objects being held among the five plates (χ² = 2.35, p = .672), though the plates shown in the middle (n = 9) and the leftmost side (n = 12) were still mostly preferred by the participants than the other plates (χ² = 13.0, p < .05).
Discussion
This study tried to examine the relationship between attention and centrality preference. It was found that the participants not only spent a longer time looking at the centre items but also preferred these items more than most of the other items. Given that looking time is positively related to the amount of attention received by an object, the long looking time suggests that the participants in this study attended more to the objects placed in the middle. Nevertheless, this additional attentional focus did not guarantee better memorisation. The current results showed that the image on the preferred plates was not remembered better than the images on the other plates.
Unexpectedly, it was found that items located in the leftmost position were also largely preferred by the participants, but the total looking time for these items was significantly shorter than that for the middle items. Hence, it is suggested that the preference for items on the leftmost side deserves another explanation other than the attentional account.
Latency and Preference
Centrality preference is commonly explained by the uneven distribution of attentional focus across items on a horizontal array. Yet, empirical findings, which usually come from performance in memory tests, do not give solid support to this account. The present study provides another piece of evidence showing that the participants spent a longer time looking at the centre item and were also more likely to choose this item than the neighbouring items, except for the items on the leftmost side. The longer looking time suggests an additional attentional focus being shed on the centre item, which leads to an easy access to that item. A feeling of ease of access could then serve as an implicit cue that affects the preference of participants, especially in a context where there is no strong preference for any particular object (Reber et al., Reference Reber, Winkielman and Schwarz1998). Findings in numerous priming studies support this assertion (e.g., Hermans, Baeyens, & Eelen, Reference Hermans, Baeyens and Eelen1998; Holcomb, Reference Holcomb1983; Livingston & Brewer, Reference Livingston and Brewer2002); for example, in one study, when the text was printed in low resolution, which meant that the access to the text was difficult, the participants felt that the text content was more complicated than when the same text was printed in high resolution (Yue, Castel, & Bjork, Reference Yue, Castel and Bjork2013). The mere exposure effect explains how people's preferences can be built by the number of exposures they have to a particular object, which enhances the fluency of accessing that object (Bornstein & D'Agostino, Reference Bornstein and D'Agostino1994). Although the present study did not administer any mere exposure procedure, a similar effect was triggered that influenced the choice of the participants (i.e., centrality preference).
Furthermore, the image of the preferred plate was not particularly remembered better than the patterns on other plates. This suggests that attentional focus and preference do not correlate with memorisation. This independence between attention and choice of preference is also compatible with some past studies (e.g., Pelet & Papadopoulou, Reference Pelet and Papadopoulou2012) on affection and memorisation. Yet, the present findings on memorisation are not completely conclusive. Only one trial examining the memorisation of the chosen item was conducted in the present study. Thus, the non-significant result in the recall test might have been due to the small number of trials. Further research on memorisation and choice preference is certainly needed in order to validate the proposition on memory and preference made in this study.
Preference for Leftmost Position
Besides the centrality preference, there was a large proportion of the participants (around one third) who preferred the items in the leftmost position. The participants did not spend a significantly longer time looking at these items and did not remember them better, compared with the items in the other locations. If looking time and memorisation are related to the amount of attentional focus, then the present findings suggest that the preference for items in the leftmost position is independent of participants’ attentional focus. Alternatively, the counting habit might provide an another explanation to the preference for leftmost position (Mantonakis, Rodero, Lesschaeve, & Hastie Reference Mantonakis, Rodero, Lesschaeve and Hastie2009). It was found that young children prefer the left-to-right sequence when counting numbers in an ascending order (De Hevia, Girelli, Addabbo, & Cassia, Reference De Hevia, Girelli, Addabbo and Cassia2014; Longo & Lourenco, Reference Longo and Lourenco2007). Also, in a parity test, small numbers (or large numbers) that were shown on the left- (or right-)hand side were reacted to faster than when they were shown on the opposite side, that is, the spatial-numerical association of response codes effect (Fias, Reference Fias2001; Fischer, Warlop, Hill, & Fias, Reference Fischer, Warlop, Hill and Fias2004).
Given that objects that are placed on a horizontal line are seen from left to right, it is possible that the first object being counted (i.e., object on the leftmost side) is also implicitly regarded as the best object. The number 1 can be understood as the first in a ranking order. It is usually associated with with success (e.g., first-class honours), importance (e.g., the number one football player), and prominence (e.g., the First Lady), which may increase the preference for the leftmost items correspondingly (MacFie et al., Reference MacFie, Bratchell, Greenhoff and Vallis1989). The underlying meaning of the number 1 is not associated with any attentional focus, but it possibly explains the strong preference for the leftmost object. In the present study, the participants may have been primed by this meaning and thus subsequently chose the number 1 items (i.e., the leftmost items). A possible future study could therefore recruit participants who write from right to left and see whether this leftmost preference still persists. Studies on mental number lines have shown that people writing Arabic, which is written from right to left, count numbers from right to left (Zebian, Reference Zebian2005). Similar findings were also obtained in the context of describing temporal relationships (Fuhrman & Boroditsky, Reference Fuhrman and Boroditsky2010): Hebrew speakers were found to arrange events in a temporal sequence from right to left, which was consistent with their writing direction. In other words, the right-to-left writing system may drive people to look at objects that are placed horizontally from right to left. People may then prefer the item in the rightmost position more as it is associated with the meaning of the first and the best. The findings of this future study may further echo the leftmost preference obtained in this study.
To conclude, the centrality preference shown in this study was explained by the span of the attentional focus, which was supported by the longer looking time and more eye fixation points for the centre item as compared to the looking time and eye fixation points for items in other locations. A non-significant difference in the recall test indicated that such preference does not necessarily relate to the memorisation process. On the other hand, an unexpectedly strong preference for the leftmost items can possibly be explained by the implicit association between the number 1 and the meaning of ‘the best’. This speculation could be further validated in a future study by recruiting participants who write from right to left.


 Open access