


1. Introduction
In this paper we report a study which fuses experimental evaluation findings with big data analysis to access and visualize language ideologies or, more particularly, the competition between language ideologies which is argued in a growing body of research (see Grondelaers & Kristiansen, Reference Grondelaers, Kristiansen, Kristiansen and Grondelaers2013; Pharao & Kristiansen, Reference Pharao, Kristiansen, Rosseel and Grondelaers2019; Grondelaers & van Gent, Reference Grondelaers, van Gent, Rosseel and Grondelaers2019) to account for the increasing frequency in European standard languages of non-standard variants (a process commonly known as “destandardization”).
Kristiansen (Reference Kristiansen2009) pioneered a “double standard” scenario with competing ideologies to account for the increasing popularity in Denmark of the publicly stigmatized but rapidly spreading Københavnsk accent of Danish. In a label-ranking task he first asked adolescent respondents to “order the labels of the following varieties in terms of [their] preference,” and found that this Københavnsk flavor was ranked lower than Rigsdansk in all Danish localities except Sealand (the easternmost island of Denmark on which Copenhagen is located); Rigsdansk is the official standard and only official prestige variety in Denmark. From this hierarchization, Kristiansen inferred that the label-ranking task had replicated the dominant conservative standard language ideology which drives public thinking and overt discourses about standard language in Denmark. But Kristiansen also ran a speaker evaluation experiment, in which he asked respondents to evaluate unlabelled speech clips on measures pertaining to speaker personality (is this speaker intelligent, cool, trustworthy,…?) in order to keep them ignorant of the linguistic purpose of the experiment. Crucially, in this speaker evaluation task, Københavnsk was significantly upgraded on measures such as self-assured, fascinating, and cool. These positive evaluations were argued to drive the vitality of Københavnsk in spite of its official rejection, but according to Kristiansen, they also revealed the working of a more hidden counter-ideology which hierarchizes varieties in terms of dynamism, an emergent type of modern prestige associated with media slickness and streetwise cool. A methodological assumption which is at least implicit in Kristiansen (Reference Kristiansen2009) is that access to the covert value system with its dynamic prestige reference points requires experimental techniques (such as speaker evaluation) which keep participants ignorant of the object to be evaluated.
In spite of the validity of this evidence, it is unclear how much of the dimensionality and conceptual detail of language ideologies the speaker evaluation methodology in Kristiansen (Reference Kristiansen2009) and a number of follow-up experiments on other languages (Hare Svenstrup, Reference Hare Svenstrup, Kristiansen and Grondelaers2013; O’Murchadha, Reference O’Murchadha, Kristiansen and Grondelaers2013; Grondelaers & Speelman, Reference Grondelaers, Speelman, Kristiansen and Grondelaers2013) can capture. It is difficult to determine, first, what there is to capture: we know comparatively little about the actual content of language ideologies. Linguistic value systems are slippery and elusive concepts which have engendered scholarly disagreement across, but also within disciplines such as anthropology and linguistics. Definitions range between the very broad delineation in Rumsey (Reference Rumsey1990:346)—“shared bodies of commonsense notions about languages in the world”—to the more specific and oft-cited characterization in Gal (Reference Gal2006:163): “those cultural presuppositions and metalinguistic notions that name, frame and evaluate linguistic practices, linking them to the political, moral and aesthetic positions of the speakers, and to the institutions that support those positions and practices.” More interesting for ideology-based accounts of language change are definitions which assume a correlation between value systems and language structure, such as Silversteinʼs (Reference Silverstein, Clyne, Hanks and Hofbauer1979) claim that language evaluations and rationalizations of language structure and use are factors which impact language variation and change.
Second, speaker evaluation experiments typically reduce investigated language ideologies to one-dimensional hierarchizations in terms of prestige proxies that can be experimentally measured. The conservative standard language ideology is elicited in the cited studies on researcher-defined scales pertaining (for the most part) to high intelligence, fine education, and professional competence, which are mapped post-hoc (with some statistical dimension reduction technique like factor analysis or principal component analysis) on a superiority dimension. The modern anti-ideology is extracted on researcher-defined items pertaining to assertiveness, cool, or trendiness, which are likewise reduced to one dynamism or modern prestige dimension in the Kristiansen-inspired speaker evaluation studies. A recurrent criticism on speaker evaluation in general is the choice of measuring scales, which purportedly lacks “empirical motivation and construct validity” (Lee, Reference Lee1971:413, but see Giles & Bourhis, Reference Giles and Bourhis1973 for a rebuttal), and the fact that researchers typically copy these scales from preceding studies, at the risk of “circularity (…) and a deceptive semblance of exhaustiveness” (Garrett, Reference Garrett, Ammon, Dittmar, Mattheier and Trudgill2005:1256). As a case in point, it should be noted that the just-mentioned follow-up studies inspired by Kristiansen (Reference Kristiansen2009) all rely on the latter for their dynamism scales. Yet, this is a hazardous procedure, since dynamism comes in so many shapes that it is unlikely that a single identical underlying counter-ideology is instantiated across communities. For their evaluation study of a Belgian colloquial variety dubbed “Tussentaal,” for instance, Grondelaers & Speelman (Reference Grondelaers, Speelman, Kristiansen and Grondelaers2013) did indeed borrow their dynamism scales from Kristiansen (Reference Kristiansen2009), but factor analysis returned a poor solution (explaining only 53.4% of the variability in the ratings after five of the 15 scales originally included had been removed), as a result of which the authors cautioned that they had “failed to find the appropriate adjectives to tap into the attitude dimensions” (p. 180). Grondelaers & Speelman (Reference Grondelaers, Speelman, Kristiansen and Grondelaers2013:183) argue that this failure may have been due to the fact that the counter-ideology or ideologies which are undoubtedly operative in the Flemish repertoire are entrenched in, or informed by other value systems such as the degree to which respondents self-identify as ‘Flemish’: speakers who regard themselves as Flemish and Flemish-speaking (rather than Dutch-speaking) may be more inclined to find Flemish lexis dynamically attractive (although they know it is not considered standard). If the latter should be the case, the presence in the scale-set of items which probe this Flemish identity value system may contribute to a more straightforward extraction of the dynamism dimension.
The point we are trying to make here is that including the optimum scale set in any speaker evaluation experiment requires some prior knowledge of the value systems which co-determine the conservative and modern language ideologies we are basically interested in; these are to some extent language- and culture-specific, and they require tailor-made measures. Since this prior knowledge is not always available, it is advisable to use a more exploratory bottom-up technique first, before turning to top-down speaker evaluation with researcher-defined measures.
The latter is all the more pivotal in the case of complex and controversial standard language dynamics which are as ill-understood as those in Flanders, the Dutch-speaking northern half of Belgium. In the 17th century, Flanders had been cut off from emergent standardization processes in The Netherlands (as a result of the Eighty Years’ War). The subsequent Spanish, Austrian, and French rulers in Flanders preferred French for supra-regional purposes (for more extensive historical accounts, see Vandenbussche, Reference Vandenbussche, Gilles, Scharloth and Ziegler2010; Absillis, Van Hoof & Jaspers, Reference Absillis, Jaspers, Van Hoof, Absillis, Jaspers and Van Hoof2012; and Delarue, Reference Delarue, Kristiansen and Grondelaers2013). At the beginning of the 20th century, the desire for a Flemish standard culminated in an attempt to adopt the by then fully developed Netherlandic Dutch standard, which was imposed on the Flemish in an unprecedented process of “hyperstandardization,” “a propagandistic, large-scale and highly mediatised linguistic standardisation campaign that has thoroughly ideologised and hierarchised language use in all corners of Flemish society” (Van Hoof & Jaspers, Reference Van Hoof and Jaspers2012:97). While this hyperstandardization materialized in a relatively homogeneous Belgian written standard (Geeraerts, Grondelaers & Speelman, Reference Geeraerts, Grondelaers and Speelman1999), it did not engender a widely used spoken standard variety. VRT-Dutch, the rigidly controlled variety produced by official broadcasters on the Vlaamse Radio en Televisie ‘Flemish Radio and Television’ is arduously promoted by the Flemish authorities (a. o. for educational purposes, see Delarue, Reference Delarue, Kristiansen and Grondelaers2013), and continues to be the uncontested prestige variety for all Flemings: all speaker evaluation experiments hitherto undertaken in Flanders confirm its outspoken superiority (see Grondelaers & Speelman, Reference Grondelaers, Speelman, Kristiansen and Grondelaers2013 for an overview). In production terms, however, VRT-Dutch increasingly represents an unattainable ideal which is used by a small, and steadily dwindling number of speakers, in an ever smaller number of contexts (see, amongst many others, Goossens, Reference Goossens2000:8; Geeraerts & De Sutter, Reference Geeraerts, De Sutter and Stroop2003:57; Beheydt, Reference Beheydt and Stroop2003:160; Plevoets Reference Plevoets2009).
Hyperstandardization may not have spawned a vital consensus standard for the Flemish, but it has certainly established a “collective meta-linguistic conscience” which has imbued Flemings with the “desired linguistic stratification” (Van Hoof & Jaspers, Reference Van Hoof and Jaspers2012:113), viz. the uncontested superiority of spoken VRT-Dutch. If this metalinguistic conscience does not engender a noticeable proficiency in VRT-Dutch (cf. supra), it certainly manifests itself in an outspoken hypersensitivity to spelling and grammar mistakes (a recent poll in the quality newspaper De Standaard and on the VRT has shown that 60% of all Flemings take offense to them, cf. De Vlaming is een taalchampetter ‘Flemings are language coppers’, De Standaard, 14/10/2016), and an abhorrence of language variants which supposedly harm the alleged perfection of VRT-Dutch. A practical consequence of the latter is the public rejection of the majority of vital Flemish varieties. The brunt of this ideological disapproval is for a non-standard variety, or rather a cluster of varieties called ‘Tussentaal’ (lit. ‘in-between’ language) on account of their stratificational position in-between the Flemish dialects and the VRT-standard. Tussentaal is easy to recognize for the layman, but difficult to delineate for the professional describer on account of its heterogeneity: it is characterized by phonetic, lexical and morpho-syntactic non-standard features, but these features need not always co-occur, and not all variables are always realized with the Tussentaal-variant (see Grondelaers & Van Hout, Reference Grondelaers and van Hout2016, especially the discussion pertaining to (1)-(6) on p. 65). Still, the non-standard features which delineate Tussentaal seem to have in common that they almost never index very specific locations: Tussentaal is characterized by properties which have a low symbolic value as “carriers” of linguistic identity, as a result of which they can index supra-regional identity (Rys & Taeldeman, Reference Rys, Taeldeman, Sandra, Rymenans, Cuvelier and Van Petegem2007; Grondelaers & Van Hout, Reference Grondelaers and van Hout2011:222; Ghyselen, Reference Ghyselen2016).
Be that as it may, Tussentaal is rapidly expanding, and it elicits extreme controversy and disapproval among both linguistic laymen and language professionals (see Grondelaers & Van Hout, Reference Grondelaers and van Hout2011; Delarue, Reference Delarue, Kristiansen and Grondelaers2013; and Lybaert, Reference Lybaert2017). The main reason for this is that Tussentaal appears to be encroaching on domains in which more formal varieties of Belgian Dutch used to be the evident option (De Caluwe, Reference De Caluwe2009; Grondelaers & Van Hout, Reference Grondelaers and van Hout2011), and that it is embraced by demographic groups which were considered to be the traditional diffusers of standard speech: while the cultural elite in Flanders held on to some form of the standard much longer than the economic elite, the youngest generation in any professional group is increasingly switching to Tussentaal (Plevoets, Reference Plevoets2009).
There is a paradox inherent in the previous paragraphs that can be summarized in the somewhat indiscriminate, but not completely ill-founded generalization that the Flemish love a variety they do not speak (VRT-Dutch), whereas they increasingly use a variety they do not love (Tussentaal). This paradox is arguably reminiscent of the Danish standard language configuration (with its highly esteemed but non-vital Rigsdansk standard and the latterʼs stigmatized but vital Københavnsk competitor). The double-standard account proposed in Kristiansen (Reference Kristiansen2009), however, does not work well for Belgian Dutch: the available data only partially corroborate the “overt positivity for the standard, and overt negativity but covert positivity for the non-standard”-scenario.
Observe to begin with that the available evidence for dynamic prestige motivations for Tussentaal is partly based on lucky shots. In their study of standard, colloquial, and dialectal varieties of Belgian Dutch, Impe & Speelman (Reference Impe and Speelman2007) observed some dynamic evaluations of Tussentaal, albeit on scales originally included in function of the dimension “solidarity” (notably the fact that the Tussentaal guise was deemed more “entertaining”). And recall that Grondelaers & Speelmanʼs (Reference Grondelaers, Speelman, Kristiansen and Grondelaers2013) study of Tussentaal returned some dynamism evaluations for Flemish lexis, but a poor factor solution made the authors doubt whether their experimental measures had tapped into the relevant evaluation dimensions. The best experimental evidence to date for dynamic evaluations of Tussentaal comes from Rosseel (Reference Rosseel2017), who studied the division of labor between Standard Dutch and Tussentaal on the basis of explicit evaluations (featuring participants who were fully aware of the task they were performing), and implicit, automatic evaluations extracted with a more sophisticated Relational Responding Task. Contrary to Kristiansenʼs (Reference Kristiansen2009) assumption that dynamic prestige can only be elicited from participants who are unaware of the fact that they are returning linguistic evaluations, Rosseel found that it was her explicit, but not her implicit evaluations which revealed dynamism associations for Tussentaal. The idea that dynamism evaluations can also be harvested from participants who are consciously evaluating linguistic variation is confirmed in Lybaert (Reference Lybaert2017), who found her highly educated interviewees consciously returning some of the dynamic prestige evaluations which purportedly require more sophisticated indirect experimental techniques to extract. In summary: we have no reliable idea of the “brand” of dynamism which correlates with Tussentaal, and we do not know at what level of consciousness dynamic prestige evaluations are processed in Flanders.
In addition, the ideological supremacy of VRT-Dutch is not univocally confirmed either. While experimental research on Belgian Dutch unanimously upholds the supremacy of the standard, there are also dissenting voices. In her ethnographic analysis of language practices and ideologies in a secondary school, for instance, Van Lancker (Reference Van Lancker2016) found a powerful, but largely subconsciously operating conservative ideology (which transpired from an unexpected appreciation of “beautiful Dutch” and a tendency among the students to downgrade their own speech as “extremely unsophisticated”, Reference Van Lancker2016:191) alongside explicit anti-norm attitudes. It is unclear whether these contradictory findings represent the outcome of different measurements with different parameter settings, or whether they instantiate the ideological change we focus on in this paper.
There are two additional problems inherent in speaker evaluation–based studies of Belgian standard language dynamics. The first is the choice of speech stimuli to represent Tussentaal. Vandekerckhove and Cuvelier (Reference Vandekerckhove, Cuvelier, Cuvelier, Du Plessis, Meeuwis and Teck2007) regarded most of the findings of their speaker evaluation study as inconclusive on account of the fact that “Tussentaal proves to be very hard to operationalise as it may cover virtually the entire continuum between dialect and standard language. The question which part of the continuum one selects as a target is a very tricky one” (Vandekerckhove & Cuvelier, Reference Vandekerckhove, Cuvelier, Cuvelier, Du Plessis, Meeuwis and Teck2007:253). While this problem can be circumvented by including more than one sample of Tussentaal, it lays bare another disadvantage of speaker evaluation, viz. the fact that a technique which relies on (unpaid) respondents with obvious attentional limitations precludes exhaustive inclusion of all the varieties in a language repertoire. For this reason, speaker evaluation studies typically include varieties which are known beforehand, or which are highly plausible to elicit specific evaluations. Due to this limitation, new or emergent prestige varieties may stay under the radar.
In sum, the use of speaker evaluation comes with the presupposition that we have an accurate idea of what the plausible prestige candidates and the relevant prestige sources in the community under investigation are, but this is simply not the case (yet) in Flanders. As a result, we need a preliminary exploratory step with an experimental tool that does not rely on a closed set of standard scales, and that does not restrain the gamut of investigated varieties.
In what follows we use the free response paradigm to study standard language ideology (change) in Flanders. Like Kristiansenʼs label-ranking task, the free response design (FR) is a direct experimental technique which does not conceal the researchers’ linguistic purpose from the respondents: it elicits evaluations of language variety labels returned in the form of the first three adjectives which come to the participantʼs mind in response to a specific label. We propose that these returns represent “ideological atoms” in the sense that they are the smallest indicators of the stereotyped beliefs and evaluations which constitute our linguistic value systems. Stereotypes represent a key component of our knowledge about accents and the groups they index. A stereotype is “a conventional (frequently malicious) idea (which may be wildly inaccurate) of what X looks like or acts like or is” (Putnam, Reference Putnam and Gunderson1975:169). Stereotypes store shared knowledge that helps people interpret, explain, and predict the social world, providing “patterns of expectations that help individuals function in complex social situations” (Stangor & Schaller, Reference Stangor, Schaller, Neil Macrae, Stangor and Hewstone1996; Doeleman, Reference Doeleman1998:20; Grondelaers & Van Hout, Reference Grondelaers and van Hout2010:235).
In prior work on Netherlandic Dutch (Grondelaers & Van Hout, Reference Grondelaers and van Hout2010), the FR-technique returned the attributes stereotypically associated with the socio-regional groups delimited by a number of accent varieties, including the prestige variety “Dutch with a Holland accent,” as well as “Dutch with a Groningen accent” and “Dutch with a Limburg accent”—both peripheral regions with a low speaker and speech prestige—and “Dutch with a Moroccan accent.” In Grondelaers & Speelman (Reference Grondelaers, Speelman, Daems, Zenner, Heylen, Speelman and Cuyckens2015), which elicited responses to the same accent labels and to two highly mediatized morpho-syntactic variants, a computational big data technique (distributional analysis) was used to automatically detect (near-)synonymy between the adjectives returned, in order to cluster them in evaluative dimensions. The perceptual relevance of these evaluative dimensions for the variety and variant labels was subsequently determined with correspondence analysis. A methodological drawback of this unsupervised clustering method was the fact that it did not always generate sets of fully synonymous adjectives: clusters occasionally contained antonyms, which were picked up by the computational tool because they occur in identical usage contexts. Still, the more aggregate perceptual picture which emanated from these enriched data (which we will henceforward call “enriched free response data,” or “EFR-data”) turned out to be much more informative than speaker evaluation research on the same variants and varieties. Crucially, aggregate perceptions and evaluations proved to be remarkably stable over two age groups and over four time points.
In the remainder of this paper, we report the results of a new EFR-study with Flemish stimuli and a computational synonymy tracker enriched with valence information to distinguish between positive and negative clusters. The following research questions are addressed:
-
Research question 1. Does the FR-technique in its basic, unenriched format return the stereotyped beliefs and evaluations pertaining to two supranational varieties of Belgian Dutch—VRT-Dutch and Tussentaal—and five accent varieties, Belgian Dutch with a Limburg, Antwerp, Ghent, West-Flemish, and Moroccan accent? Does the extreme ideologization of the linguistic meta-discourse in Flanders inspire attributes which are ideologically determined?
-
Research question 2. Does enrichment (in the form of added valence and computational aggregation) help us get access to the architecture and conceptual content of Flemish language ideologies? This question is broken down into the testable component questions 2a. and 2b.:
-
2a. How many ideologies does the EFR-technique reveal for Belgian Dutch? Does it only have access to the most conservative ideology (represented as a dichotomous juxtaposition of VRT-Dutch and all the other varieties), or does it also return the allegedly covert anti-ideology which frames modern, dynamic prestige?
-
2b. If the EFR-tool unveils both the conservative and more progressive value systems, what does it tell us about the nature of the dynamism evaluations believed to drive some non-standard usage in Flanders?
-
-
Research question 3. Does our EFR-analysis of the evaluations by older and younger respondents reveal ideological change, and—if yes—does it help us understand the nature and the dimensionality of the change?
In the next section, we elucidate our experimental procedure, data pre-processing principles, and valence attribution. Section 3 features qualitative analysis and simple statistics to gauge the quality of the data and to compute accent concept strength, while section 4 introduces the distributional big data perspective.
2. Method
2.1 Free response experiment
Respondents. A stratified sample of 211 native speakers of Belgian Dutch participated in the experiment. There were 91 male and 119 female participants, and 1 participant who declined to self-identify as either male or female (via the option “other”). Participants were sampled in two age categories: young (n=132, ranging between 18 and 30, average age 23.1) vs. old (n=79, ranging between 50 and 64, average age 55.4); 40 participants came from the province of Limburg, 28 from the province of Flemish Brabant, 34 from the province of Antwerp, 60 from the province of East-Flanders, and 46 from the province of West-Flanders. All participants were highly educated: young participants were studying, or had studied at universities or university colleges, older participants had earned a degree in some type of post-secondary education. In order to limit the participant sample to educated but linguistically untrained respondents, we specifically excluded linguists, translators, journalists, speech therapists, and teachers, as well as students training in any of these vocations.
Participants were recruited in various ways. The first and third author distributed the link to the experiment via their social networks (though contacts familiar with our work were emphatically excluded), but we also targeted participants via other sources, such as the first authorʼs music journalism contacts, some of whom posted the invitation to participate on their festival web sites. In the final stage of participant recruitment, an MA student of the third author visited companies in the Antwerp and Brabant areas to ask staff members to participate (in order to satisfy minimal cell frequencies, viz. n = 5 for each gender and age in each of the five regions). In the resulting dataset, there is some overrepresentation of East-Flemish participants (cf. supra), and some underrepresentation of older (13 < 33) and male participants (16 < 30) in West-Flanders. While this slight regional bias does not concern us—as we are not primarily interested in the regional origin of the participants, a variable which was included for the sake of representativeness, and which exerts little influence in any case (see below) —the participant gender and age variables can be safely studied on the basis of this dataset. The gender variable is fairly equally distributed across the regions (apart from the just-noted unevenness in West-Flanders), and the frequency imbalance on the age variable is more or less stable across regions (except, again, in West-Flanders).
Task and procedure. The experiment was digitally administered in a LimeSurvey environment. After having started the experiment, respondents were first given a number of questions pertaining to their demographic characteristics (age, gender, province of residence, education, and mother tongue) in order to determine their suitability for the experiment (unsuitable participants were automatically excluded).
Suitable participants were given the following instruction (translated from the Dutch original):
“In this investigation we ask you to return, as quickly as possible, the three adjectives which come to mind in reaction to varieties of Belgian Dutch. To give an example: in reaction to the label ‘Dutch with a Brussels accent’, another participant in a similar experiment returned the adjectives grootstedelijk ‘urban’, francofoon ‘francophone’, and bekakt ‘posh’. Please be as honest as possible! You can do nothing wrong: there are no (politically) incorrect choices, and the experiment is completely anonymous. You will be asked to evaluate eight varieties of Dutch. The first of these is an example.”
The survey software presented each new label on a separate page which repeated the instruction (in a somewhat shortened form), and which was complemented with a digital timer ticking down from the 50 seconds the participants were given to provide the three adjectives for each label; this was done to encourage some haste and obtain spontaneous, not overly premeditated responses.
Varieties and labels. In order to acquaint respondents with the technique and in view of the historical relevance of Netherlandic Dutch for the standardization of Belgian Dutch, we first elicited evaluations of “Hollands,” the best-known proxy for the Randstad accent, which is widely regarded as the standard accent of Netherlandic Dutch; we retained responses to ‘Hollands’ in all further analyses. We then extracted evaluations of seven varieties of Belgian Dutch. We included four regional accent varieties: “Dutch with an Antwerp accent,” “Dutch with a Limburg accent,” “Dutch with a West-Flemish accent,” and “Dutch with a Ghent accent.” For the first three of these labels, we used the name of Flemish provinces associated with a recognizable accent and the concomitant stereotypes (the boundaries of dialect areas in Flanders more or less coincide with the boundaries between provinces, Van Keymeulen, Reference Van Keymeulen and De Sutter2017).Footnote 1 In the latter case, we used the name of the East-Flemish provincial capital Ghent: East-Flanders is known to be a transitional area associated with great accent and dialect diversity (see Van Hout, De Schutter, De Crom, Huinck, Kloots & Van De Velde, Reference Van Hout, De Schutter, De Crom, Huinck, Kloots, Van De Velde, Huls and Weltens1999 and Taeldeman, Reference Taeldeman2005), whereas its capital Ghent is regarded as a “linguistic island” and has an easily recognizable accent (Taeldeman, Reference Taeldeman2005:13).
In addition, we included the label “Dutch with a Moroccan accent,” as well as the labels for two supra-regional varieties. “Dutch as spoken on VRT news broadcasts” unambiguously denotes the formal standard variety of Belgian Dutch sustained by the most conservative standard language ideology (of which the Vlaamse Radio & Televisie used to be, and continues to be the main propagator). The label “Dutch as spoken in soap operas such as Thuis or Familie” was coined to extract evaluations of Tussentaal, a label we did not use because it is a technical term with little lay relevance (cf. Lybaert, Reference Lybaert2012). Thuis ‘Home’ (broadcasted by the VRT) and Familie ‘Family’ (broadcasted by the largest commercial station VTM) are Flanders’ most popular soap operas, and especially the former is a well-known and much-contested icon of Tussentaal usage (Geeraerts, Penne & Vanswegenoven, Reference Geeraerts, Penne, Vanswegenoven, Gillis, Nuyts and Taeldeman2000); Geeraerts (Reference Geeraerts2001) even coined the term “Soapvlaams” (soap opera Flemish) as a label for Tussentaal.
The seven critical labels were randomized by the survey software to present each participant with a different ordering (in order to avoid context effects).
Data pre-processing. Preceding all analyses, the elicited adjectives were standardized in terms of orthography (spelling mistakes were corrected and non-standard forms such as makkelijk ‘easy’ were substituted for their standard equivalent gemakkelijk ‘easy’) and capitalization (we removed all initial capitals). In addition, adjectives were extracted from nouns if such was possible via a straightforward morphological operation (for the noun bourgeoisie, for instance, we substituted the adjective bourgeois). And whenever possible without a change of meaning, we transformed the sequence “niet ‘not’ + adjective” in the equivalent composite form with the prefixed negator on-: in this respect niet herkenbaar ‘not recognizable’ was changed into onherkenbaar ‘unrecognizable’.
These operations resulted in a final set of 4,242 tokens for 1,013 single response types. Of these, 593 types were hapaxes (i.e., responses which were returned only once).
2.2 Valence
In order to determine whether, and to what extent, the responses elicited in this experiment represent positive or negative qualifications, we build on the experimentally validated affective word norms in Moors, De Houwer, Hermans, Wanmaker, Van Schie, Van Harmelen, De Schryver, De Winne & Brysbaert (Reference Moors, De Houwer, Hermans, Wanmaker, van Schie, Van Harmelen, De Schryver, De Winne and Brysbaert2013) and Warriner, Kuperman & Brysbaert (Reference Warriner, Kuperman and Brysbaert2013), who asked native speakers to judge the extent to which respectively 4,300 Dutch words and 13,915 English words “referred to something that is positive/pleasant (“positief/aangenaam”) or negative/unpleasant (“negatief/onaangenaam”)” (Moors et al., Reference Moors, De Houwer, Hermans, Wanmaker, van Schie, Van Harmelen, De Schryver, De Winne and Brysbaert2013:72); evaluations of the Dutch words were elicited on a 7-point scale, evaluations of the English words on a 9-point scale. A crucial characteristic of these studies (and comparable studies into Spanish, Portuguese and Finnish) is that the extracted valences were observed to generalize very well across languages, as testified by the high correlation (.847) between the Dutch and the English ratings (Warriner et al., Reference Warriner, Kuperman and Brysbaert2013:1198).
Out of the 1,013 responses obtained in the free response experiment, 301 fully matched with lemmas for which valences were available in Moors et al. (Reference Moors, De Houwer, Hermans, Wanmaker, van Schie, Van Harmelen, De Schryver, De Winne and Brysbaert2013), and 57 were morphologically related to a lemma with the same stem and a similar valence in Moors et al. (Reference Moors, De Houwer, Hermans, Wanmaker, van Schie, Van Harmelen, De Schryver, De Winne and Brysbaert2013); a case in point was the response irritant ‘irritated’ which is plausibly related to both geïrriteerd ‘irritated’ (valence = 2.32) and irritatie ‘irritation’ (2.29). For 17 responses, Moors et al. (Reference Moors, De Houwer, Hermans, Wanmaker, van Schie, Van Harmelen, De Schryver, De Winne and Brysbaert2013) contained a valence for the morphologically related antonym. A case in point was the response onbeschaafd ‘uncivilized’, which does not occur in Moors et al. (Reference Moors, De Houwer, Hermans, Wanmaker, van Schie, Van Harmelen, De Schryver, De Winne and Brysbaert2013), although the opposite beschaafd ‘civilized’ does. The valence for onbeschaafd was subsequently obtained by “mirroring” the value for beschaafd, viz. 7–0.58=6.42. In order to include valences for as many extracted responses as possible, and in view of the high correlation between the Dutch and the English ratings, we included the valences for 292 English words in Warriner et al. (Reference Warriner, Kuperman and Brysbaert2013) which were straightforward translations of our experimental responses (such as ‘fantastic’ for the Dutch adjective fantastisch).
All in all, we obtained valences for 667 out of the 1,013 responses (65.84%). For the 420 non-hapaxes (viz. responses which were returned more than once), we obtained 350 valences (83.3%). All valences were transformed into scores on a scale from -1 to +1.
3. Simple statistics and qualitative analysis
Although the 50 seconds respondents were given to provide the three responses to each label seem like a sufficient amount of time, analysis of the missing data suggests some production pressure: a total of 14.1% of the responses is missing, but from adjective 1 to 3 there is a steady increase in the proportion of blanks: from 11% on the first, to 13.5% on the second, up to 17.9% on the third adjective. While neither the age (old 14.4%; young 13.8%) and gender categories (male 14.3%; female 13.8%) nor the five respondent regions (between 13 and 14.9%) diverged in the proportion of blanks they returned, some variety labels turned out noticeably harder to qualify: the 18.3% missing responses for “Dutch with a Moroccan accent” could be the effect of political correctness (viz. racial prudence) among the respondents, while the 23.7% of missing responses for “Dutch as spoken in Thuis and Familie” suggests that these television series may not be the best proxy for Tussentaal (but see below).
Table 1 lists, for each of the investigated labels, the ten most frequent responses, their absolute frequency, their unicity-score per label (computed as the ratio between the frequency of the term for that specific label and its global frequency), and their valence (ranging from –1 ‘very negative’ to +1 ‘very positive’):
Table 1. Frequency, unicity, and valence of top 10 adjectives by variety label

Even a cursory glance at the data in Table 1 reveals that the responses elicited for each label do not represent an unstructured bag of words: they denote the attributes stereotypically associated with an accent or with the social group delimited by an accent. The well-known Antwerp arrogance is instantiated in high frequencies for arrogant (rank 2), bekakt ‘high-nosed’ (rank 4), dikkenekkerig ‘puffed-up/pompous’ (rank 5), and hautain ‘haughty’ (rank 7). Crucially, these adjectives plausibly pertain to the city of Antwerp, which carries the same name as the province of which it is the capital. There is a common belief among Flemings that inhabitants of the Antwerp capital regard themselves as superior to other Flemings (a belief which is fittingly embodied in the adage that Antwerpen is ‘t stad en de rest is parking, ‘Antwerp is the (city) centre and the rest of Flanders is parking space’). The widely held impression that West-Flanders is unsophisticated transpires from the responses boers and boertig ‘boorish’ (ranks 3 and 4) (see Lybaert, Reference Lybaert2014 and Van Lancker, Reference Van Lancker2017 for evidence that the West-Flemish dialects are equally regarded as boers and boertig). The alleged Limburg sluggishness of behavior and speech is returned on traag ‘slow’ (rank 1) and zagerig ‘whiny’ (rank 10), while zangerig ‘sing-song’ reflects the reputed intonational dynamics of Limburg speech (rank 2) (in Lybaert, Reference Lybaert2014 more than half of the respondents returned traag en zangerig in response to a recorded clip of Limburg-accented Tussentaal). The stereotyped foreignness and low prestige of the Moroccan flavor emerge in nearly all the top ten responses (except maybe grappig ‘funny’, which is probably meant to denote ‘fun-inspiring’ and ‘ridiculous’, rather than ‘fun-loving’ in this context).
An outcome we had only partly anticipated is the globally positive evaluation of “Dutch with a Ghent accent,” and the high ranking in its perceptual profile of what can be interpreted as modern prestige-evaluations: grappig ‘funny’ (rank 1), leuk ‘nice’ (rank 3), wijs ‘wise, but more appropriately translated as ‘cool’ in a Ghent context’ (rank 6), aangenaam ‘pleasant’ (rank 8), and sappig ‘(metaphorically) juicy’ (rank 10). These may be due to the fact that Ghent is currently developing into the spearhead of modern cool in Flanders. There are many palpable correlates of this new role, but the most significant is probably the fact that the majority of exciting new rock acts in Flanders hail from Ghent (Balthazar, Bazart, and Oscar and the Wolf being the most obvious cases in point). But the recently deceased singer Luc Devos and the versatile actress Barbara Sarafian are equally illustrious icons of Ghent cool, as is the Ghent city dialect, which is not deemed local but urban. In addition, Ghent is increasingly recognized as the most vibrant town in Belgium: in this capacity it features prominently on all sorts of travel lists and blogspots,Footnote 2 and it is deemed ‘de leukste stad van België’ (the nicest town in Belgium).Footnote 3 As part of its Taalweek ‘language week’, the Flemish quality newspaper De Standaard recently featured an online survey with questions about Flemish dialect use and attitudes towards the dialects. Interestingly, the Antwerp dialect was evaluated as the ugliest dialect (21% of the votes), while the Ghent dialect was upgraded as the second-most beautiful (15%, following the judges’ own dialect; De Standaard, 27/10/2017:20-21).
Crucially, the unexpected acclaim for the Ghent accent, and the downgrading of the Antwerp accent do not seem to be an artifact of the overrepresentation of East-Flemish, or the underrepresentation of Antwerp respondents in the sample. In fact, the number of participants who come from the cities of Antwerp or Ghent—the level on which urban antagonism will be most acute—is almost identical (9 and 10, respectively). In order to check the possible effect of ill-will, we ran an ANOVA on the valences of the adjectives returned by residents of Ghent and Antwerp “city”. We found a main effect of Label (F(7,321) = 8.83; p < .0001), but no main effect of City (F(1,321) = .26; p < 1); neither was there an interaction between City * Label (F(7,321) = 1.19; p < 1).
The high frequencies in the responses to the label VRT-Dutch of qualifications like mooi ‘beautiful’ (rank 1), correct (rank 2), beschaafd ‘civilized’ (rank 5), goed ‘good’ (rank 7), deftig ‘distinguished’ (rank 8), and net ‘neat’ (rank 9) reflect the aesthetic, structural, and moral superiority attributed to the standard variety by a (very) conservative standard ideology (again, the qualifications returned closely resemble the way Standard Dutch was described by the respondents in the qualitative studies reported in Lybaert, Reference Lybaert2014, Reference Lybaert2017). In view of the hyperstandardization and extreme ideologization of Belgian Standard Dutch, it is unsurprising that the responses for VRT-Dutch reflect that varietyʼs alleged superiority.
It is difficult to infer from the responses elicited in function of the label “Dutch as spoken in the series Thuis and Family” whether they pertain to the Tussentaal usage these series are iconic for, or to the format themselves. While some of the low prestige returns seem to point to the former option—notably Antwerps (rank 3), volks ‘plebeian’ (rank 5), dialectisch ‘dialectal’ (rank 7), and plat ‘broad, unsophisticated, dialectal’ (rank 8, see below)—the adjectives gemaakt ‘artificial’ (rank 4) and gespeeld ‘acted’ (rank 9) force us to be cautious, because they are not typical Tussentaal-attributes. In contrast to Impe & Speelmanʼs (Reference Impe and Speelman2007) and Grondelaers & Speelmanʼs (Reference Grondelaers, Speelman, Kristiansen and Grondelaers2013) speaker evaluation experiments, the present investigation does not seem to return any high frequency dynamism attributes for Tussentaal.
It should further be noted that the low prestige attributes for all the labels, but especially for Tussentaal, are also ideologically determined: they represent the downgrading inherent in the exclusive upgrading of VRT-Dutch as the only “good” variety. While it is logical that the only supra-regional competitor to VRT-Dutch should receive the brunt of the ideological disapproval, a tell-tale reflection of the ideological rejection of the regional varieties is the high frequency of the adjective plat ‘broad’ in their characterization in Table 1: it occupies rank 1 for Dutch with an Antwerp accent (n=42), rank 4 for Dutch with a Ghent accent (n=17), rank 5 for Dutch with a West-Flemish accent (n=18), and rank 8 for Dutch as spoken in the series Thuis and Familie (n=10). As discussed in Lybaert (Reference Lybaert2017:108), plat is often used as a synonym for ‘dialectal’ in Flanders. In view of the fact that the conscious and unconscious repression of the dialects was a prime ingredient of hyperstandardization in Flanders, and in light of the observation that the dialects are increasingly losing ground to supra-regional varieties such as Standard Dutch and Tussentaal (Ghyselen, Reference Ghyselen2016), the predominance of plat in the perceptual profiles of the regional varieties is in all likelihood an ideological reflex.
The data in Table 1 also enable us to assess the strength of the mental representations of the varieties associated with the labels. If the keywords returned represent respondents’ conceptual representations of the varieties in the Belgian repertoire, we can define as the strongest possible concept the configuration whereby a variety is qualified with one term on which all the participants agree, and which is unique to that concept. The closest approximation of this configuration is the response profile for “Dutch with a Limburg accent,” which is headed by two highly dominant terms, viz. traag ‘slow’ and zangerig ‘sing-song’, which together represent 30.03% of all the response tokens used to qualify that variety. The unicity-scores of these terms, 0.94 and 0.81, reflect that they are used almost exclusively to denote the Limburg variety.
In Table 2 we have included two global measures to extract the strength of Flemish speech variety concepts. The token/type ratios, a straightforward way to compute our participants’ degree of lexical consensus when qualifying speech varieties, confirm that it is not only the Limburg accent (3.17), but also VRT-Dutch (3.14) which commands a relatively higher lexical uniformity, reflecting a higher preference for the same terms and, thus, a larger evaluative consensus among the participants. The weighted unicity measure is a more sophisticated computation to quantify the prediction that concepts are stronger when they are qualified with proportionally more high frequency terms which are more unique; it is operationalized as the sum of the product of each termʼs unicity score and relative frequency. Again, it is Dutch with a Limburg accent (0.58) and VRT-Dutch (0.61) which turn out to be the stronger concepts on this measure. Recall that the high weighted unicity score for the Limburg accent variety was determined for the most part by the statistical dominance of two nearly unique terms. In the case of VRT-Dutch, the ideological qualifications just mentioned are not only highly frequent, but also typically restricted to this propagated standard variety.
Table 2. Token/type ratio and weighted unicity by variety label

Since stereotypes are stubborn, and since standard language ideology in Flanders has turned out to be tenacious and persistent, we assume that the investigated variety concepts are stable across demographic groups and over time, and that it is especially the strongest concept—VRT-Dutch—which is the more invariant. These expectations, however, are not borne out by the data. Table 3 diagrams average valences per participant group as determined by gender and age. We did not stratify respondents on the basis of their regional origin because the impact of the province they come from on their evaluations was negligible. An ANOVA on Valence with Label (8) and Respondent Province (5) returned a main effect of Label (F(7,3537) = 51.87; 7 Df; p < .0001), but not of Respondent Province (F(4,3537) = 0.829; 4 Df; p < 1). There was a significant interaction between Label * Respondent Province (F (28,3537) = 1.755; 28 Df; p < .01), but planned comparisons show that this is due to the fact that the Antwerp and the Brabant respondents have a significantly better opinion of the Antwerp accent than the West-Flemish do (resp. MD = .298; SE = .065; p < .0001 and MD = .191; SE = 0.67; p < .05).
Table 3. Valence per variety by participant group

Respondent gender and age stratify the valences in Table 3 much more significantly. We ran a mixed-effects linear regression model with Valence as response variable, with Label (8), Participant Group (the four combinations of Gender and Age) and their interaction as fixed effects, and with a random intercept for Participant ID. A type II ANOVA on the fixed effects revealed a significant effect of Label (χ2 = 414.42; 7 Df; p < .0001) as well as, more importantly, a significant interaction between Label and Participant Group (χ2 = 36.99; 21 Df; p < .05). In order to pinpoint the nature of this interaction, we computed post-hoc Tukey comparisons of all 28 possible stimulus pairs within each participant group. These demonstrated that it is especially the young respondents who value the Ghent accent (as revealed on the comparison with the Limburg and Holland accents, which only young participants value significantly less than the Ghent accent, and on the comparison with the Antwerp accent, which all respondents value less, but the young much more so). Young females are significantly more negative than the other groups on the Antwerp accent (as transpires from the comparison with the Limburg, West-Flemish, Holland accents and Tussentaal, which only young females significantly prefer to the Antwerp accent; both young groups prefer the Ghent to the Antwerp accent, and all groups converge on an equal dislike of the Antwerp and the Moroccan accents). The fact that young males are the ideological renegades in our data is most obvious from the fact that they are the only group which does not rate VRT-Dutch higher than Tussentaal (estimate = .1489; p = < .1).
The data in the present section have confirmed that the answer to research question 1 is affirmative: even in its unenriched guise, the free response technique returns familiar beliefs and evaluations pertaining to the investigated varieties, and the extreme ideologization of the standard language situation in Flanders clearly inspires attributes which are ideologically determined. In the next section we extract evaluative clusters from the experimental responses to qualify variation and change in Flemish language ideologies in more detail.
4. Distributional analysis
4.1 Method
We applied dimension reduction to cluster the extracted responses in more encompassing evaluative dimensions on the basis of semantic proximity. This was done automatically, on the basis of distributional information in the Leuven News Corpus of Belgian Dutch, which totals 1.3 billion tokens, and which is part-of-speech tagged and syntactically parsed. From this corpus, we extracted the 5,000 most frequent content words, and we calculated the corpus frequency of these 5,000 words in a window delimited by the four words preceding, and the four words following each token of every adjective in our dataset. These frequencies were transformed into pointwise mutual information scores, and the resulting row vector of 5,000 pointwise mutual information scores subsequently represented the “semantic passport” of each adjective. It should be noted that the parameter settings specified in this paragraph were based on previous research: we chose settings which most consistently yielded good results for semantic similarity detection tasks in a number of earlier methodological studies (notably Peirsman, Heylen & Speelman, Reference Peirsman, Heylen and Speelman2008 and Heylen, Wielfaert, Speelman & Geeraerts, Reference Heylen, Wielfaert, Speelman and Geeraerts2015).
In the next step, k-medoids cluster analysis was performed to extract clusters of semantically related adjectives (the value k being a researcher-determined parameter which reflects the number of clusters which can be meaningfully extracted). This was done for each valence category (low valence = negative adjectives vs. high valence = positive adjectives) separately, so that by design a low valence type cannot end up in the same cluster as a high valence type. The number of clusters (k) to be used was determined on the basis of the average number of adjective types with a positive silhouette width for any given number of clustersFootnote 4 —we use positive silhouette width as an indication that an adjective type does not fall in the “no manʼs land” between clusters. It turned out that a solution with k = 11 per valence category returned clusters that were sufficiently distinct and interpretable. As a result, we proceeded with 22 clusters, 11 low valence/negative clusters and 11 high valence/positive clusters. At this point, we further reduced our dataset to types with a positive silhouette width in the selected clustering solution. This left us with 447 types.
4.2 Results
Table 4 lists the labels we gave to the negative valence clusters (on the left) and the positive valence clusters (on the right), building on (especially the high frequency) adjectives they contained; in a number of cases, a double label was provided in function of more accurate characterization. Our distributional tool is remarkably efficient at determining semantic similarity, although in three out of 22 cases, clusters are still somewhat heterogeneous on account of a non-matching adjective. The most obvious case in point is the familiar-set, which features the antonymous adjective speciaal ‘special’ among qualifications like algemeen ‘general’ and normaal ‘normal’.
Table 4. Low valence (negative) and high valence (positive) clusters

Some clusters clearly suggest modern prestige evaluations: the laughable/easygoing-, pleasant/appetizing-, cute/appealing-, urban/dynamic-, and potent-clusters represent dynamism-related dimensions. In order to find out whether these correlate with Tussentaal or the Ghent-accent (as suggested by the simple statistics in Table 1), we used correspondence analysis—a multivariate explorative dimension reduction technique—to visualize the associations between 22 evaluative clusters and eight language variety labels.
We propose that Figure 1 diagrams the collective belief system of educated Flemings with respect to their language repertoire as a structured network of mental representations imbued with emotional valence (positive or negative). The mental representation of each variety is determined by the set of links between a variety label and the nearest evaluative clusters, whose proximity to a label reflects their perceptual and conceptual relevance for that label: in this sense, the proximity of the ideology-infused clusters enlightening and clear/pure to the label “VRT-Dutch” represents the conceptualization of the latter as a largely virtual ideal. The physical distance between the variety labels in the diagram reflects their perceptual (dis)similarity and category status, and will be used below as a metric to diagram ideological change.

Figure 1. Biplot of correspondence analysis on the full dataset, with 8 cases (variety labels) and 22 variables (11 positive & 11 negative adjective clusters).
A crucial advantage of a correspondence analysis biplot is that it structures and visualizes data along two interpretable dimensions. Judging from the order of the variety labels positioned on it, the horizontal axis in Figure 1 classifies varieties in terms of their norm status, going from Moroccan-accented Dutch on the left-most negative pole to VRT-Dutch on the positive pole (unsurprisingly, classification on this dimension coincides with a growing preponderance of positive evaluations – shaded in green – from left to right). It is obvious that the norm-dimension does not completely reproduce the extreme ideological juxtaposition of one good variety (VRT-Dutch) and many bad ones, though the representation in Figure 1 comes close. To begin with, there is a tight cluster of varieties at the non-standard pole: although Marokkaans, Antwerps, Hollands and West-Vlaams (we will henceforward use these shorthand labels) feature recognizable accents which are easy to distinguish for all the Flemish (as a result of which their category status is indisputable), our EFR-tool homogenizes them as “rejected” varieties in reference to evaluations like boorish, weird, erroneous or disagreeable—all qualities which reek of ideology-inspired disapproval. On the other end of the continuum, the uncontested pole position of VRT-Dutch, and its tight-fitting association with enlightening and clear/pure equally undeniably reveal the effect of a very conservative value system.
There are two elements in Figure 1, however, which challenge this picture of uncritical ideological affirmation, and suggest that our tool returns more than only the most conservative explicit discourses (Research question 2a). Observe to begin with that Ghent and especially ThuisFamilie (our label proxy for Tussentaal) hold a respectable middle ground in-between the norm extremes. Somewhat surprisingly, Tussentaal occupies a high norm-status close to VRT-Dutch, and it is couched in the standard language evaluations proper, beautiful, and civilized, which confirm the unexpectedly positive Tussentaal perceptions Lybaert (Reference Lybaert2017) also found in her interviews. Although this upgrading could be the erroneous by-product of an infelicitous label (recall that we cannot be certain that respondents evaluate the language variety instead of the television format), our data seem to suggest, in fact, that Tussentaal has become an informal lingua franca, whereas VRT-Dutch is mainly a virtual ideal.
More importantly, and somewhat unexpectedly, Figure 1 reveals a wealth of dynamism-evaluations which allegedly can only be extracted with more sophisticated tools that keep respondents ignorant of the linguistic goal of the experiment. Crucially, the dynamic evaluations we had anticipated to correlate with Tussentaal actually qualify the Ghent accent, which is deemed laughable/easy-going, cute/appealing and pleasant/appetizing. Recall that this need not surprise us, as Ghent is currently an icon of cool in Flanders: it looks like this reputation is materializing in a growing (modern) prestige of its characteristic accent. The relative upgrading of the Ghent accent, and its association with dynamic prestige-attributes is plausibly indicative of a newer value system, and this modern ideology is also embodied on the vertical dimension of Figure 1, on which varieties appear to be hierarchized in terms of “energy,” as indicated by sluggish at the bottom, dull/average in the middle, and urban/dynamic at the top. This y-axis classifies varieties as a non-energetic one (Limburgs, uniquely associated with the dimension sluggish), an ‘over-energetic’ one (Moroccan), and energetic ones (all others). Remarkably, the y-axis also stratifies dynamism attributes in negative dimensions at the upper end of the top cluster (offensive, marginal, pompous, and arrogant), and positive ones at the lower end (laughable/easy-going, cute/appealing, and pleasant/appetizing).
A disadvantage of the representation in Figure 1 is that it maps an essentially more-dimensional structure in a bi-dimensional space. Figure 2 corrects for this impoverishment by adding a third dimension and conjuring up a three-dimensional space which does justice to the more-dimensional nature of the correspondences. It diagrams four sides of the cube that represents the three-dimensional space. The picture in the top-left corner represents the front side of the cube (as in Figure 1), the one in the top-right corner the right side, the one in the bottom-left corner the top side, and the one in the bottom-right corner the left side, but with the viewerʼs head inclined to the left. If anything, the three-dimensional representation in Figure 2 demonstrates that the Antwerp accent is isolated from all the other (rejected) varieties on a third dimension which juxtaposes arrogant and non-arrogant varieties; perceived arrogance clearly is (the city of) Antwerpʼs defining trait. For a dynamic version of the more-dimensional representation which is statically depicted in Figure 2, please see the HTML version of the article for a 3D representation of Figure 2 which can be rotated and zoomed.

Figure 2. Biplots of three-dimensional correspondence analysis on the full dataset, with 8 cases (variety labels) and 22 variables (11 positive & 11 negative adjective clusters), depicted from four angles.
In order to test Research question 3—pertaining to generational change in the Flemish belief system with respect to the varieties in the repertoire—let us diagram apparent time change by comparing Figures 3 and 4, which represent correspondence analysis biplots of data produced by older and younger participants. If anything, these bi-plots show us how stable perceptions and conceptualizations are over generations: both reproduce a highly similar conceptual structure with a horizontal norm dimension and a vertical energy dimension, both with identical poles. There are, nevertheless, a number of non-trivial differences in the middle of the horizontal dimension. For older respondents, Gents and Tussentaal no longer represent completely rejected varieties (like Marokkaans, Antwerps, and West-Vlaams), but there is no dynamic embedding of the Ghent accent (yet): it is especially the Holland accent which is deemed the more dynamic. For the younger respondents, however, Hollands has become a rejected variety, while Gents seems to be emancipating itself as an accent which is deemed both dynamic (vide the dimensions laughable/easy-going, cute/appealing, and pleasant/appetizing on the left) but also standard-like in some respects (familiar, proper, beautiful). More importantly, there is a visibly growing perceptual rapprochement between Tussentaal and VRT-Dutch in the younger data.

Figure 3. Biplot of correspondence analysis on data produced by older respondents, with 8 cases (variety labels) and 22 variables (11 positive & 11 negative adjective clusters).

Figure 4. Biplot of correspondence analysis on data produced by younger respondents, with 8 cases (variety labels) and 22 variables (11 positive & 11 negative adjective clusters).
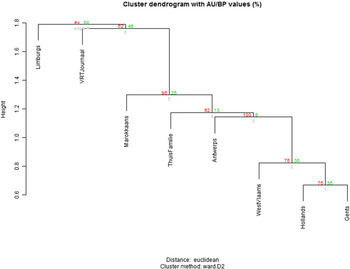
A more categorical way to diagram generational change is by clustering varieties on the basis of their association profile, i.e., on the basis of the extent to which they are associated with each of the 22 dimensions. Figures 5 and 6 represent clustering dendrograms (ward.D2; Euclidean distance) computed on the association profiles for the older and younger respondents respectively. In the dendrogram for the older respondents, Limburgs is juxtaposed with all the other varieties, but the interesting finding is that the remainder of the dendrogram confirms the conservative ideological dichotomization of VRT-Dutch and all other varieties. In the dendrogram for the younger respondents, however, standard and non-standard varieties are contrasted, and within the standard group, VRT-Dutch and Tussentaal cluster together, which is the best evidence for their growing proximity in young perceptions. The non-standard group in the younger dendrogram reproduces the Limburg vs. non-Limburg divide, and within the latter, Moroccan is no longer a completely excluded variety: it clusters with Antwerps (on account of both varieties’ perceived arrogance).

Figure 5. Clustering dendrogram based on association profiles for eight variety labels (older respondents).

Figure 6. Clustering dendrogram based on association profiles for eight variety labels (younger respondents).
5. General discussion
In this paper, we have enriched experimental free response findings with valence data and automatized semantic similarity post-processing to access and visualize the competing language ideologies claimed to give present-day Belgian Dutch its mixed outlook.
One of the more crucial advantages of this approach is that it has significantly extended our knowledge of dynamism as a modern prestige dimension. We have found a distinction between negative and positive dynamism, which is reminiscent of the distinction between the strong and aggressive dynamism central in early work on social psychology (Osgood, Suci & Tannenbaum, Reference Osgood, Suci and Tannenbaum1957; Williams, Reference Williams1970; Giles, Reference Giles1971; Mulac, Hanley & Prigge, Reference Mulac, Hanley and Prigge1974) and the less macho, cooler dynamism in Kristiansen (Reference Kristiansen2009) which was elicited on the traits self-assured, fascinating, and cool. This difference between negative and positive dynamism may explain why the Moroccan accent has a lower status on the norm-dimension in Figure 1 than the Ghent accent. On a somewhat more speculative note, the interaction between the norm- and energy-dimension in Figure 1 spawns four prestige configurations which correlate with a lower to higher standard status: negative dynamism indexes Moroccan, Antwerp, and West-Flemish, positive dynamism Ghent; the practical superiority features beautiful, civilized and proper correlate with Tussentaal, while the virtual superiority features enlightening and pure delineate VRT-Dutch. From these data and our interpretation of them, we can plausibly predict a greater production tolerance for the Ghent than for the Moroccan and Antwerp accent, as well as, eventually, an (informal) standard status for Tussentaal.
A theoretically crucial question is how our experimental tool can extract dynamism evaluations in the face of the claim that it takes sophisticated elicitation tools (viz. speaker evaluation) and ignorant respondents to access them. Recall that our findings on this point align with other recent evidence that dynamism can be extracted explicitly from non-ignorant participants. There are two possible reasons for the fact that we were able to uncover dynamism motivations with the EFR-tool. To begin with, it cannot be excluded that our tool can access ‘deeper’ evaluations than Kristiansenʼs label-ranking task because it was designed to ensure spontaneous, less premeditated responses (with a digital timer ticking down). A further advantage of the representation in Figure 1 is that it is not the outcome of a cognizant hierarchization of labels (as in Kristiansenʼs label ranking task), but the result of associations between labels and qualities, a task which is geared towards qualification of individual varieties, and which is therefore undeniably less conscious than the sentient classification of competing varieties. In our free response task, respondents do not produce fully-fledged ideologies in the form of exhaustive hierarchies: they return no more than the atoms of ideology in the form of individual keywords. While it is the underlying ideologies which prompt these keywords, the method arguably entails more “automatic” assessment than label ranking.
A second possibility is that the modern value system with its dynamic prestige reference points is not a covert, hidden, implicit, or unconscious ideology in Flanders. A possible explanation for the more overt character of dynamism in Flanders could be the hyperstandardization process with its thoroughly ideologized meta-discourses and the ongoing mediatization of language issues: especially younger intellectuals are increasingly aware of the complimentary distribution between virtual but correct VRT-Dutch, and incorrect but vital and cool Tussentaal (observe that this explanation does not work for dynamism evaluations in Netherlandic Dutch, which is one of the least contested, most consensus-based standard languages in Europe, in which ideologized meta-discourses play almost no role).
If it is not on account of their covert, implicit, or non-conscious character, why are dynamism evaluations so much more difficult to extract, in general, than the superiority evaluations typically associated with standard varieties? A possible explanation could be the fact that superiority and dynamism are not equally available to our respondents. The ideologically determined link between standard varieties and traditional superiority-, beauty-, and purity-features is much older, and therefore more deeply entrenched, than that between non-standard varieties and dynamism features. As a result, evaluations of non-standard varieties driven by more recent ideologies have not percolated as deeply into the explicit evaluative lexicon of the Flemish speech community (Grondelaers & Speelman, Reference Grondelaers, Speelman, Daems, Zenner, Heylen, Speelman and Cuyckens2015:382). Recall in this respect that VRT-Dutch was by far the strongest and lexically most uniform concept (weighted unicity score = 60.59%), while the most dynamic variety, the Ghent accent, was the least uniform concept (41.08%). It goes without saying that the free response tool presented here is a valuable way of extracting the lexemes associated with dynamism features; these lexemes can subsequently be translated in more valid measuring scales in speaker evaluation experiments.
6. Conclusion
In this paper we have reported a free response experiment in which adjectival keywords were extracted in reaction to four regional accent varieties, one ethnic accent variety, and two supra-regional varieties of Belgian Dutch. Building on big data–based distributional analysis to detect semantic similarity, and on valence data from psycholinguistics, keywords were clustered in 11 positive and 11 negative evaluative dimensions. Next, we computed a series of correspondence analyses of the evaluative clusters and variety labels to obtain perceptual maps of the Belgian Dutch repertoire. All in all, we were able to answer three research questions:
-
Analysis of the raw response data indicates that the extracted keywords do not constitute an unstructured bag of words: they represent the (stereotyped) beliefs and evaluations which are the building blocks of more encompassing linguistic value systems.
-
The two types of enrichment lay bare the architecture, dimensionality, and conceptual content of language ideologies in a number of crucial ways. On account of the fact that our EFR-tool seems to probe linguistic value systems much “deeper” than warranted by the suggestion that only sophisticated elicitation techniques can extract the more covert ones, the perceptual map in Figure 1 diagrams both the conservative and the progressive hierarchizations which are simultaneously operative in the Flemish community. These hierarchizations are not only evident from the dimensionality in the diagram, but also from the valence of the evaluation clusters which make up the mental representation of the varieties: the proportion of positive/negative clusters which correlate with the up- or downgrading allows us to qualify the hierarchizations much better than any speaker evaluation experiment.
-
On a more empirical note, our EFR-tool uncovered a more stratified picture of the Belgian language repertoire than we had expected. The hyperstandardization of Belgian Dutch manifests itself in the uncontested pole position of the allegedly best variety VRT-Dutch on the norm dimension, and the tight link between that variety and the dimensions enlightening and clear/pure, which reveal the effect of a very conservative standard language ideology. At the same time, the stigmatized supra-regional variety Tussentaal is increasingly regarded as the informal lingua franca of Belgian Dutch, and the Ghent accent is associated with clear dynamism evaluations.
-
Although a comparison of evaluations produced by older and younger respondents mainly reflects the stability and persistence of conceptualizations of the Flemish language repertoire, there are indications of generational change which are captured most revealingly in the clustering dendrograms, which confirm that for the younger respondents, the conceptual distance between Tussentaal and VRT-Dutch is noticeably smaller than for older respondents.
Our findings are inevitably subject to a number of limitations. We cannot state too emphatically, to begin with, that the statistics used in this paper represent exploratory techniques which help us group and classify data, but which do not reveal anything about the statistical significance of the differences we observe. Another limitation of our findings is the fact that evaluations were extracted in response to variety labels, which do not always work well (we have suggested in this respect that the label ‘ThuisFamilie’ is not a perfect fit for the variety it denotes), and which inevitably abstract away from pivotal impression determinants such as accent strength (Grondelaers, Van Hout & Van Gent, Reference Grondelaers, van Hout and van Gent2019): the fact that the status of even the least prestigious accent increases as it gets milder, is impossible to accommodate in this sort of task. What the present experiment has shown is that it is possible to get a firm experimental grip on the perceptual and ideological correlates of standard language dynamics of Belgian Dutch, and that researchers who plan speaker evaluation experiments to investigate these dynamics had better conduct an EFR-experiment as a leg-up.
Acknowledgments
We would like to thank Lisa-Marie Bauwens for her assistance in collecting some of the data used for this publication.


 Open access