


1. Introduction
Parallel ridges, which run in the direction of flow, have been observed ahead of many retreating glaciers. The formation of these "flutes" has been discussed frequently and various conflicting theories on their origin have been proposed. Flutes have been considered both as erosional and as depositional features. Some flutes may be formed by erosion; for example, boulders embedded in the basal layer of a glacier might form grooves in the subglacial material, but others, formed by accumulation of material, are certainly more common. We shall only consider here the formation of a flute by deposition.
Many flutes, though not all, are observed to begin on the down-stream sides of boulders. Dyson (1952) suggested that subglacial material, saturated with water, might flow into tunnels formed on the down-stream sides of such boulders where it would become consolidated into flutes. Paul and Evans (1974) report that their observations of the internal structure of flutes in glacio-fluvial sediments support this hypothesis. Both Dyson and Paul and Evans assumed that long tunnels rather than short cavities are produced on the lee sides of the boulders. Reference TodtmannTodtmann (1952) noted that some flutes do not originate at boulders and suggested that basal crevasses, developed as a result of stress in the ice mass, may play a similar role to the subglacial cavities formed behind boulders. Reference Hoppe and SchyttHoppe and Schytt (1953) observed that flutes can maintain a constant height over distances of hundreds of metres. They suggest that this can only happen if the fluid ground moraine freezes when it flows into the cavity and is then carried with the ice, to be deposited as a flute when the down-stream end of the band of debris-laden ice reaches a permanently frozen area at the ice front and freezes to the substratum.
Reference BaranowskiBaranowski (1970) suggested that the spacing between flutes is more regular than would be expected if the flutes were seeded by randomly deposited boulders and that the flutes are generated by frost heaves, which are regularly spaced, at the junction between the warm and cold zones of the glacier. However, Reference BoultonBoulton (1976) has shown that random seeding could also generate the flute spacing observed by Baranowski at Werenskioldsbreen, Spitsbergen. Reference Shaw and FreschaufShaw and Freschauf (1973) suggest that debris in the basal layer of the glacier is formed into bands as a result of flow perpendicular to the main down-stream flow. The debris is later deposited as a flute. Shaw and Freschauf postulate that the pressure gradients required to sustain this flow arise as a result of an extensive system of longitudinal crevasses.
A theoretical analysis of the generation of flutes by subglacial cavities is made in the present paper. It will be shown that it is not necessary for subglacial material to freeze as it flows into a cavity in order that a flute may be formed. Under certain conditions it is possible for unfrozen till in a cavity on the down-stream side of an obstacle to act as an obstacle itself and to generate a cavity on its own down-stream side. This cavity may then be filled in turn by till and thus the flute grows. In this way material is added at the down-stream end, rather than at the up-stream end behind the boulder as suggested by Hoppe and Schytt. In our model, flutes do not form by flow of material into a pre-existing subglacial tunnel as implied by Dyson. Although a completed flute does fill a tunnel in the ice, this tunnel is generated by the resistance of the flute material to the overburden pressure of the ice and would not otherwise exist.
The Stress Field
We assume that the till bed and flute can be adequately described as a linear, isotropic, elastic material prior to failure. Further, it is supposed that either plane strain or plane stress conditions prevail in the flute cross-section in the estimation of cross-section stresses. These represent two extreme longitudinal restrictions, zero displacement and zero traction, but, for the traction boundary conditions applied here, these restrictions determine stress fields identical in cross-section. Only the longitudinal components of stress are different, these influence possible flow along the flute length, a problem not considered here.
The traction problem can be solved by complex-variable methods for a bed contour-flute profile which can be mapped conformally onto a half-plane boundary by a rational function (Reference MuskhelishviliMuskhelishvili, 1954). An analytic solution and a detailed computer program have been developed by Reference Morland and BoultonMorland and Boulton (1975) for a class of functions which map normalized multi-hump-hollow contours that are asymptotic to the half-plane boundary at infinity. This program is used for the present calculations.
If x and y are rectangular Cartesian coordinates in the cross-section, y vertically upwards and measured from bed level, normalized coordinates X, γ may be defined by the equations

where a is the flute height. The flute height has unit amplitude in the new coordinates. We define complex variables

The analytic solution and program apply for the rational mapping

where the poles ζn are distinct and lie in the upper half of the ζ-plane, η > o, and the zeros of ω'(ζ) are also required to lie in the upper half-plane. The bed and flute are mapped onto the lower half of the ζ-plane, η < o.
A simple normalized symmetric profile is chosen to represent the flute. It is given by the mapping
where the half-plane boundary η = o maps onto

The normalized flute height (maximum amplitude) occurs at ξ = o (X = o) with unit magnitude, and γ tends to 0 + as ξ(X) tends to ±∞. The normalized flute breadth depends on A, and can be defined as 2ξ 2 where γ(ξ 1) has some chosen small value. However, a more useful measure is 2ξ 2 where γ(ξ 2) = 0.5, the breadth at half-amplitude, which also defines an inverse aspect ratio. A decreasing sequence of values for A generates profiles which have increasing aspect ratios. These profiles describe successive stages of a flute formation as the till fills the cavity from below. During the process the actual height a increases, and it is supposed that the central region of non-contact between the ice and flute shrinks steadily until a stable flute is attained. Since the cavity is related to the up-stream section of flute already formed, there should be complete contact when the stable height is reached.
We suppose that pressure in the cavity is the atmospheric pressure over the ice sheet neglecting effects of cavity contraction during the fill process, and take this as the zero stress point. If the mean ice thickness is h and the ice density is p, then the overburden pressure over the level bed outside the flute is
It is assumed that, where it is in contact, the ice exerts a normal traction equal to the local overburden pressure, but exerts negligible shear traction and zero normal traction over the non-contact zone |x| < λ. Thus,

where y(x) tends to o for x outside the main flute profile.
The computer package solves the traction problem for zero body force and zero stress at infinity. Since the till density ρr is appreciably greater than the ice density, the gravity force per unit mass — ρrg j, where j is a unit vector parallel to oy, can have a significant effect over the flute height a, and must be included. For simplicity it is supposed that the ice overburden induces an isotropic pressure po in the layer below the level bed at large distances from the flute, and that only the vertical stress is modified by the gravity force. Now we can introduce a stress-decomposition
where σo is self-equilibrating (zero body force) and approaches zero at infinity. That is σo is the stress field given by the standard solution. By Equations (7) and (8) the tangential and normal boundary tractions (right-hand sense) for σo are

where α is the inclination of the surface to Ox.
If the horizontal stress at infinity, near the bed, is not —p 0 then the term —p 0i in Equation (8) must be changed accordingly, and the boundary tractions (Equation (10)) are modified. Variation with depth at infinity will have no significant effect on the stress in the flute profile.
Writing λ = aΛ and using a stress unit p0, the normalized tractions (Equations (9) and (10)) become

Flute Formation and Stability
We suppose that a flute is formed continuously by the flow of "sloppy" till into the cavity which appears at the down-stream end of the flute as the ice passes over. Ice pressure over the contact regions on either side of the cavity will produce a laterally inward and upward flow (in addition to any longitudinal flow) so that the till gradually fills the cavity. The main fill process is assumed to be shear flow in the cross-section normal to the flute axis, this flow continues while a given shear failure criterion applies. We first examine a flute with a low aspect ratio in order to estimate the minimum ice thickness required to initiate failure and incipient growth. We then consider a flute with a typical aspect ratio for a sequence of decreasing values of Λ to determine whether failure conditions are maintained as the ice contact region spreads inwards to the crest, implying a continued fill process. Next, a sequence of profiles of fixed aspect ratio and increasing height is examined, this represents a completely filled cavity subject everywhere to the ice pressure. We study this sequence in order to determine the maximum height of a stable flute with a particular aspect ratio. This is repeated for a number of different aspect ratios. Finally, the relation between the height of a flute and the size of its initiating boulder is investigated.
It is assumed that the flow process in the cross-section continues wherever the cross-section stresses satisfy a Coulomb failure criterion:
where c is the cohesive stress and ϕ the angle of friction of the material, τ and σ are the shear and normal tractions (right-hand sense) on the plane across which failure is initiated, p w is the pore water-pressure and —(σ+pW) defines the "effective normal pressure". The distribution of the pore water-pressure depends on the amount of water discharged through the subglacial bed and also on the permeability of the material; these quantities may be estimated using equations given by Boulton and others (1974). A stable profile is reached when the stresses lie within the envelope defined by Equation (13) at all points in the cross-section. If σ1, and σ2 are the principal stresses, then Equation (13) can be expressed as
The angle between the normal to the failure plane and the maximum principal stress axis is ±(π/4—ϕ/2). That is, the line of failure is inclined at angles of π/2 + ϕ/2 or 3π/4—ϕ/2 to the maximum principal-stress axis.
If we introduce an extra normalized stress Σ (over the isotropic pressure p 0) by
with principal values Σ1, and Σ2, and define
then the failure criterion (Equation (14)) becomes
Σ1, and Σ2 and S depend on the flute shape (parameter A in Equation (4)) but the right-hand expression depends only on material properties and the mean overburden pressure. Let S max be the maximum absolute value of S over the flute cross-section, failure is then initiated where and when S max first satisfies Equation (17), that is, when
In particular, in the undrained case pw = p0, this is simply
For the initiation and early growth of a flute a\h is very small and Λ is effectively the flute width, so that the boundary tractions (Equations (11) and (12)) are essentially T = o, N = o outside the flute, and N = 1 over the flute, independent of h. Thus σ op 0 is independent of h, and the body-force contribution γρra/(ρH) to Equation (8) is negligible, so that by Equation (15) Σ, and hence Σ1, Σ2 and S, are independent of h. Consequently Equation (19) can be rearranged to determine the minimum ice thickness (minimum p 0) required to initiate failure at some point in an incipient flute. This gives
Here S max is the value determined for a profile with a low aspect ratio and a given friction angle ϕ. Computations in which the shape parameter A is varied and in which Λ = 2 show little change in S max, but S max decreases with decreasing ϕ. For example, with A = 2, S max = 0.630 if ϕ = 27°, and S max = 0.469 if ϕ = 20°. From Equation (20) the minimum ice thickness required to initiate the flow of undrained till with cohesion c = 5 x 10³ kg m-1 s-2 and friction angle ϕ = 27° is 0.879 m. However, when h is so small, the initial assumption of a low a\h ratio no longer holds and S is no longer independent of h. As a\h tends to I, S max tends to 0.627 for ϕ = 27°. Thus the minimum ice thickness will be slightly less than the original estimate. Undrained subglacial material will evidently start to flow into subglacial cavities even if these are very close to the edge of the glacier. Figure 1 shows the variation of S and the directions of failure at S max within a flute with shape parameter Λ = 2 and material friction angle ϕ = 27°. The maximum value of S occurs on the sides of the flute. The directions of failure at S max are shown by crossed lines.
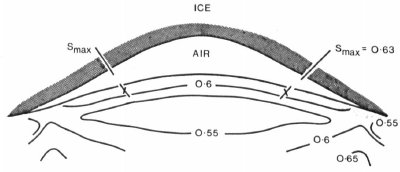
Fig. 1. The variation of S and the directions of failure at Smax for an incipient flute with shape parameter A = 2, material friction angle ϕ = 27° and Λ = 2. The directions of failure at Smax are shown by crossed lines.
A typical flute profile with a height-to-width ratio of unity measured at the half height is given by A = 0.5. Solutions for a decreasing sequence of Λ starting from the slope turningpoints on the profile and ending at full contact Λ = o are considered to describe a sequence of intermediate growth stages with expanding ice contact regions. Now the density ratio ρr/ρ and a ratio of height to ice thickness a/h are relevant in the traction conditions (Equations (11) and (12)), and hence influence Σ and S. A ratio of ρr/ρ = 3 is adopted and a range of values of a/h increasing from 0 to 0.5 are considered.
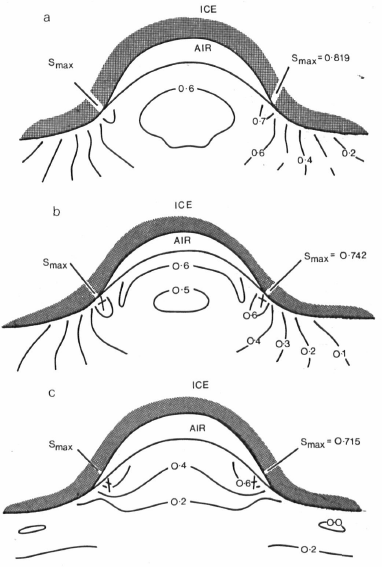
Fig. 2. The variation of S and the directions of failure at Smax for a flute with A — 0.5, ϕ = 27° and Λ = 1. The ratio a/h is 0 in Fig. 2a, 0.05 in Fig. 2b and 0.5 in Fig. 2c.
Figure 2 shows the variation of S and the directions of failure at S max for Λ = 1, ϕ = 27° and a/h = o (Fig. 2a), 0.05 (Fig. 2b) or 0.5 (Fig. 2c). In each case the maximum value of S occurs near the edges of the cavity, and one of the failure directions is nearly vertical. The value of S max decreases with increasing a/h and ranges from 0.819 at a/h = o to 0.715 at a/h = 0.5. At this stage the minimum ice thickness required for this flute to grow will be 0.78 m. As Λ decreases the value of S max for a given value of ϕ increases if a/h ≤ 0.2. Thus, if material starts to flow into a cavity it will continue to flow until the cavity is full. However, very near the edge of the glacier, where a/h ≥ 0.2, S max decreases with decreasing Λ and thus partially filled cavities may occur.
The points of maximum S, at which failure is expected to occur, move towards the crest of the flute as Λ decreases. Figure 3 shows the symmetric pattern of flow which would result from successive failure at both these points. A flute could form by asymmetric flow if failure is initiated on one side only, because of slight inhomogeneity in the material for example.

Fig. 3. The pattern of flow that would result from shear failure at each successive pair of points of maximum S. As the cavity is filled the points of maximum S move towards the crest of the flute.
Finally, we investigate the maximum height of a stable flute of given aspect ratio in complete contact with the upper ice. That is, the maximum flute section that can continue to form down-stream of a possibly larger cavity section behind the initiating boulder. Smaller flute sections will be stable. Under these circumstances Λ = 0 in Equation (12) and only the second expression applies, so that both T and N depend on a/h as a common multiplying factor. That is, a stress field σ° based on a unit p 1, = ρga instead of p 0 = ρgh is independent of a/h. With the stress unit p 1 the gravity force contribution in Equation (8) becomes (gϒρr/ρ) j X j. also independent of a/h, and hence the new Σ and S are independent of a/h. Thus, the failure criterion Equation (17) in the case p 0 = p w becomes
implying that the maximum p 1, and maximum a for non-failure are given by
This maximum flute amplitude is independent of ice thickness h provided that this thickness is sufficient to support the formation process. It increases with increasing cohesion c, and depends on ϕ and ρr/ρ through S max. Figure 4 shows the variation of S and the directions of failure at S max for ϕ = 27° and A = 0.5. S max = 0.693 at the sides of the flute. For material of cohesion c = 5 X 10³ kg m-1 s-2 the maximum height is 0.8 m.
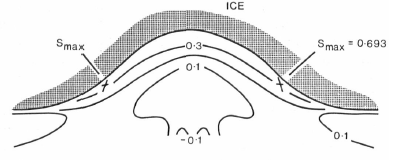
Fig. 4. The variation of S and the directions of failure at Smax for a flute with A 0.5 ϕ 27 and Λ = o.
The Height of Flutes
We have shown that unless h ≲ 5a cavities will be filled completely if they are filled at all. Thus, if a (lute is formed on the lee side of a boulder, its initial height at the boulder will be a 0, the height of the cavity. The height of the (lute some distance from the boulder will be equal to a 0, if a 0 is less than the maximum stable height a max. If a 0 is greater than a max the height will decrease with distance down-stream until the maximum stable height, which is independent of h in the undrained case, is reached.
Boulders found at the head of flutes may be divided into two groups. Those that have been considerably eroded by the glacier and are deeply embedded in the till have the shape of roches moutonnées. The height a 0 of the cavity may be estimated from the height of the "nose" which divides striated and unstriated areas on the steep lee side. This height is sometimes equal to the height of the boulder but is usually rather less. Other boulders, less deeply embedded in the till, are rough and do not have the streamlined roche moutonnée form. A rough estimate of the height of the cavity behind such a boulder may be made in the following way.
Suppose that the ice may be treated as a Newtonian viscous liquid which is moving slowly (cf. Reference NyeNye, 1969). Then, the velocity and pressure distributions in the ice around the boulder may be found if the Navier-Stokes equations are solved with the body forces and inertia terms neglected. The boundary conditions depend on the temperature of the ice. If the subglacial material is not frozen then the basal ice must be at the pressure-melting point and regelation will provide a lubricating film of water on the surface of the boulder. Thus, one boundary condition for the ice is that the tangential component of surface traction is zero. For boulders of radius greater than about 1 m it is expected that regelation flow normal to the surface will be small, and thus the normal ice-velocity at the boulder will be effectively zero.
Let the boulder be represented by a hemisphere of radius R. Define Cartesian coordinates x, y and z measured in directions perpendicular to the direction of flow of the ice, vertical and along the direction of flow respectively. The origin is at the centre of the hemisphere and u, v and w are the components of velocity in the x, y and z directions respectively. The polar coordinates r and θ are measured from the same origin with θ = o along the positive z-axis. The two boundary conditions may be written

As r becomes large u -> o, v -> o and w -> U, where U is the relative velocity between the glacier and the boulder. Reference LambLamb (1932, p. 601) gives the solutions of the Navier-Stokes equations for these boundary conditions. In particular, the normal pressure on the surface of the hemisphere is
η is the viscosity of the ice which we shall take to be 1 bar year-1. If p n is negative for any part of the hemisphere the ice will become detached from the surface and a cavity will form. Of course, once a cavity has formed Equation (24) no longer applies. However, we shall estimate the height of the cavity by supposing that the line of separation of ice and hemisphere is given by θ = θ' where θ' is the solution of the equation
The estimated vertical height of the cavity is then
As the size of the boulder increases, the relative size of the boulder cavity decreases. Equation (24) becomes a better estimate of the normal pressure distribution as the pattern of ice flow approaches that for the case of no cavitation. Thus, the estimate of the vertical height of the cavity is most accurate for the largest boulders.
Discussion
The hypothesis of flute formation discussed in the preceding sections leads to several predictions which may be compared with data from the field.
(i) A flute grows by successive shear failure
The observations of the internal structure of flutes in bedded sediments made by Reference Paul and EvansPaul and Evans (1974) and later by Boulton (1976) strongly support the hypothesis that flutes are formed by shear flow in the cross-section normal to the flute axis. Some evidence of the mode of formation may be derived from till flutes by analysis of the pattern of preferred orientations of the long axes of elongated particles in the till. The pattern should reflect the pattern of flow of material during the formation of the flute (Reference Glen, Glen, Donner and WestGlen and others, 1957).
Shaw and Freschauf (1973) found that elongated pebble and grain long axes were oriented in preferred directions converging towards the flute ridges in a down-glacier flow direction. The long axes also dipped up-glacier. Hoppe and Schytt (1953) found a preferred orientation in the level ground-moraine but not in the flutes themselves in Iceland. However, pebbles in flutes in front of Isfallsglaciären did have a preferred orientation, parallel to ice flow. Reference Andersen and SollidAndersen and Sollid (1971) found preferred orientations converging towards the flute ridge immediately down-stream of the initiating boulder but parallel to the ridge further down-stream. However, they were measuring the orientation of stones on the surface of flutes whereas Shaw and Freschauf measured samples from sites within the flutes. Reference Gravenor and MenleyGravenor and Menley (1958) found that the orientations of silt and sand particles were parallel to the flute ridge to a depth of 3 m but deviated from this direction at greater depth. Figure 5 shows the results of measurements made on two flutes at the margin of Breiðamerkurjökull (south-east Iceland) in an area at the north-east corner of Breidárlón. A section was made across each flute at 4 m from the boulder at its head, and the size, position and orientation of the long axis were measured for 203 stones in flute A and 300 stones in flute B. The projections of the preferred orientation of the long axis onto the horizontal and the vertical transverse planes are shown for various parts of the two sections. Near the surface of the flutes the stones lie with their long axes parallel to the plane of the surface and forming a herring-bone pattern. Inside the flute the dip at the long axes is greater and increases toward the centre of the flute.
These long axis orientation patterns suggest that a combination of transverse flow similar to that shown in Figure 3 with subsequent shearing by the over-riding ice in the direction of flow of the glacier has occurred. The surface stones with long axes in the plane of the surface are loose and have fallen down the sides of the flute. The pattern of flow of material to form a flute is discussed further by Boulton (1976) who has investigated the internal structure of several flutes by till fabric-analysis and magnetic anisotfopy measurements.

Fig. 5. The preferred orientations of the long axes of stones revealed by sections across two flutes at the margin of Breiðamerkurjökull. The projections of the preferred directions onto the horizontal and vertical transverse planes are shown for various parts of the two sections.
(ii) The maximum height of a flute depends on the mechanical properties and drainage of the flute material
We have suggested that the maximum possible height of flutes depends on the mechanical properties and drainage of the subglacial material. The maximum height of flute observed in a particular area may be less than the maximum possible height if there are no large boulders to produce the largest possible flutes.
Table I shows the maximum height of flutes observed by various authors with details of the material where available. Paul and Evans (1974) found that flutes on sand and gravel were smaller than flutes on till in the same area. This we expect since the sand and gravel will have a lower cohesion than the till. The smallest flutes, observed by Reference RayRay (1935), are on gravel. Boulton and Dent (1974) have measured the mechanical properties of flute material at the western margin of Breiðamerkurjökull. They give a shear stress at failure of 3 × 10³ N m−2 to 8 × 10³ N m−2 and a friction angle ϕ = 27°. We have found that very wet till close to the edge of Breiðamerkurjökull in an unfluted area north-east of Breidárlón had a failure stress of (4±2) × 103 N m−2. The wettest fluted moraine was found north-east of Jokulsárlón where the material in the centre of the flutes was found to have a failure stress of (8±5) × 103 N m−2. The lower value is probably the best estimate of the strength of the undrained material and leads to a maximum flute height of (0.634±0.32) m. The maximum flute height observed in the area was 0.67 m. Boulton and Dent report a maximum height of 0.50 m. The very large flutes observed by Shaw and Freschauf may not be formed by the mechanism described here but, if they are, the cohesion required is less than or equal to about 12 × 104 N m−2, depending on the drainage.
Table I. Maximum Height of Flutes Observed by Various Authors

In undrained material the height of a flute should remain constant throughout its length
Reference DysonDyson (1952) reports flutes of length 175-200 m with gradually, "almost imperceptibly", diminishing height. Hoppe and Schytt found that the height of ridges at Briiarjokull in the lee of boulders gradually decreased away from the boulders, but that the height of ridges without initiating boulders scarcely decreased in the down-stream direction. Shaw and Freschauf found that for all sizes of fluting around Athabasca "the maximum elevation of the crest is maintained for distances up to several kilometres". However, once exposed by a retreating glacier, a flute loses height by erosion and consolidation of its material. Measurements on old flutes may therefore lead to estimates of original flute height which are too low, especially at the down-stream end of the flute.
Near Breiðamerkurjökull, north-east of Breidárlón, the height of new flutes (down-stream end revealed for about five years) remains constant throughout their length. The largest flute is 130 m. Boulton (1976) reports flutes of constant height up to 500 m long.
(iv) Flute heights below the maximum depend on the size of the initiating boulder
In Section 4 it was suggested that the height of the "nose" on a boulder in the shape of a roche moutonnée, hn, should be equal to the height of its flute a. Measurements on boulders near Breiðamerkurjökull give a linear relationship between the height of a boulder hb, and the nose height
Thus, a linear relationship between flute height and boulder height may be expected. Boulton (1976) has shown that this is so.
The expression
where R is the radius of a large, approximately hemispherical boulder gives

for the largest boulder (R = 3.4 m) measured by Boulton near Breiðamerkurjökull. If pgh ≈ 106 N m−2 (10 bar) (i.e. the flute is initiated about 500 m from the edge of the glacier) then U, the relative velocity between ice and boulder, is estimated to be about 3.5 × 10⁻⁷ m s−1 (11 m year−1). The basal sliding velocity is 4.8 × 10⁻⁷ m s−1 (15 year−1) (Boulton and Dent, 1974).
Acknowledgements
Dr G. S. Boulton kindly made unpublished field data available to us and we have benefited from many discussions with him on the formation of flutes. Our field observations were made while one of us (E. M. Morris) was a member of the Joint Universities Iceland Expedition, 1974, and we are grateful to all those who assisted with the Expedition. E. M. Morris was supported by a research grant from the Natural Environment Research Council.


