


Introduction
Antarctica is the highest and flattest of the Earth's continents, but small changes in slope have a strong impact on wind direction and speed (Reference Frezzotti, Gandolfi, La Marca and UrbiniFrezzotti and others, 2002a). It is well known that slope and curvature play an important role in the accumulation of snow; for example, concave depressions accumulate snow relative to convex bumps (Reference Black and BuddBlack and Budd, 1964; Reference WhillansWhillans, 1975; Reference Pettre, Pinglot, Pourchet and ReynaudPettre and others, 1986; Reference Van den BroekeVan den Broeke and others, 1999; Reference Liston, Winther, Bruland, Elvehøy, Sand and KarlofListon and others, 2000; Reference Frezzotti, Gandolfi, La Marca and UrbiniFrezzotti and others, 2002a). A large area of the polar plateau, where the slope along the wind direction is larger than 4 m km-1, has a nil or slightly negative snow accumulation (Reference Frezzotti, Gandolfi and UrbiniFrezzotti and others, 2002b).
The spatial scale of significance for a single ice-core record is a critical point in stratigraphic interpretation itself. Micro-relief introduces a high-frequency, quasi-stochastic variability into ice-core records of annual layer thickness (Reference Fisher, Reeh and ClausenFisher and others, 1985; Reference Van den BroekeVan der Veen and Bolzan, 1999).
The stratigraphic record of an ice core is affected by the flow of ice, so the material at depth is slowly moved away from the original deposition site. Reference Richardson and HolmlundRichardson and Holmlund (1999) demonstrate the importance of determining the spatial significance of cores and recommend radar surveys prior to drilling. Snow radar is the most useful tool for detecting spatial snow accumulation variability, and firncore time series have the best temporal resolution. Accumulation variability along the radar profile can be derived using both datasets.
Ablation processes on short (metre) and long (kilometre) spatial scales have a significant impact on post-depositional losses of chemical species by re-emission (Reference Waddington, Cunningham, Harder, Wolff and BalesWaddington and Cunningham, 1996; Reference Wagnon, Delmas and LegrandWagnon and others, 1999) and on the interpretation of ice-core palaeoclimatic time series (Reference Fisher, Reeh and ClausenFisher and others, 1985). Interpretation and dating of palaeoenvironmental records extracted from Antarctic ice cores depends on the knowledge of past accumulation changes (e.g. Reference Bromwich and WeaverBromwich and Weaver, 1983; Reference Jouzel, Merlivat, Petit and LoriusJouzel and others, 1983).
As part of the ITASE (International Trans-Antarctic Scientific Expedition) project (Reference Mayewski and GoodwinMayewski and Goodwin, 1999) and in the framework of the Franco-Italian Concordia Station collaboration, a traverse between Terra Nova Bay (TNB) and Dome C (DC), and research at DC were undertaken between 1998 and 2000. The study aimed to better understand latitudinal and longitudinal environmental gradients, while documenting climatic, atmospheric and surface conditions over the last 200_1000 years in the eastern and northeastern portions of the DC drainage area and in northern Victoria Land. The traverse (Reference Frezzotti and FloraFrezzotti and Flora, 2002) started from GPS1 (74°50.04′ S 160°48.03′ E) on 19 November 1998, reaching Concordia Station at DC (75°06′ S 123°23′ E, 3232 m) on 5 January 1999; a distance of 1300km was covered (Fig. 1). The party performed several tasks (drilling, glaciological and geophysical exploration, etc.) during the traverse (Reference Frezzotti and FloraFrezzotti and Flora, 2002; Reference Gay, Fily, Genthon, Frezzotti, Oerter and WintherGay and others, 2002; Reference PropositoProposito and others, 2002; Reference BecagliBecagli and others, 2003; Reference TraversiTraversi and others, 2004). GPR (ground penetrating radar or snow radar), GPS (global positioning system) and snow morphology surveys were carried out regularly along the traverse (Reference Frezzotti, Gandolfi, La Marca and UrbiniFrezzotti and others, 2002a, Reference Frezzotti, Gandolfi and Urbinib). In addition, shallow ice cores were drilled within a 25 km radius of Concordia Station between 15 and 25 December 1999 (Reference Vincent and PourchetVincent and Pourchet, 2000). In 2000, GPR and GPS surveys, covering a total distance of about 500 km, were used to link all core sites to DC in order to provide detailed information on the spatial variability of snow accumulation.
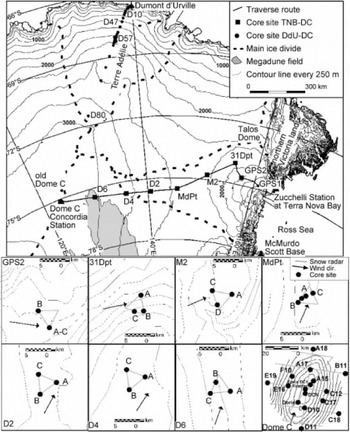
Fig. 1. Schematic map of the traverse from TNB to DC and site locations, and detailed maps of drill sites (contour every 10m for GPS2, 31Dpt, M2, MdPt, D2, D4, D6, from Re_Reference Remy, Shaeffer and Legresymy and others, 1999); contour every 1m for DC, from Reference Capra, Cefalo, Gandolfi, Manzoni, Tabacco and VittuariCapra and others (2000); prevalent wind direction from Reference Frezzotti, Gandolfi and UrbiniFrezzotti and others (2002b).
This paper combines geophysical surveys (GPR and GPS), field and remote-sensing surface observations, and firn-core analyses to describe the snow accumulation variability at seven locations along the traverse and at DC. It also provides new information on the snow accumulation process and discusses implications for palaeoclimatic series from ice cores. Using these data, Reference FrezzottiFrezzotti and others (2004) provide new information on the surface mass-balance process and implications for surface mass-balance distribution and variability.
Methodology
Twenty-three shallow snow-firn cores, up to 53 m deep, were drilled during the traverse at eight sites between TNB and DC (at intervals of 90-150 km);16 more were drilled at DC using an electromechanical drilling system (Table 1). At seven sites a 43-53 m deep 'main core' was drilled at the site camp and two 7-15 m deep 'secondary cores' were drilled 5-7km away. The location of the secondary sites was identified in the field after a detailed GPS-GPR profile along a 15 km triangular track (Fig. 1). Data processing in the field was used to identify variability in the internal layering of the snowpack. Snow temperature profiles, down to 30 m depth, were measured at main core sites after a 15-24 hour equilibration period (Reference Frezzotti and FloraFrezzotti and Flora, 2002). Snow/firn density was determined immediately after retrieval by measuring and weighing core sections. Snow was poorly sintered in the uppermost layers; density was thus measured in a pit (close to main core and stake farm) where stratigraphic studies and snow sampling were also performed (Reference Gay, Fily, Genthon, Frezzotti, Oerter and WintherGay and others, 2002).
Table 1. Table 1. Location, morphological and climatological characteristic of drill sites; snow accumulation from stake farms, core analyses, and comparison with GPR data (GPR_SA). GPR_SA value are reported as snow accumulation using the depth/age ratio from the ‘main’ core Tritium snow accumulation (Tambora for D4) and depth in % respect to the maximum depth of layering used for the statistical analysis. Katabatic wind speed from Reference Parish and BromwichParish and Bromwich (1991)

Two reference tritium peak levels resulting from 1965 and 1966 thermonuclear atmospheric bomb tests (Reference Picciotto, Crozaz, de Breuck and CraryPicciotto and others, 1971; Reference Jouzel, Merlivat, Pourchet and LoriusJouzel and others, 1979) and the volcanic sulphate signals of the Tambora (Indonesia) eruption (AD 1815) and of an unknown volcanic event (AD 1809) were used to determine the mean accumulation rate at the 'main' cores along the traverse and at DC (Table 1). Tritium depth profiles were transformed into time series by comparing them with the tritium content of precipitation at the Kaitoke (New Zealand) International Atomic Energy Agency station. In Antarctic ice cores the peaks in SO4 2- signatures of Tambora and unknown are dated 1816 and 1810, and represent the most reliable volcanic markers for dating the last two centuries (e.g. Reference Legrand and DelmasLegrand and Delmas, 1987; Reference Dai, Mosley-Thompson and ThompsonDai and others, 1991; Reference Cole-Dai, Mosley-Thompson and ThompsonCole-Dai and others, 1997; Reference UdistiUdisti and others, 2000; Reference StenniStenni and others, 2002). The volcanic signal was obtained from sulphate profiles. No correction for sea-salt sulphate was made because its contribution is always <15% (Reference BecagliBecagli and others, 2003). Analytical procedures for chemical and tritium measurements are described in detail elsewhere (Reference Udisti, Bellandi and PiccardiUdisti and others, 1994; Reference Gragnani, Smiraglia, Stenni and TorciniGragnani and others, 1998; Reference StenniStenni and others, 2002).
The β-radioactive reference horizons of January 1955 and January 1965 were used to determine the mean accumulation rate from 'secondary' cores along the traverse and from 6 m deep cores at DC (Table 1), using methods described in Reference Pourchet, Pinglot and LoriusPourchet and others (1983).
The experimental error (±σe) in the calculated snow accumulation rates for the different periods is estimated to be of the order of <10% for β radioactivity (1955/65-98), about 10% for the unknown-Tambora period (1810-16) and <5% for the tritium (1966-98) and Tambora-present (18161998) periods. These values take into account the different sources of error linked to density determination and the sampling resolution (20-40 cm for β, 3-5 cm for tritium, 2.54 cm for SO4 2).
At seven locations, farms consisting of 40 stakes, centred on the main core site, were geometrically positioned about 100 m apart forming a cross with an area of 4 km2 (Table 1). At DC, a total of 37 stakes were geometrically positioned at a radius of 3, 6, 12 and 25 km from the centre of DC. Stake heights were measured between 1996 and 2002 (Table 2). The snow accumulation at the stakes was multiplied by the snow density measured in a pit up to 2.5 m deep to obtain water equivalent values. At DC an average snow accumulation value of 340 mm of snow (39 kg m-2 a-1), with a standard deviation of 125 mm (14 kg m-2 a-1), was measured during the 1996-99 period at the stakes. The absolute elevations of the stakes (measured by GPS) change uniformly, with an average value of 0.9cm and standard deviation of 0.9 cm during the 1996-99 period (Reference VittuariVittuari and others, 2004). The uniform decrease in elevation (0.9 ±0.9 cm) with respect to the snow accumulation value (340 mm) indicates that the stakes are anchored to the stake bottom. Although snow compaction was not taken into account when calculating snow accumulation, it has often been found to be negligible for accumulation estimation at low-accumulation sites (Reference Lorius, Robin and deLorius, 1983). Snow accumulation variability at stake farms is investigated to determine how representative the results interpreted from a single core might be (Reference Palais, Whillans and BullPalais and others, 1982).
Table 2. Stake farm results and surface morphology conditions at main core sites. The height of the stakes was measured at middle point (MdPt) in 1998, 1999, 2000, 2001 and 2002, at DC in 1996, 1999, at others sites (31Dpt, D2, D4, D6) in 1998, 2000 and 2002, at M2 in 1998 and 2002, and at GPS2 in 1993, 1996, 1998 and 2000

The integration of GPS and GPR data yields the ellipsoidal height of both the topographic surface and firn stratigraphy (Table 1; Fig. 2). GPS and GPR surveys and subsequent analyses are described elsewhere (Reference Urbini, Gandolfi and VittuariUrbini and others, 2001; Reference Frezzotti, Gandolfi, La Marca and UrbiniFrezzotti and others, 2002a). Data acquisition was performed with a Geophysical Survey Systems Inc. Sir10B unit equipped with one monostatic antenna with a central frequency of 400MHz. Principal acquisition parameters were 150 ns for the vertical investigation range (15-20 m) and 1-5 scan s-1 for the acquisition rate, i.e. about one scan every 2-3 m (with the acquisition rate at 1 scan s-1) and 0.40.7m (with the acquisition rate at 5 scans-1). To determine travel times of electromagnetic waves, the depth-density/ depth-speed relation for the snowpack was established using the density profile of three firn cores and one pit in each triangular area along the traverse, and using 17 firn cores and one pit at DC. Density data for each site were fitted with second-order polynomial functions, yielding a correlation coefficient of R 2 > 0.9. To facilitate comparison between firn cores and GPR records, the eight calculated polynomial functions were used to convert firn depths in the seven triangular areas and at DC into water equivalent depths. The depth of the GPR layer was then converted into snow accumulation (GPR_SA) using the depth/age ratio from the 'main' core tritium snow accumulation. Snow accumulation data derived from core records are in good agreement with data derived from GPR_SA (Table 1). In line with other authors (e.g. Reference Richardson, Aarholt, Hamran, Holmlund and IsakssonRichardson and others, 1997; Reference Vaughan, Corr, Doake and WaddingtonVaughan and others, 1999; Reference Spikes, Hamilton, Arcone, Kaspari and MayewskiSpikes and others, 2004), we assume that the layers producing strong radar reflections are isochronal.

Fig. 2. (a) Core location and elevation of GPR selected horizons and surface profiles; (b) depth profile of GPR selected horizons and snow accumulation from firn cores using different methods.
Differences in snow accumulation between the main cores and the secondary cores (Figs 2 and 3) are equally reflected in tritium/β marker and GPR data (Table 1). The two methods yield different results because they sample different areas: the core diameter is 7-10cm, while GPR works at the metre scale. Major differences between the results of the two methods (core and GPR) are found in regions of large spatial variability in accumulation (GPS2, M2 and MdPt sites). The maximum difference between core and GPR (20%), and the highest GPR relative standard deviation (47%) are found at site GPS2. GPS2A and GPS2C cores were drilled a few tens of metres apart and show a 13% difference in accumulation for the tritium/p marker horizons (Figs 1-3; Table 1). In contrast, the lowest standard deviation was obtained at DC (3%).

Fig. 3. Snow accumulation rates at core sites using stake farms and different stratigraphic markers.
Topographic characterization of each site (elevation, slope, etc.) was performed using the European Remotesensing Satellite-1 (ERS-1) radar altimeter digital terrain model, with a grid spacing of 1 km, provided by Reference Remy, Shaeffer and LegresyRemy and others (1999). A3 × 3 pixel window was used to calculate the slope of each grid using the digital terrain model.
Results
Core sites morphological and climatological characteristics
Meteorological data and a continental-scale simulation of the surface wind field (Reference Parish and BromwichParish and Bromwich, 1991) show that the area between TNB and DC is characterized by a katabatic wind flow, with speeds ranging from <6 to >18 m s-1 (Table 1).
The topographic profile of the traverse indicates three sectors (Fig. 4): an area extending about 250 km from GPS1 (slope area), characterized bya large slope of up to 25 m km-1, a second area (plateau area) up to about 900 km, with a slope of up to 4.5 m km-1, and the dome area in the last 250 km, with a slope of <2 m km-1. The slope profile shows very high variability in the first and second areas, and a nearly constant slope in the third area (Reference Frezzotti and FloraFrezzotti and Flora, 2002). The surface morphology in the slope and plateau areas is very irregular and can be linked mainly to flow over undulations in the bedrock morphology and secondarily to environmental conditions (wind and accumulation). In the dome area, surface variability is derived mainly from environmental conditions and secondarily from the bedrock morphology. Only the megadunes in the dome area, close to D6 (Fig. 1), show a pattern of regular oscillation of the surface (Reference Fahnestock, Scambos, Shuman, Arthern, Winebrenner and KwokFahnestock and others, 2000). Megadune formation can be explained by a cyclic variation of the erosion and redistribution process of snow along a slope by an atmospheric wave, with the atmospheric wavelength the same order of magnitude as the megadune (Reference Frezzotti, Gandolfi, La Marca and UrbiniFrezzotti and others, 2002a).

Fig. 4. Surface elevation (solid line), terrain slope (grey line) and micro-relief distribution along TNB_DC traverse. Core sites are indicated with triangles.
Analysis of the morphological conditions of the region shows that (Figs 1 and 2; Table 1):
GPS2, M2 and MdPt are characterized by relatively complex morphologies with 'abrupt' changes in slope and wind direction;
31 Dpt area contains relatively 'steep' slopes (>4 m km-1), but the wind direction is close to the direction of elevation contours, and the slope in the wind direction is therefore very low;
D2 and D4 present low slopes, with a 50-65° angle between the wind direction and the direction of the general surface slope; the D6 core site is located just a few kilometres leeward of the megadune field (Reference Frezzotti, Gandolfi, La Marca and UrbiniFrezzotti and others, 2002a);
DC has the lowest slope, and the major axis of the dome is aligned in the direction of the prevailing wind.
Micro-relief along the TNB-DC traverse consists (Fig. 4) of 31% erosional features (wind crust), 59% redistribution features (sastrugi) and only 10% depositional features (Reference Frezzotti, Gandolfi and UrbiniFrezzotti and others, 2002b). The micro-relief characteristics of core sites (5 km apart), where topography is 'relatively complex' (GPS2, M2 and MdPt), are very different (Figs 1 and 2; Table 1). The D2 and 31Dpt areas are characterized by the alternation of sastrugi fields with sporadic longitudinal dunes (10-20 m long, a few metres wide and up to 1 m high), and by seasonal wind crust with sporadic sastrugi. Depositional micro-relief occurs extensively only in the D4 area, a point close to the David Glacier ice divide, and near DC (Reference Frezzotti, Gandolfi and UrbiniFrezzotti and others, 2002b). The GPS2A, M2A and MdPtC core sites are characterized by the extensive presence of wind crust, consisting of a single snow-grain layer cemented by thin (0.1-2 mm) films of ice, with cracks (up to 2 cm wide) and polygonal pattern. Wind crusts form on the surface due to the kinetic heating of saltating snow under constant katabatic wind flow (Reference GoodwinGoodwin, 1990) and the condensation-sublimation process on both sides of the crust (Reference Fujii and KusunokiFujii and Kusunoki, 1982). Larger grain-sizes are found at the GPS2A, M2A and MdPtC sites. At other sites smaller grains are found in sastrugi or depositional areas (31DptA, MdPtA, D2A, D4A, D6A and DC). Sites MdPtC and MdPtA are only 5 km apart (Fig. 1) but show quite different grain-size profiles, in terms of both mean values and variability (Reference Gay, Fily, Genthon, Frezzotti, Oerter and WintherGay and others, 2002). The MdPtA site contained sastrugi up to 20cm high, but no permanent wind crust. The large difference in grain-size at the two sites is due to different local-scale snow accumulation processes.
Local spatial variability of snow accumulation
The accumulation/ablation pattern derived from the stake- farm measurements shows large standard deviations (Table 2), and largely reflects snow surface roughness (sastrugi) and/or an interruption in accumulation (wind crust) at the sites. This variability or 'noise' is important, and limits the degree to which a single annual snow accumulation value may be temporally representative (Reference Fisher, Reeh and ClausenFisher and others, 1985). Analysis of the MdPt stake-farm data surveyed each year from 1998 to 2002 reveals local- scale spatial variability, suggesting that the annual local noise (metre scale) in snow accumulation could be between ~2 and 4 times the mean snow accumulation, with accumulation ≤0 for 32% of annual-scale observations.
It appears that stake measurements and surface morphology are strongly related at all sites. The lowest standard deviation values are present when the slope along prevalent wind direction (SPWD) is low (31Dpt, D4 and DC). In contrast, site M2, with a high SPWD variability, shows the lowest accumulation value and the highest standard deviation of 144%, with accumulation <0 for a 5year period in 40% of cases. We generally obtained the same mean value for a 5 year period but a much lower variability between individual points, thus concurring with the observation at the old Dome C (Reference Palais, Whillans and BullPalais and others, 1982; Reference Petit, Jouzel, Pourchet and MerlivatPetit and others, 1982). Reference Ekaykin, Lipenkov, Kuz'mina, Petit, Masson-Delmotte and JohnsenEkaykin and others (2004) pointed out that at Vostok the period of smoothing necessary to suppress the noise, due to micro-relief, was estimated to be 7years both for snow accumulation and for 6D time series. This is because the mean surface roughness tends to be conserved, implying a preferential deposition of snow at low-level points and erosion of sastrugi (Reference GowGow, 1965; Reference Petit, Jouzel, Pourchet and MerlivatPetit and others, 1982; Reference AlleyAlley, 1988).
Temporal variability in snow accumulation and ice-core interpretations
The analysis of spatial variability in snow accumulation at different sites along the traverse also shows an extremely high variability of snow accumulation at the local (km) scale, particularly for sites with a standard deviation in snow accumulation greater than 10% of the mean value (GPS2, M2, MdPt, D6). Tables 1 and 3 show that snow accumulation variability reaches an order of magnitude in a single core (e.g. M2A and GPS2A). Table 1 and Figure 3 show that snow accumulation variability changes with depth (difference between stakes and Tambora accumulation) and reaches an order of magnitude in a single core. The very high spatial variability in snow accumulation may influence the interpretation of firn-/ice-core records. This is clear when looking at the GPS2A and GPS2B data. GPS2A and GPS2B cores are located along a flowline and the distance between the two core sites is about 5 km (Fig. 1). Snow deposited at GPS2B reaches GPS2A after about 250years (ice velocity 19ma-1; Reference VittuariVittuari and others, 2004). GPR and core analyses reveal (Figs 2 and 3; Table 1) that snow accumulation at site GPS2B is three times higher (137 kg m-2 a-1) than at site GPS2A (54 kg m-2 a-1). A simple one dimensional (1-D) model can be used to calculate past accumulation rates at GPS2A using the snow accumulation rate derived from GPR, the depth-age function of firn cores and ice velocity. The 1-D model allows evaluation of the submergence velocity (or burial rate) of the surface and 'simulation' of the snow accumulation rate at core GPS2A (Fig. 5). We did not take into account layer thinning due to vertical strain, because the ratio of the investigated layer depth (20 m) to the entire ice thickness (>3000 m;Reference Testut, Tabacco, Bianchi and RemyTestut and others, 2000) is <1% and is therefore negligible. Other reasons to neglect strain thinning include the very small strain rates that are present in this part of the ice sheet, and the short duration (~250years) of the records over which to accumulate this strain. The analysis of snow accumulation (stakes, tritium, Tambora, unknown) reveals an increase in accumulation with depth (1965-present: 54 kg m-2 a-1; unknown- Tambora: 161 kg m-2 a-1);'simulation' and present snow accumulation values at GPS2B are very similar, showing that the core variability is due to a spatial variability and not a temporal variability.

Fig. 5. ‘Simulation’ of snow accumulation rate at GPS2A core using snow-radar, ice velocity and core analyses.
Table 3. Spatial variability in surface mass balance from GPR calibrated using accumulation at the main core

Core site D6 is downstream of a field of megadunes with wavelengths of about 2_3 km and amplitudes of 2_4m (Reference Frezzotti, Gandolfi, La Marca and UrbiniFrezzotti and others, 2002a). Accumulation in this area is about 30 kgm_2 a_1, which is too low to allow identification of seasonal signals in the isotope-chemistry stratigraphy of the firn core. A GPR profile 45km west of D6 follows the iceflow direction in the megadune area and reveals the presence of buried megadunes. As for GPS2, the 1-D model (GPR and ice velocity: 1.5 m a_1; Reference VittuariVittuari and others, 2004) can be used to estimate the snow accumulation rate in the megadune area (Fig. 6). The ‘simulated’ accumulation rate shows a periodic variation of about 1500 years, with a standard deviation in the snow accumulation rate of about 28%.

Fig. 6. ‘Simulation’ of snow accumulation rate at D6A core using snow-radar and core analyses.
The sites with <10% standard deviation (31Dpt, D2 and D4) show an increase in accumulation (14-55%) between Tambora-present (1816-1998) and tritium/b-present (1966- 98;Table 1). Also DC shows a clear increase in accumulation from the Tambora marker (average 25.3 ± 1 kgm-2 a-1) to tritium/p (average 28.3±2.4kgm-2a-1) to the stake farm (average 39kgm-2a-1 with a standard deviation of 14kgm-2a-1). With respect to the Tambora marker, stake- farm values show a 30% increase in accumulation during the 1996-99 period. The tritium/p marker also records about a 10% increase. Based on the age-depth scale from the EPICA (European Project for Ice Coring in Antarctica) DC1 core, the accumulation average over the last 5000years is 26.6kgm-2a-1, with a standard deviation of 1.0kgm-2a-1 (Reference Schwander, Jouzel, Hammer, Petit, Udisti and WolffSchwander and others, 2001).
Discussion
The reconstruction of past climates based on ice-core data from areas with high accumulation spatial variability can be distorted. Processes induced by snow accumulation spatial variability that occur mainly in porous snow (depth hoar) under wind crust, such as:
mass exchange by diffusion (isotope),
gaseous re-emission (NO3 -, nssCl- and MSA),
densification, and metamorphic processes (highly recrystallized firn, permeability, grain-size, snow porosity, close-off, total air content, etc.),
may be the source of ice record misinterpretation (e.g. Reference AlleyAlley, 1988; Reference Wolff, Wolff and BalesWolff, 1996; Reference Mulvaney, Wagenbach and WolffMulvaney and others, 1998; Reference Delmotte, Raynaud, Morgan and JouzelDelmotte and others, 1999; Reference Wagnon, Delmas and LegrandWagnon and others, 1999; Reference Traversi, Becagli, Castellano, Largiuni, Udisti, Colacino and GiovannelliTraversi and others, 2000; Reference PropositoProposito and others, 2002).
It is important to consider aeolian processes when selecting optimum sites for firn/ice coring because slope variations of even a few metres per kilometre have a significant impact on winds. As a consequence, a lack of information on local conditions (GPR) can lead to the incorrect definition of climatic conditions based on the interpretation of core stratigraphy alone. Based on our observations, the sites with high standard deviation of spatial variability in snow accumulation (GPS2, M2, MdPt and D6) are not useful in providing information on temporal variations in snow accumulation, because interpretation is very difficult or impossible when the snow originates from different snow accumulation conditions.
At Vostok station, Antarctica, significant oscillations of snow accumulation and snow isotope composition up to 20years and possibly ~102 years have been observed and are interpreted in terms of drift of snow accumulation waves of various scales on the surface of the ice sheet (Reference Ekaykin, Lipenkov, Barkov, Petit and Masson-DelmotteEkaykin and others, 2002). Those authors have observed similar periodicity in the δD profile of the Vostok ice core at different depths.
The Vostok core may contain sections of ice that were once megadunes, and accumulated snow may have also been affected by spatial variability. Based on present ice flow at the Vostok ice core (Reference Bell, Studinger, Tikku, Clarke, Gutner and MeertensBell and others, 2002), the slope change from the flat surface (due to the subglacial lake) to the slope coming from Ridge B occurred at the end of the Last Glacial Maximum (about 20 000years ago). Variations in snow accumulation at that time could then be due to the change in slope and increase in wind-driven sublimation. Reference SiegertSiegert (2003) pointed out that upstream of Vostok lake there is a significant difference between the accumulation rate during the glacial period and the more recent period. Reference UdistiUdisti and others (2004) used stratigraphic correlation between the EPICA Dome C and Vostok ice cores to show the relative variations of snow accumulation over the past 45 kyr. The correlation shows higher variability between glacial and Holocene conditions at DC than at Vostok. They interpret the difference to be due to regional changes in atmospheric circulation with either a negative anomaly in DC or a positive accumulation anomaly in Vostok, or a combination of both.
The Dome C area was chosen for the EPICA deep-drilling project. Deep drilling recently (January 2003) recovered a 3201 m ice core that provides a climate record extending more than 750 kyr (EPICA community members, 2004). The drill site is about 1.4 km east of the present culmination. Our measurements show that the snow accumulation variability is smallest at DC and that over an area of 50 km in diameter (about 2000 km2) the standard deviation in spatial variability (3%) and the difference between maximum and minimum values (12%) are very small.
An 11% increase in accumulation was observed at Talos Dome during the 20th century, while from 1966 to the present there has been a 7% increase with respect to the 800 year average (Reference StenniStenni and others, 2002). The clear increase in accumulation at DC, as indicated by stakes and tritium/p compared to Tambora, is consistent with that observed at other sites in East Antarctica, suggesting a regional-scale phenomenon. Reference StenniStenni and others (2002) found agreement between Talos Dome and DC isotopic profiles, which was attributed to similarly distributed storm tracks and sources of moisture. Recent increases in accumulation have been reported at other Antarctic locations. Reference Pourchet, Pinglot and LoriusPourchet and others (1983) observed a 30% increase in accumulation at 14 Antarctic sites (including Vostok, old Dome C, the South Pole and Ross Ice Shelf) in the period 1960-75 compared to the period 1955-60. This general trend was also observed some years later in the South Pole area, with a 32% increase between 1960 and 1990 (Reference Mosley-ThompsonMosley-Thompson and others, 1995, 1999). At Vostok station, the comparison between a stack of eight sites (six cores and three deep pits) for Tambora marker and nine sites for β marker suggests a slight increase of snow accumulation during the last two centuries (Reference Ekaykin, Lipenkov, Kuz'mina, Petit, Masson-Delmotte and JohnsenEkaykin and others, 2004). Stacked records of δD and snow accumulation for the period 1774-1999 show a 50year cycle. These variations seem to be in phase with the Pacific Decadal Oscillation index, which suggests a teleconnection between central Antarctica and the tropical Pacific (Reference Ekaykin, Lipenkov, Kuz'mina, Petit, Masson-Delmotte and JohnsenEkaykin and others, 2004). In Wilkes Land, Reference Morgan, Goodwin, Etheridge and WookeyMorgan and others (1991) observed a decrease in the accumulation rate from 1955 to 1960, with an increase during the subsequent period. Reference StenniStenni and others (1999) reported no significant accumulation change from a 200 year ice-core record in northern Victoria Land. In Dronning Maud Land (DML), Reference Isaksson, Karlen, Gundestrup, Mayewski, Whitlow and TwicklerIsaksson and others (1996) observed a decrease in accumulation from 1932 to 1991. Reference Oerter, Graf, Wilhelms, Minikin and MillerOerter and others (1999) reported a decrease in accumulation in DML during the 19th century followed by an increase during the 20th century, and these trends were linked to temperature variations derived from stable-isotope records. Reference Mosley-Thompson, Paskievitch, Gow and ThompsonMosley-Thompson and others (1999) suggest that South Pole's recent accumulation increase may be characteristic of the high East Antarctic plateau.
We observed that the increase in accumulation is mainly evident in the central part of the plateau or at dome sites, where the ablation processes have less impact on snow accumulation.
Reference Mosley-ThompsonMosley-Thompson and others (1995) pointed out that the observed increase is not well understood, but that there are several dominant processes that affect snow precipitation (e.g. variability in the sea-ice extent, changes in moisture source regions, frequency, duration and seasonality of cyclonic storms). Reference Bromwich, Guo, Bai and ChenBromwich and others (2004), using atmospheric models (ECT/ERA-15, NCEP2 and DRM) to calculate precipitation over Antarctica from 1979 to 1999, found an upward trend of 1.3-1.7 kg m-2 a-1, which is significant at 95% confidence level for all three datasets. They pointed out that the precipitation increase is consistent with the positive trend in sea-surface temperatures observed in the mid-latitudes of the Southern Ocean over the latter half of 20th century (Reference Casey and CornillonCasey and Cornillon, 2001), this region encompassing the source region of Antarctic precipitation (Reference Delaygue, Masson and JouzelDelaygue and others, 1999). In addition to these effects, wind-driven sublimation processes must be considered as factors affecting the snow accumulation. Wind-driven sublimation processes, controlled by the surface slope in the wind direction, have a huge impact (up to 85% of snow precipitation) on surface mass-balance and are significant in terms of past, present and future surface mass-balance evaluations (Reference FrezzottiFrezzotti and others, 2004). The analysis of a 20 year (1980-2000) surface-temperature record shows a general cooling of the Antarctic continent, warming of the sea-ice zone, and moderate changes over the ocean (Reference DoranDoran and others, 2002; Reference Kwok and ComisoKwok and Comiso, 2002; Reference Torinesi, Fily and GenthonTorinesi and others, 2003). Wind speeds over sloping terrain increase with decreasing temperature; cold temperatures are associated with strong inversions and hence strong gravitational flows (Reference Wendler, Andre, Pettre, Gosink, Parish, Bromwich and StearnsWendler and others, 1993). Cooler temperatures over East Antarctica and warming in sea-ice areas increase the temperature gradient, and the persistence of katabatic winds and associated wind-driven sublimation. The area with speeds less than 6 m s-1 represents about 10% of the surface in the continental-scale simulation of the surface wind field (Reference Parish and BromwichParish and Bromwich, 1991). An increase in snow precipitation coupled with an increase in temperature and/ or wind could increase the surface mass balance only in the inner part of East Antarctica where the wind speed is <6ms-1, whereas it could lead to a decrease in surface mass balance in the windy areas that represent 90% of the Antarctic surface (Reference FrezzottiFrezzotti and others, 2004).
Conclusions
The accumulation/ablation pattern derived from stake-farm measurements, wind crust presence and sastrugi heights, suggests that the local annual noise (metre scale) in snow accumulation can be between ~2 and 4 times the average annual accumulation, with no accumulation or ablation for a 5 year period in up to 40% of cases. The lowest standard deviation value is present where the snow accumulation is the highest and/or where the slope along the prevalent wind direction is low. If we compare the stake-farm measurements to the series derived from stratigraphic core analysis, we observe that the number of gaps of one or more years increases with spatial variability and wind scouring.
At many sites stake-farm and ice-core accumulation rates are observed to differ significantly, but isochrones (GPR) correlate well with ice-core derived accumulation.
The spatial variability of snow accumulation at the kilometre scale is one order of magnitude higher than temporal variability (20-30%) at the multi-decade/secular scale. The reconstruction of past climates based on firn/ice cores drilled in areas with high snow accumulation spatial variability (>10%) will be complicated. In megadune areas the distortion of recordings is characterized by a snow accumulation periodicity of about 1500years. A future intermediate ice core (about 500m deep) downwind of the megadune area could provide information about the periodicity (about seven oscillations) induced by megadunes in deep ice cores. The length of periodic variations due to mesoscale relief and/or megadunes depends on ice velocity and snow accumulation, and can therefore vary in space and time. Nevertheless the length of these periodic variations should be consistent with the use of ice-core accumulation records to study temporal changes in snow accumulation (decade scale). Domes are the preferred sites for studying the temporal variability of climate using firn/ice cores, because interpretation is easier when all the snow originates from the same point on the surface. Ice/firn cores require surveys (snow radar, GPS, etc.) to characterize the site and its geographical/environmental representativeness.
Our results show that wind-driven sublimation has a strong impact on snow accumulation.
Stake measurements and firn cores at Dome C confirm an approximate 30% increase in accumulation over the last two centuries, with respect to the average over the last 5000 years. An increase in accumulation was also observed at other sites where the slope along the prevalent wind direction is small (31Dpt, D2 and D4). Ice-core records from relatively 'high'-slope (>2mkm-1) areas should be avoided because wind processes are very likely to affect them; short- term changes in snow precipitation should thus be studied only in dome areas or at sites undisturbed by winds. Wind- driven ablation greatly affects snow accumulation, and one of the largest sources of uncertainty regarding present and future surface mass-balance calculations is the role of wind- driven sublimation. An increase in snow precipitation coupled with an increase in temperature and/or wind could increase the surface mass balance only in the inner part of East Antarctica where the wind speed is <6 m s-1, whereas it could lead to a decrease in surface mass balance in the windy areas that represent 90% of the Antarctic surface.
Acknowledgements
Research was carried out in the framework of the Project on Glaciology of the Programma Nazionale di Ricerche in Antartide-Ministero Istruzione Universita, Ricerca (PNRA- MIUR) and was financially supported by PNRA through a cooperation agreement with ENEA Roma. This work is a contribution by the Italian branch of the ITASE project and is also supported by the French Polar Institute (IPEV). It is an associate program to the 'European Project for Ice Coring in Antarctica' (EPICA), a joint European Science Foundation/ European Commission scientific program. The authors wish to thank all members of the traverse team, the participants in PNRA 1998/99 who assisted at the Zucchelli station at Terra Nova Bay and Concordia Station and everyone who helped prepare the traverse. Thanks are due to V. Masson-Delmotte, E. Isaksson, M. Fahnestock and G. Hamilton whose comments and editing helped to improve the manuscript.


