


1. Introduction
Camp Century is located immediately south of the main ice-sheet flow divide in Northwest Greenland, at 77.13° N and 61.03° W and ~1906 m WGS84 elevation above sea level, with a local ice thickness of 1390 m (Fig. 1). In comparison to most ice-sheet locations, Camp Century has an unusually rich scientific heritage (see Vandecrux and others, Reference Vandecrux, Colgan, Solgaard, Steffensen and Karlsson2021). Camp Century was constructed as a military base by the US Army Corps of Engineers (USACE) in 1959. It was used continuously for 3 years, and then seasonally, until its abandonment in 1967. The cut-and-cover tunnel network was constructed within the relatively porous near-surface ice-sheet layer known as firn. Faster than expected deformational closure of these firn tunnels was likely a contributing factor in Camp Century's abandonment (Weiss, Reference Weiss2001). The USACE conducted extensive applied glaciological and climatological research during the operational period of Camp Century. This included drilling and analyzing the first ice core to the bed of the Greenland ice sheet (Dansgaard and others, Reference Dansgaard, Johnsen, Møller and Langway1969). This borehole was subsequently re-surveyed throughout the 1970s and 1980s (Gundestrup and others, Reference Gundestrup, Clausen, Hansen and Rand1987, Reference Gundestrup, Dahl-Jensen, Hansen and Kelty1993).

Fig. 1. Ice velocity of the Greenland ice sheet and peripheral glaciers (Solgaard and others, Reference Solgaard2021). The location of Camp Century in Northwest Greenland is shown. The indicated inset is shown in Figure 7. Projection is EPSG:3413.
After the closure of Camp Century, the US Air National Guard continued to use a nearby skiway known as the Greenland Ice Sheet Training Site (GITS). The NASA Program for Arctic Regional Climate Assessment re-initiated intensive glaciological and climatological research activities at GITS in 1993 (Hamilton and Whillans, Reference Hamilton and Whillans2000; Mosley-Thompson and others, Reference Mosley-Thompson2001; Steffen and Box, Reference Steffen and Box2001). Understanding the fate of the subsurface debris field at Camp Century under climate change was a key motivation for the Camp Century Climate Monitoring Programme of the Geological Survey of Denmark and Greenland (GEUS), which was active between 2017 and 2020, and collected a diverse suite of novel ice and climate measurements at the site (Colgan and others, Reference Colgan, Andersen, van As, Box and Gregersen2017; Karlsson and others, Reference Karlsson2019; Vandecrux and others, Reference Vandecrux, Colgan, Solgaard, Steffensen and Karlsson2021). Climate monitoring continues at Camp Century today, with the GEUS Greenland Climate Network (GC-Net) program. By virtue of this history of sustained in situ investigations, Camp Century has a unique record of in situ measurements – including ice flow – stretching back six decades.
Observing ice flow over several decades within the ice-sheet interior can potentially constrain long-term trends in ice-sheet form and flow. Ice-sheet perturbations originating at the ice-sheet margin, such as those associated with Little Ice Age advance or retreat, are believed to propagate as a kinematic wave of adjustment to the main ice flow divide over a centennial timescale (Cuffey and Clow, Reference Cuffey and Clow1997). Ice-sheet perturbations originating in the ice-sheet interior, such as shifting gradients of net accumulation across an ice flow divide, are believed to be associated with significantly longer ice-sheet form and flow response times (van der Veen, Reference van der Veen2001). While Northwest Greenland is known to have experienced some changes in accumulation rate during the Holocene (Dansgaard and others, Reference Dansgaard, Johnsen, Møller and Langway1969), it is also known to have experienced an exceptional ice-margin perturbation associated with the collapse of the Nares Strait Ice Bridge ~10 kaBP (Zreda and others, Reference Zreda, England, Phillips, Elmore and Sharma1999; Bennike and Björck, Reference Bennike and Björck2002).
Based on analysis of the radiostratigraphy of the ice sheet, MacGregor and others (Reference MacGregor2016) inferred that ice velocities in Northwest Greenland have been decelerating since the ice bridge collapse. Based on analysis of temporal trends in the oxygen isotope ratio of the Camp Century ice core, Lecavalier and others (Reference Lecavalier2013) suggested ~300 m of regional ice-sheet thinning following the ice bridge collapse. This is consistent with earlier ice-core analyses suggesting an even larger elevation decrease during the first few millennia of the Holocene (Vinther and others, Reference Vinther2009). After ~4 kaBP, however, this regional ice-sheet thinning has been followed by regional ice-sheet thickening, with ~40 m of ice thickening at Camp Century over the past millennium (Lecavalier and others, Reference Lecavalier2013). As ice velocity is non-linearly dependent on ice thickness, this trend in ice thickness may be expected to influence ice velocity. The rich history of ice flow measurements at Camp Century can therefore potentially provide unique insight into the evolution of ice-sheet form and flow in Northwest Greenland.
2. Previous measurements
Six previous studies have measured the magnitude and azimuth – here defined as degrees relative to true north – of surface ice flow at Camp Century (Table 1; Fig. 2). Between 1963 and 1966, Mock (Reference Mock1968) annually surveyed snow accumulation and ice flow in the vicinity of Camp Century. Mock (Reference Mock1968) measured ice movement using barometric altimetry and simultaneous reciprocal angle measurements of movement stations around Camp Century (Table 2). The relative displacement of these movement stations was ultimately referenced to coastal triangulation stations. This approach appears to have been supplemented with astronomical measurements. Of the four movement stations in the immediate vicinity of Camp Century (ASTRO. STA., MP, P-9B and P-9), we assume that the Mock's (Reference Mock1968) ice velocity summarized in Weertman (Reference Weertman1968) reflects the ASTRO. STA., which is closest to the borehole. We further assume an associated uncertainty of ±1 m a−1 in this velocity, which we regard as generous in comparison to theodolite surveys of ice-sheet markers during the 1960s (Heimes and others, Reference Heimes, Hofmann, Karsten, Nottarp and Stober1986).

Fig. 2. Overview of Camp Century survey positions used in this and previous studies (Table 2). (a, b, c) The Camp Century area is shown at three different spatial scales. Concentric circles indicate the number of ice thickness (H = 1390 m) from the 1969 borehole position. The darker map of Camp Century is the 2017 georeferenced version from Karlsson and others (Reference Karlsson2019). The lighter map has been translated to the estimated 1966 position at the closure of Camp Century (Kovacs, Reference Kovacs1970). Projection is WGS84 UTM20N.
Table 1. Estimates of ice velocity and azimuth at Camp Century in this and previous studies

Start and end dates are given in decimal years.
Table 2. Survey points in the vicinity of Camp Century in this and previous studies

‘*’ indicates a position estimated from a georeferenced map. Survey year indicates the last, or most recent, survey year within the given study.
Between 1966 and 1969, Ueda and Garfield (Reference Ueda and Garfield1968) measured the directional inclination of the Camp Century borehole, from the ice surface to bed. Down borehole tilting rates were converted into deformation rates and then vertically integrated to yield an ice-surface velocity and azimuth at the top of the borehole. This method evidently proved effective in the lowermost ~300 m of the borehole, where most deformation occurs, but was insufficiently sensitive in the near-vertical uppermost ~1100 m of the borehole, where a systematic inclination bias resulted in an overestimation of surface velocity. We adopt the ice flow velocity and azimuth, as well as associated uncertainties, of this repeat survey as summarized in Gundestrup and others (Reference Gundestrup, Clausen, Hansen and Rand1987). A similar 1989 re-measurement of borehole tilt benefited from improved instrumentation, as well as an improved signal-to-noise ratio due to an additional 20 years of deformational borehole tilt (Gundestrup and others, Reference Gundestrup, Dahl-Jensen, Hansen and Kelty1993). This latter survey measured a surface velocity of 3.14 m a−1 but did not provide a specific uncertainty. Based on the uncertainty discussion of Gundestrup and others (Reference Gundestrup, Clausen, Hansen and Rand1987), we assume an associated uncertainty of ±0.30 m a−1 for this survey. This assumption reflects an order-of-magnitude methodological improvement between the 1966 and 1989 borehole surveys, which we regard as reasonable given improvements in signal-to-noise ratio and instrumentation. This latter borehole survey did not estimate the horizontal ice flow azimuth at the ice-sheet surface.
The first measurement of ice flow at Camp Century made using satellite positioning occurred between summer 1977 and summer 1986, when Gundestrup and others (Reference Gundestrup, Clausen, Hansen and Rand1987) performed repeat surveys of the position of the meteorological tower, which was still protruding above the ice-sheet surface at that time. As this satellite survey preceded the advent of the GPS, it most likely employed single-point position solutions, similar to contemporary single-phase GPS solutions, rather than precise point positioning (PPP) solutions. Gundestrup and others (Reference Gundestrup, Clausen, Hansen and Rand1987) report ice flow velocity and azimuth, and their associated uncertainties, over their survey period. Ice flow at Camp Century was then measured between 26 May 1994 and 3 June 1995 via GPS at survey position WP01 by Thomas and others (Reference Thomas2001). Thomas and others (Reference Thomas2001) report ice flow velocity and azimuth, but no associated uncertainties, over their survey period. Members of our author team familiar with the acquisition and processing of these 1990s era GPS data suggest that associated uncertainties of ±0.2 m a−1 and ±2° are appropriate for the Thomas and others (Reference Thomas2001) survey. We omit the contemporaneous (1995–96) ice flow measurement of Hamilton and Whillans (Reference Hamilton and Whillans2000) from our review, as their ice velocity measurement at ‘Camp Century’ actually occurred at the GITS site, which is approximately four ice thickness (4H ≈ 5.5 km) southeast of Camp Century proper.
Finally, ice flow at Camp Century has been most recently estimated by Karlsson and others (Reference Karlsson2019) by georeferencing a map of Camp Century. Karlsson and others (Reference Karlsson2019) estimated that the 2017 position of the meteorological tower was resolved to within ±20 m and compared this position with the historical meteorological tower positions reported by Gundestrup and others (Reference Gundestrup, Clausen, Hansen and Rand1987) to estimate ice flow displacement and direction over the intervening period. Karlsson and others (Reference Karlsson2019) conclude that Camp Century flowed ~232 m WSW between its summer 1959 construction and their summer 2017 radar survey, or 3.9 ± 0.6 m a−1 at 255 ± 2°, over this period. They further suggest that the camp infrastructure has rotated ~4° clockwise since its construction in 1959, although no uncertainty is provided for this rotation.
3. New measurements
GEUS has collected a variety of ice flow measurements at Camp Century between 2017 and 2021 (Colgan and others, Reference Colgan2018). A seven-stake strain network (S1, S2, S3, S4, S5, S6 and S7) was installed and surveyed in the summer of 2017. This strain network circumscribed a perimeter one ice thickness from the present-day midpoint of the subsurface debris field. This strain network was repeatedly surveyed over a 9 d period in summer 2017 using a pair of Trimble R8 integrated antennas and receivers that were temporarily mounted on the central S1 and an outlying skate to collect two-phase GPS observations every 15 s for a period of several hours. An opportunistic re-survey of S5 in spring 2019, using the same GPS equipment, indicated an ice flow of 3.71 ± 0.10 m a−1 with an azimuth of 238 ± 1°, from 22 July 2017 to 10 May 2019. This GPS solution uses high-precision kinematic data processing in GIPSY-OASIS (version 6.4; Christmann and others, Reference Christmann2021). It uses JPL final orbit products, including satellite orbits and clock parameters, and Earth orientation parameters, including antenna phase center offset correction. Atmospheric delay parameters are modeled using the Vienna Mapping Function 1 (VMF1) grid nominals (Boehm and others, Reference Boehm, Werl and Schuh2006). Coordinates are computed in the IGS14 frame (Altamimi and others, Reference Altamimi, Rebischung, Métivier and Collilieux2016).
Unfortunately, aside from this S5 re-survey, logistical challenges prevented a complete re-survey of the entire strain network in 2019. The remaining stakes were subsequently buried by accumulating snow without a post-2017 re-survey. The summer 2017 strain network surveys, however, appear sufficient to resolve the relative movements of the S2, S3 and S4 stakes in comparison to the central S1 stake. The relative movement is calculated using S1 as the overall base station. Two static baselines were calculated with 5–8 d in between and then subtracted to solve millimeter (mm)-scale relative stake movements using RTKLIB v.2.4.3 b34 software and only GPS observables (Takasu, Reference Takasu2021). An elevation mask of 10° was applied and the Saastamoinen (Reference Saastamoinen, Henriksen, Mancini and Chovitz1972) model was used for the troposphere correction. We use these mm-scale relative stake movements to estimate the local mean easting ($\dot{\varepsilon }_x$ ) and northing ($\dot{\varepsilon }_y$
 ) surface strain rates of ice flow at Camp Century as $\dot{\varepsilon }_x$
 = 0.00017 ± 0.00005 a−1 and $\dot{\varepsilon }_y$
 = 0.00017 ± 0.00002 a−1 (Table 3). Here, the associated uncertainty reflects the std dev. in strain rate across the three baselines. We do not use relative movement observations from S5, S6 and S7, as the relative displacement of these stakes is either below the detection limit of our GPS solution (i.e. ≪1 mm over 9 d) or the azimuth is inconsistent with the central S1 station over the 9 d survey period (Fig. 3; Hvidberg and others, Reference Hvidberg, Keller and Gundestrup2002). We suspect that the resting positions of these stakes were disturbed and shifted <5 mm during the multiple mounting and demounting of antennas. The strain network was deployed with the expectation to survey decimeter-scale relative movements over multiple years, not mm- and sub-mm-scale relative movements over multiple days.

Fig. 3. Movements of S2–S7 relative to the absolute movement of S1 over the strain network survey period in summer 2017. Projection is local Cartesian coordinates.
Table 3. Strain network measurements during 9 d in August 2017

Velocity east and velocity north of stakes S2, S3 and S4, as well as the surface strain rate east and surface strain rate north of these stakes relative to stake S1. Distance between each stake and stake S1 is also listed.
A continuously logging PPM2022-S16 GNSS receiver, with NovAtel OEM719 board and NovAtel VEXXIS GNSS-802 peripheral antenna, was installed at CEN-GPS, near the former S1 stake position at the present-day midpoint of the subsurface debris field, in spring 2019. While this five-phase receiver logged both GPS and GLONASS measurements every 15 s, we only consider the GPS measurements here. The electricity for this GPS unit was supplied by a solar- and wind-powered external battery (Fig. 4). The wind generator, however, proved relatively ineffective, and the recorded GPS measurements reflect periods of no data acquisition during polar night. The CEN-GPS station was removed in summer 2021. The velocity was calculated using RTKLIB v.2.4.3 b34 software and the PPP method (Takasu, Reference Takasu2021). The inbuilt RTKLIB ionosphere-free linear combination was applied for ionospheric correction and zenith tropospheric delay was applied for tropospheric correction. International GNSS Service final orbits and clocks were used, with the IGS14 satellite phase center variation file. Daily averaged solutions were calculated in order to estimate the velocity and azimuth. The CEN-GPS measurements indicate an ice flow of 3.62 ± 0.10 m a−1 with an azimuth of 235 ± 1°, over the time span from 10 May 2019 to 2 May 2021. The practical uncertainties in velocity and azimuth that we report for both S5 and CEN-GPS (i.e. ±0.10 m a−1 and ±1°) are about twice the formal uncertainties associated with the GPS processing methodology.

Fig. 4. Multi-phase CEN-GPS station upon installation in spring 2019. The CEN automatic weather station, with single-phase GPS, is visible in the background (photo: Signe B. Andersen).
Finally, the CEN automatic weather station was installed at Camp Century in summer 2017 (Colgan and others, Reference Colgan2018). As is characteristic of all GEUS ice-sheet automatic weather stations, the CEN station includes a single-phase GPS receiver (Fausto and others, Reference Fausto2021). The CEN automatic weather station GPS consists of a U-blox Neo 6P receiver and a peripheral Tallysman TW4020 antenna. We do not consider these single-phase CEN measurements here, however, as they provide little additional insight on local ice flow, in comparison to the contemporaneous multi-phase S5 and CEN-GPS measurements. These CEN automatic weather station GPS position measurements are available at https://doi.org/10.22008/promice/data/aws (Fausto and others, Reference Fausto, Van As and Mankoff2022). The strain network (S1–S7) and CEN-GPS measurements that we present here are available at https://doi.org/10.22008/FK2/DQZIF7 (Colgan and Jakobsen, Reference Colgan and Jakobsen2022).
In addition to GNSS data, we also compile all available satellite and airborne laser altimetry data collected by ICESat-1, NASA Airborne Topographic Mapper (ATM) and ICESat-2 to assess decadal-scale trends in ice-sheet elevation at Camp Century. For ICESat-1 (2003–09) and NASA-ATM (1994–2019) we use the product of Csatho and others (Reference Csatho2014). For ICESat-2 (2018–present) we use the product of Khan and others (Reference Khan2022). Both products, which adopt comparable altimetric corrections, are reported in the WGS84 reference frame for a 500 m × 500 m patch (TS19001381) centered at 77.1825° N and 61.1140° W. Together, these laser altimetry products provide a dense record of ice-sheet surface elevation at Camp Century from 1994 to present that captures considerable temporal variability in ice-sheet elevation at Camp Century (~±45 cm around the 1994–2021 mean; Fig. 5). This temporal variability in elevation clearly results from surface mass balance processes, such as snowfall, melt and firn compaction, which are relatively well-studied at Camp Century (Vandecrux and others, Reference Vandecrux, Colgan, Solgaard, Steffensen and Karlsson2021). There is, however, a significant 1.1 ± 0.3 cm a−1 trend of ice-sheet thickening since 1994 within the altimetry record. There are no empirical means to easily attribute this ice-sheet thickening trend to either ice dynamic or surface mass balance processes.

Fig. 5. Combined NASA Airborne Topographic Mapper (ATM) and ICESat-1 (Csatho and others, Reference Csatho2014) and ICESat-2 (Khan and others, Reference Khan2022) laser altimetry record at Camp Century since 1994. Vertical whiskers indicate elevation uncertainty. The solid line denotes linear best fit (1.1 cm a−1) with 95% Monte Carlo confidence envelope (±0.3 cm a−1). Dashed line denotes fourth-order polynomial best fit to highlight decadal-scale elevation variability.
4. Downstream flowline
As the ultimate ice flow trajectory of the Camp Century debris field is of broad interest to a variety of Greenlandic and Danish stakeholders (Colgan and others, Reference Colgan, Andersen, van As, Box and Gregersen2017; Karlsson and others, Reference Karlsson2019), we use an existing satellite-derived ice velocity product to estimate the ice dynamic flowline extending downstream of Camp Century (cf. Hvidberg and others, Reference Hvidberg2020). This product mosaics all available interferometric synthetic aperture radar (InSAR)-derived ice velocity data during the 1995–2015 period at 250 m spatial resolution (Joughin and others, Reference Joughin, Smith and Howat2017). We initially interpolate ice velocity and azimuth at each of the S1–S7 strain stakes from this mosaic. We then resolve flowlines by iteratively updating downstream strain stake positions, and bilinearly interpolating ice velocity and azimuth, every 10 m downstream, until the flowlines reach the ice-sheet margin.
Using this approach, our downstream projection of the S1–S7 ice dynamic flowlines suggests that the Camp Century subsurface debris field will flow south of the ice flow divide, and ultimately terminate in the vicinity of Innaqqissorsuup Oqquani Sermeq (Gade Gletsjer), a tidewater glacier on the Melville Bay coast. This outlet glacier is located ~100 km east of the island community of Savissivik (Fig. 6). There is little spatial variation in the flowlines originating at S1–S7. These downstream flowlines are all between 103 and 107 km long. The integrated surface-age of these flowlines is between 6420 and 7250 years. The velocity of a subsurface debris field, however, is expected to be slightly slower than surface velocity.

Fig. 6. Ice velocity in Northwest Greenland (Solgaard and others, Reference Solgaard2021). Downstream flowline trajectories from S1 to S7 shown in white. Local ice flow divides shown in black (Mouginot and others, Reference Mouginot2019). Projection is EPSG:3413. Color scale is the same as Figure 1.
5. Velocity trends
We find no evidence of significant trends in observed ice flow velocity or azimuth at Camp Century during the 1977–2021 period of Global Navigation Satellite System (GNSS) positional solutions (Fig. 7). The consensus estimate of ice flow from these four (S5; CEN-GPS; Gundestrup and others, Reference Gundestrup, Clausen, Hansen and Rand1987; Thomas and others, Reference Thomas2001) independent satellite-positioning surveys is 3.65 ± 0.13 m a−1 at 236 ± 2°. Furthermore, we find no significant seasonal increase of summer ice flow in comparison to winter ice flow within the CEN-GPS period of continuous measurement. We estimate summer 2019 (May–September) ice velocity as 3.66 ± 0.10 m a−1, which is not significantly different (+0.04 ± 0.10 m a−1 or +1.1 ± 2.8%) from the May 2019 to May 2021 multi-annual ice flow velocity (Fig. 8). Small, but significant, differences in the ice velocity and azimuth reported between studies likely result not only from methodological differences, but also spatial gradients in ice flow velocity and azimuth in the vicinity of Camp Century. Simply put, the ice flow at Camp Century appears to be stable on seasonal to multi-decadal timescales.

Fig. 7. Ice-surface velocity (a) and azimuth (b) estimated at Camp Century by this and previous studies (Table 1). For each study, horizontal extent depicts the time span and vertical extent depicts the measurement uncertainty.

Fig. 8. Horizontal displacement of the position of CEN-GPS during 2019 shows no significant increase in ice flow during the summer season. Note the brief data gap at the station locations corresponding to polar night. Projection is WGS84 UTM20N.
The constitutive relation between strain rate ($\dot{\varepsilon }$ ) and stress (τ) describing ice flow is non-linear, such that

where A is a creep factor that depends on ice temperature, impurity concentration and crystal structure, and n is the flow law exponent (Hooke, Reference Hooke2005). Here, τ e denotes the effective stress, a scalar invariant of the deviatoric stress tensor and τxz is the vertical shear stress in the direction of ice flow (x). Under the shallow ice assumption, whereby the horizontal extent of an ice parcel under consideration is greater than its thickness, the deviatoric stress tensor may be described as

where ρ is the bulk ice density, g is the gravitational acceleration, z is the ice depth and ∂h/∂x is the ice-surface slope in the direction of ice flow (x). This formulation of the flow law highlights that local surface strain rates are dependent not only on local creep factor, but also non-linearly dependent on local ice thickness. Historically, there has been a theoretical expectation for n ≈ 3 in most ice dynamic settings, with n < 3 along ice flow divides, where the shear stress is relatively low and the velocity depth–profile is more linear (Raymond, Reference Raymond1983; Pettit and Waddington, Reference Pettit and Waddington2003).
Assuming shallow ice-sheet flow at Camp Century, the vertical profile of horizontal velocity v(z) can be approximated as a simple function of flow law parameter (n):

where H is the ice thickness and v s is the ice-surface velocity observed by GNSS. This formulation assumes no basal sliding at the ice–bed interface, which seems reasonable for Camp Century given the prevailing frozen-bed conditions characteristic of the surrounding region (MacGregor and others, Reference MacGregor2022). Under this formulation, the observed vertical profile of horizontal velocity at Camp Century may be characterized as n ≈ 5 flow (Fig. 9). This is qualitatively consistent with ice-sheet, rather than ice-divide flow, and is broadly analogous to the ice flow regime at NEEM (Gillet-Chaulet and others, Reference Gillet-Chaulet, Hindmarsh, Corr, King and Jenkins2011). We believe that Camp Century, specifically CEN-GPS, is located <3 km (~2 ice thickness) south of the present local flow divide. Although Camp Century's precise offset from the flow divide cannot be constrained by presently available in situ observations. The inference of n ≈ 5 flow at Camp Century is also consistent with an emerging empirical expectation of n > 3 flow in most dynamic settings outside ice divides in Greenland (Bons and others, Reference Bons2018).

Fig. 9. Lower-quality 1966–69 vertical profile of horizontal ice velocity measured by Ueda and Garfield (Reference Ueda and Garfield1968) shown with the higher-quality 1966–89 profile measured by Gundestrup and others (Reference Gundestrup, Dahl-Jensen, Hansen and Kelty1993). Consensus estimate of surface velocity from four independent GNSS surveys shown for comparison, along with vertical profile characteristic of different exponents (n) in the constitutive relation between stress and strain describing ice flow (Hooke, Reference Hooke2005). Transition between Holocene and LGP ice types denoted.
Vertical variations in creep factor clearly influence Camp Century's vertical profile of horizontal velocity. Specifically, the presence of relatively soft Last Glacial Period (LGP) ice comprising the bottom ~17% of the ice column, beneath the relatively hard Holocene ice accumulating during our current interglacial, is known to preferentially enhance shear in the deepest ice layers (Gundestrup and others, Reference Gundestrup, Dahl-Jensen, Hansen and Kelty1993; MacGregor and others, Reference MacGregor2016). The LGP–Holocene stratigraphic boundary also evidently influences the velocity profile in other ways. While horizontal ice flow is commonly assumed to be isoazimuthal with depth, meaning that the horizontal ice flow azimuth is constant with depth, Gundestrup and others (Reference Gundestrup, Dahl-Jensen, Hansen and Kelty1993) suggest that ice flow is anisoazimuthal with depth at Camp Century, meaning that the azimuth of horizontal ice flow varies with depth. Specifically, Gundestrup and others (Reference Gundestrup, Dahl-Jensen, Hansen and Kelty1993) observe a > 20° contrast in azimuth across the LGP–Holocene stratigraphic boundary, with LGP ice flow rotated clockwise relative to Holocene ice flow (Fig. 10). In comparison to an earlier analogous azimuth profile surveyed by Ueda and Garfield (Reference Ueda and Garfield1968), Gundestrup and others (Reference Gundestrup, Dahl-Jensen, Hansen and Kelty1993) further speculate that ice flow azimuth may be increasing over time, albeit the data quality of the earlier profile is recognized to be poor. Karlsson and others (Reference Karlsson2019) independently suggest that the Camp Century infrastructure rotated ~4° clockwise between 1959 and 2017. Together, these velocity and azimuth observations highlight that ice flow at Camp Century is likely influenced by continuing evolution of the LGP–Holocene stratigraphic boundary.
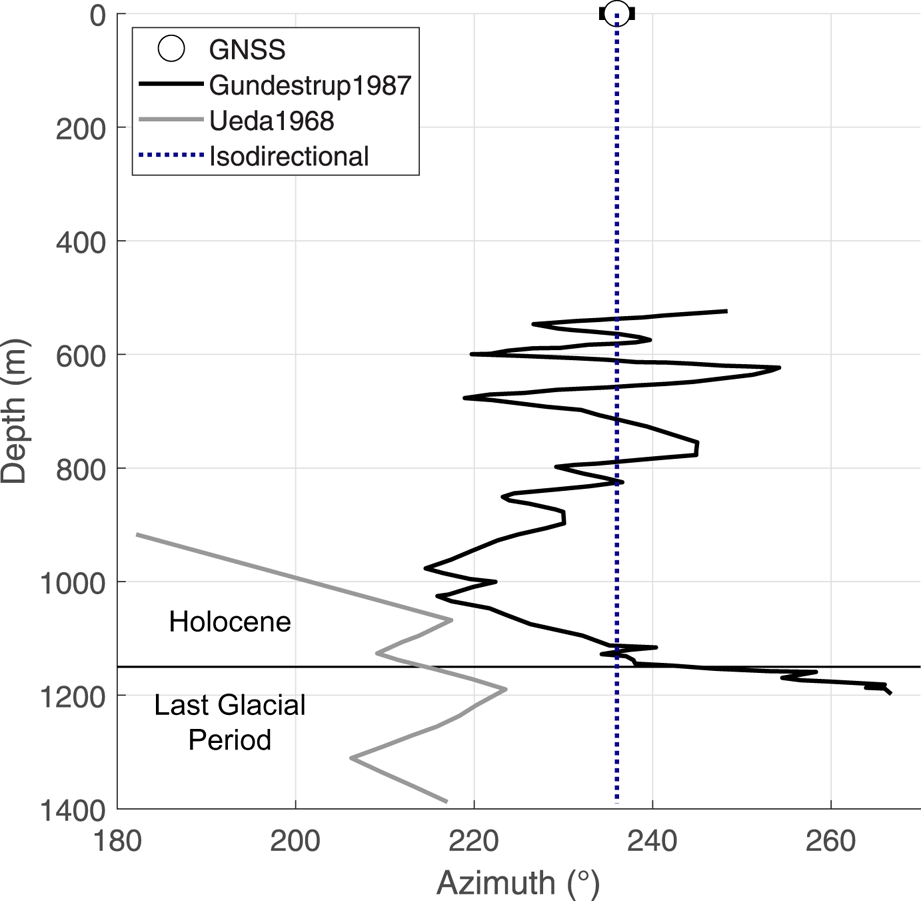
Fig. 10. Lower-quality 1966–69 vertical profile of horizontal ice flow azimuth measured by Ueda and Garfield (Reference Ueda and Garfield1968) shown with the higher-quality 1966–86 profile measured by Gundestrup and others (Reference Gundestrup, Clausen, Hansen and Rand1987). Consensus estimate of surface azimuth from four independent GNSS surveys shown for comparison, along with the expectation for planar ice flow. Transition between Holocene and LGP ice types denoted.
6. Thickness trends
Assuming that our strain network is located at least two ice thickness (2H ≈ 3 km) from the local ice flow divide, we can independently estimate long-term changes in ice-sheet thickness ($\dot{H}$ ) by differencing the horizontal divergence of ice flux (∇Q) inferred by observed surface strain rates with the long-term net accumulation ($\dot{b}$
 ) inferred from previous ice-core analyses (Reeh and Gundestrup, Reference Reeh and Gundestrup1985; Hvidberg and others, Reference Hvidberg, Keller and Gundestrup2002; Burgess and Sharp, Reference Burgess and Sharp2008), according to

where the horizontal divergence of ice flux is related to observed local easting and northing surface strain rates ($\dot{\varepsilon }_x\;$ and $\dot{\varepsilon }_y$
 ) and ice thickness (H = 1390 ± 14 m) as

In this formulation of the shallow ice approximation, v s denotes the surface velocity and ∇H denotes the along-flow gradient in ice thickness. We assume ∇H to be negligible (≈0) within the footprint of the flow divide strain network. F is the ratio between surface and depth-averaged ice velocity. Vertical integration of the measured borehole velocity profile indicates a depth-averaged ice velocity of 2.77 m a−1 (Fig. 9). This suggests F = 0.82 ± 0.06 relative to the ice surface velocity range 3.14–3.65 m a−1.
Under these assumptions, we estimate the present-day horizontal divergence of ice flow at Camp Century to be 0.39 ± 0.09 m a−1 (0.35 ± 0.08 m w.e. a−1). Here, we propagate uncertainty as the quadratic sum of fractional uncertainties associated with the individual terms used to calculate ∇Q. For long-term net accumulation, Buchardt and others (Reference Buchardt, Clausen, Vinther and Dahl-Jensen2012) estimate the 1900–2009 net accumulation at Camp Century to be 0.34 m w.e. a−1. We assume a 5%, or ±0.02 m w.e. a−1, uncertainty in this ice-core-derived estimate of long-term net accumulation. Combining our estimated horizontal divergence of ice flux with this previous estimate of long-term net accumulation suggests that centennial-scale mass balance is within uncertainty of zero, or balance, at Camp Century (−0.01 ± 0.09 m w.e. a−1). The high uncertainty associated with our flux divergence ultimately reflects high fractional uncertainty in measured net surface strain rate (±21%). It is conceivable that this uncertainty could be reduced, through better survey technology and longer temporal baseline, to ±5%. This would detect ice thickness trends of >3 cm a−1.
The local ice-sheet thickening trend inferred by Lecavalier and others (Reference Lecavalier2013) at Camp Century is equivalent to ~4 cm a−1. The post-1994 altimetry record suggests a qualitatively consistent ~1 cm a−1 thickening trend (Fig. 5; Csatho and others, Reference Csatho2014; Khan and others, Reference Khan2022). Temporal variations in this altimetry-observed thickening trend can be explained by recent surface mass balance variability (Shekhar and others, Reference Shekhar, Csathó, Schenk, Roberts and Patra2021). Over longer timescales, shifting spatial gradients in net snow accumulation can influence divide position and ice-sheet form and flow (van der Veen, Reference van der Veen2001). Despite the highly novel analysis and interpretation of oxygen isotopes in the Camp Century ice core, however, an unambiguous accumulation record was not resolved for the site (Dansgaard and others, Reference Dansgaard, Johnsen, Møller and Langway1969). While the Holocene mean accumulation rate has been estimated at Camp Century (Johnsen and others, Reference Johnsen1992), there is presently no knowledge of the centennial or millennial scale variability of accumulation during the Holocene. Holocene variability in ice-sheet thickness in Northwest Greenland, which influenced both orographic precipitation and dynamic thinning of annual layers, makes reconstructing accumulation rates especially challenging at Camp Century (Nielsen and others, Reference Nielsen, Karlsson and Hvidberg2015).
The evolution of local ice thickness at Camp Century will clearly be influenced by the LGP–Holocene stratigraphic boundary for millennia to come. The LGP–Holocene stratigraphic boundary is becoming deeper over time, which is expected to contribute to an ice dynamic thickening and deceleration on millennial timescales (Reeh, Reference Reeh1985; MacGregor and others, Reference MacGregor2016). This downward migration of the LGP–Holocene stratigraphic boundary may contribute to the local ice thickening at Camp Century inferred by Lecavalier and others (Reference Lecavalier2013) over the past millennium. Any deceleration associated with this process, however, is presumably subtle. We estimate the CEN-GPS detection limit for trends in ice velocity to be 0.5% a−1 (or 2 cm a−2). We therefore conclude that it is not possible to directly observe millennial scale trends in ice-sheet flow at Camp Century with the currently available GPS technology and record length. Any more recent centennial trend in ice flow, such as that associated with post-Little Ice Age response, similarly does not appear to exceed the detection limit of the CEN-GPS record.
Finally, Paterson and Reeh (Reference Paterson and Reeh2001) infer decimeter-scale annual thinning in the vicinity of Camp Century based on a comparison of 1954 elevation surveyed by the British North Greenland Expedition (Paterson and Slesser, Reference Paterson and Slesser1956) and a 1995 DEM resolved from satellite altimetry (Bamber and others, Reference Bamber, Ekholm and Krabill2001). Their inference of substantial multi-decadal thinning is not qualitatively consistent with the ice-core reconstruction and contemporary satellite altimetry discussed here. We suggest that the Paterson and Reeh (Reference Paterson and Reeh2001) ice thickness trends have substantial uncertainty associated with the surface-to-volume scattering ratio of the radar-altimetry data used for the 1995 DEM, the geodetic conversion of the 1954 elevations measured relative to sea level to WGS84 ellipsoid height, and also the comparison of 1954 and 1995 measurements that are located up to ‘several kilometers’ apart. We therefore simply note the discrepancy between the ~25 cm a−1 of thinning inferred by Paterson and Reeh (Reference Paterson and Reeh2001) during 1954–94 and the ~1 cm a−1 of thickening that we observe during the subsequent 1994–2021 period. We further suggest that it is unlikely for substantial local thinning to have transitioned to slight local thickening ~1994.
7. Divide migration
The local ice flow divide immediately north of Camp Century is relatively narrow, only approximately half the width of the ice flow divide ~242 km further upstream at NEEM, and may therefore be regarded as more dynamic than an inland divide. By virtue of being constructed as close to the local ice flow divide as possible at the time, Camp Century's downstream ice dynamic flowline is highly sensitive to the local ice flow divide position. Even a modest (~2 km) southern shift in the local flow divide position could initiate the diversion of some Camp Century strain network flowlines north of the flow divide, instead of south of the flow divide. The observation of Karlsson and others (Reference Karlsson2019), that the Camp Century infrastructure rotated ~4° clockwise since construction, qualitatively suggests a decreasing southward component of ice flow at Camp Century over the past six decades. This is consistent with a subtle southward migration of the local ice flow divide. The downstream flowline trajectory presented here should therefore be interpreted with caution over longer timescales.
At present, however, we do not find any evidence of such ice geometry changes and divide migration in the englacial layers in available ice-penetrating radiostratigraphy data. We highlight an Operation IceBridge UHF accumulation radargram acquired roughly perpendicular to the local ice flow divide within 6 km of Camp Century on 9 May 2014 (Fig. 11; Paden and others, Reference Paden, Li, Leuschen, Rodriguez-Morales and Hale2014). While a north–south accumulation-rate gradient is clearly visible in this radargram, with higher accumulation rates south of the divide, the local ice flow divide is effectively wider than any horizontal migration of the divide during this period. The UHF accumulation radar samples englacial layers in the uppermost ~150 m of the ice sheet, which reflects much less than a millennium of accumulation at Camp Century. Radar analyses of the much deeper 11.7 and 14.7 ka englacial layers highlight depth anomalies of these isochrones in the vicinity of Camp Century. These depth anomalies have been attributed to changes in the regional ice flow configuration, possibly associated with the Nares Strait Ice Bridge collapse ~10 kaBP (Nielsen and others, Reference Nielsen, Karlsson and Hvidberg2015; MacGregor and others, Reference MacGregor2016). Collecting a network of GNSS observations with longer spatial and temporal baselines than presented here could potentially resolve any ongoing divide migration at Camp Century (Conway and Rasmussen, Reference Conway and Rasmussen2009).

Fig. 11. Operation IceBridge UHF accumulation radargram acquired within 6 km of Camp Century 9 May 2014 approximately perpendicular to the ice flow divide (Paden and others, Reference Paden, Li, Leuschen, Rodriguez-Morales and Hale2014). Radargram is shown versus elevation (a) and ice depth (b). Inset depicts the locations of the radar profile and Camp Century against ice-sheet elevation.
8. Summary remarks
We have reviewed and extended the unique six-decade record of ice flow measurements at Camp Century. While the velocity measurements reviewed here all pertain to Camp Century, there are clearly significant differences in ice velocity and azimuth over the relatively short distance of one ice thickness from the borehole location. It is therefore important that modern resurveys of historical points re-occupy precise coordinates, or at least restrict comparisons of past and present ice flow to measurements collected within a horizontal distance of one ice thickness from each other.
While different approaches have been used to estimate ice flow at Camp Century, four independent satellite-positioning solutions suggest that there have been no significant changes in ice velocity or azimuth over seasonal to multi-decadal timescales. Any longer-term trends in ice velocity or thickness, such as centennial-scale changes in ice-sheet form and flow, are below the detection limit of our measurements. It is, however, conceivable that improved surveying technology and record length could soon resolve the subtle thickness and velocity trends associated with the downward propagation of the stratigraphic boundary between LGP and Holocene ice types.
This stratigraphic boundary, with relatively softer LGP ice underlying relatively harder Holocene ice, appears to be tremendously important for explaining contemporary ice flow at Camp Century. This includes a vertical profile in horizontal ice velocity that is best approximated by n ≈ 5 ice-sheet flow, as well as a vertical profile of ice flow azimuth that is curiously anisodirectional. The well-documented ice stratigraphy and flow at Camp Century can perhaps be used to inform formulations and parameterizations of ice flow models.
Our analysis of the combined satellite and laser altimetry records suggests a significant 1.1 ± 0.3 cm a−1 trend of ice-sheet thickening at Camp Century since 1994, which is qualitatively consistent with regional millennial-scale thickening previously inferred from ice-core reconstructions. Although there are no empirical means to easily attribute this ice-sheet thickening trend to either ice dynamic or surface mass-balance processes, we speculate that the downward advection of the LGP–Holocene stratigraphic boundary is likely contributing to the local thickening at Camp Century.
Finally, the apparent clockwise rotation of the subsurface debris field at Camp Century provides a qualitative indication that the ice flow divide immediately north of Camp Century may be migrating southward. The reasons for this potential divide migration are poorly understood. Assuming that the position of the local ice flow divide remains stable for the next few millennia, however, downstream flowline trajectories from Camp Century suggest that the sub-surface debris field will likely advect southward toward Melville Bay.
Acknowledgements
The 2017 and 2019 fieldwork of surveying the S1–S7 strain network and installing CEN and CEN-GPS was supported by the Camp Century Climate Monitoring Programme funded by the Danish Ministry of Climate, Energy and Utilities. The 2021 fieldwork removing CEN-GPS and maintaining CEN was supported by the Greenland Climate Network (GC-Net) project also funded by the Danish Ministry of Climate, Energy and Utilities. We thank the Danish Military's Joint Arctic Command (JACO) for embracing the key JACO task of supporting governmental science missions. In particular, we thank Danish Liaison Officers Kim Marchuard Mikkelsen, Jens Alsing and Sigrid Hansen at Thule Air Base, who have supported Camp Century field operations in recent years. We thank two anonymous reviewers whose detailed and insightful comments improved this manuscript, as well as Mathieu Casado (Laboratory for Sciences of Climate and Environment; LSCE) for serving as scientific editor.


 Open access