


1 Introduction
The behavior of dry snow is based on the physical properties of its constituents, ice and air, and on the geometry of the individual particles. The underlying microstructure is the source of the famous beauty of snow grains (Reference LaChapelleLaChapelle, 1969), influencing to a large extent the physical properties, such as the fall velocity in air, the mechanical stability in the snowpack, its densification and other forms of deformation, air and vapor flow, gas adsorption at the ice surface, heat conduction, sound propagation and damping, as well as scattering and propagation of electromagnetic waves, and the grain-size dependence of the snowpack albedo makes snow texture a climate-relevant property. For a critical review, see Reference Arons and ColbeckArons and Colbeck (1995). Thus there is great interest in measuring and modeling the key structural parameters. Since snow is a granular medium close to the melting point of ice, metamorphosis is going on continuously. The lack of stability makes it difficult to develop a simple tool to measure and even to define the key structural properties. A simple and practical method is needed. Among the simple descriptions are grain-size and correlation length, both of which are based on various definitions, isotropic orientation of particles being assumed. Often only one or the other quantity is determined in snow observations. This makes it difficult to compare different datasets and different models. Therefore the quantitative relationship between the different size parameters is of great interest. The present discussion, combining geometrical properties of granular media with empirical relations of optical and microwave properties of snow, is a contribution to the solution of the problem.
Perhaps the first ideas on the subject were expressed by Reference Giddings and LachapelleGiddings and LaChapelle (1961) who noticed that the mean-free path of photons in snow increases with the average grain radius, the average being taken with respect to the surface area. This was the origin of the concept of optical grain-size. The idea was further advocated by Reference Wiscombe and WarrenWiscombe and Warren (1980), Reference Dozier, Davis and PerlaDozier and others (1987) and Reference Grenfell and WarrenGrenfell and Warren (1999).
One difficulty with the concept of grain-size is the fact that grains are described by both their shape and size distribution, leading to complex descriptions in physical models. On the other hand, grains are not always a clear component of snowpacks; often it is difficult to identify boundaries between them. Only the structure of the ice matrix is obvious. Physical properties follow from its geometry without the need to define individual grains. Thin sections of snow samples are able to provide stereological information (Reference GoodGood, 1987); if necessary, it can be related to the size and shape of certain types of grains (Reference UnderwoodUnderwood, 1970). The relevance of stereological relationships for microwave remote sensing of snow was described by Reference Davis and DozierDavis and Dozier (1989), and detailed experimental work was carried out by Reference Wiesmann, Mätzler and WeiseWiesmann and others (1998). Their results led to the Microwave Emission Model of Layered Snowpacks (MEMLS) of Reference Wiesmann and MätzlerWiesmann and Mätzler (1999). The calibration of the model with the experimental data gives quantitative relations with the stereological parameters to be used here.
2 Grain-Size
Maximum extent of prevailing grains
Grain-size was defined by snow hydrologists from the suggestion that the observer obtain “a more or less homogeneous mass of snow and record the average size of its prevailing grains or characteristic grains, the size of the grain or particle being its greatest extension (diameter) measured in millimeters” (Reference ColbeckColbeck and others, 1990; Reference Armstrong, Chang, Rango and JosbergerArmstrong and others, 1993). We call this size D max.
Optical grain-size
To model scattering of sunlight by snow, the snow grains are represented by a cloud of independent ice spheres. The suitable diameter is the equivalent optical grain-size, D o, i.e. the diameter of ice spheres with the same optical properties as the snowpack in question. As mentioned by Reference Wiscombe and WarrenWiscombe and Warren (1980), the idea of optical grain-size dates back to Reference Giddings and LachapelleGiddings and LaChappelle (1961) who speculated that the appropriate grain radius to describe scattering of light is proportional to the volume-to-surface ratio of grains. This was also suggested by Reference Dozier, Davis and PerlaDozier and others (1987), and used by Reference Nolin and DozierNolin and Dozier (2000) to measure grain-size by a remote-sensing method. Reference Grenfell and WarrenGrenfell and Warren (1999) studied the problem in detail. They stated that spheres of equal volume have too little scattering, whereas spheres of equal area have too much volume, giving too much absorption. They found that the problem can be solved if the spheres have the same surface area and the same ice volume, and thus the same mass, as the real ice particles. Non-spherical particles can be represented by a number of identical ice spheres whose surface-area-to-volume ratio q (= S/V i, where S is the total ice–air interface and V i is the total ice volume) is the same as the respective ratio in the real snow. If the number of particles is kept free, this representation is always possible because each snow sample represents a certain mass M, a density ρ and an area S. The definition relates the diameter Dq of the spheres to q by
The q parameter is also related to the specific surface s by
where v = ρ/ρ
i is the volume fraction of ice (ice density ρ
i = 917 kg m−3), and s is defined by s = S/V, with V being the snow volume. Since the grain-surface area is assumed to be ![]() , sintering is not allowed in this model. The result of Reference Grenfell and WarrenGrenfell and Warren (1999) means that
, sintering is not allowed in this model. The result of Reference Grenfell and WarrenGrenfell and Warren (1999) means that
Note that the parameters q, s and v can be determined from snow sections to be produced in cold laboratories from snow samples (Reference Davis and DozierDavis and Dozier, 1989).
3 Correlation Length
There are three equivalent ways to define, and thus to compute, the correlation length p c of dry snow, or of any isotropic two-component granular medium in three dimensions. The information is obtained from snow sections as well.
Slope of the spatial autocorrelation function
The first definition is based on the derivative of the threedimensional, spatial autocorrelation function A(x), with A(0) = 1, and with x being the scalar displacement (Reference Debye, Anderson and BrumbergerDebye and others, 1957):
Secondly, according to Reference Debye, Anderson and BrumbergerDebye and others (1957), p c is related to s and thus to q by
Remark: A slight modification of Equation (5) is observed in a one-dimensional, i.e. a strictly plane-parallel, slab where we have (Reference MätzlerMätzler, 2000)
Intercept length
From the mean intercept lengths in ice L i and in air L a (stereological parameters), we get a third relationship to obtain p c:
This formula results from an expression for s given by Reference Smith and GuttmanSmith and Guttman (1953) used, for example, by Reference AlleyAlley (1980) and Reference Alley, Bolzan and WhillansAlley and others (1982) for the characterization of firn in Antarctica by thin sections:
where N ≫ 1 is the average number of intersections between ice and air (and vice versa) on a randomly selected line of length L ≫ p c.
Exponential correlation function
A reasonable and often good fit to A(x) for granular media is the exponential function
calling p ex the (exponential) correlation length (Reference Debye, Anderson and BrumbergerDebye and others, 1957). This function has been found useful for snow-packs on various occasions (e.g.Reference Vallese and KongVallese and Kong, 1981; Reference Reber, Mätzler and SchandaReber and others, 1987; Reference Wiesmann, Mätzler and WeiseWiesmann and others, 1998). An advantage of the p ex with respect to p c is the smaller error when determined from A(x).Whereas p ex can be fitted over an extended range of x values, p c has to be determined, according to Equation (4), from small changes of A at x → 0. The determination of p c thus depends on the spatial resolution of the available data. Indeed, stereological determination tends to underestimate s and thus to overestimate p c when compared with gas adsorption experiments (Reference Hoff, Gregor, MacKay, Wania and JiaHoff and others, 1998).
Relationship between the different definitions
Definitions (4–6) are equivalent, and for an exponential correlation function we also find p ex = p c. However, experimental tests lead to a slightly different result for p ex (see Equation (10) below).
4 Numerical Relationships from Fitting Simulated and Actual Snow Data
Crocus-MEMLS
Reference Brun, David, Sudul and BrunotBrun and others (1992) introduced a formalism to quantify snow metamorphism, allowing a description of snowpacks with parameters evolving continuously in time, based on meteorological forcing. This work led to the physical snow model, Crocus (Météo Reference FranceFrance, 1996a,Reference Franceb). The snow grains are described by sphericity, dendricity and optical grain-size D o. In Reference Wiesmann, Fierz and MätzlerWiesmann and others (2000), Crocus was coupled to the Microwave Emission Model of Layered Snowpacks (MEMLS) whose texture parameter is the exponential correlation length p ex. The simulated brightness temperatures were compared with observed ones. By relating the Crocus snow types, fresh snow (optical grain diameter D o = 0.1 mm) and snow with faceted crystals (D o = 0.4 mm), to the corresponding values p ex = 0.035 and 0.11 mm, respectively, Reference Wiesmann, Fierz and MätzlerWiesmann and others (2000) obtained a relation between D o and p ex. In addition, by comparing the available snow-pit profiles of known correlation length and computed Crocus data, a better fit was obtained by separating dendritic and non-dendritic snow:
Sntherm–MEMLS
Reference JordanJordan (1990, Reference Jordan1991) published the physical snowpack model Sntherm with the optical grain diameter D o as texture parameter. Assuming a linear relation between p ex and D o, and comparing brightness temperatures from Sntherm–MEMLS profiles with those from snow-pit profiles and observed brightness temperatures, Reference Wiesmann, Fierz and MätzlerWiesmann and others (2000) obtained best results for
Simple model–MEMLS
Reference MätzlerMätzler (2000) found that the optical grain radius corresponds to the mean thickness of ice lamellae in a one-dimensional scattering model. This model extends to the microwave range.When compared with fits to MEMLS in this range, the optical diameter D o of the grains can be related to p ex by:
It may be surprising that the different relationships found here by independent comparisons are so similar. Whereas the result of Equation (9d) coincides with that of Equation (9c) from Sntherm, Equation (9e) is more similar to Equation (9b) of Crocus.
Measured relationship between p c and p ex
Reference AlleyAlley (1980) reported values of s (based on thin-section analysis) for firn–ice-core data of the Antarctic station, Dome C. From these data, p c was determined according to Equations (4–6) and applied to MEMLS (with improved Born Approximation and exponential correlation function according to Reference Mätzler and WiesmannMätzler and Wiesmann (1999)) to compute brightness temperatures. As shown at the Third European Space Agency–SMOS Workshop (http://www.cesbio.ups-tlse.fr/indexsmos.html) by Mätzler, the observations of Dome C from satellite data (Electrically Scanning Microwave Radiometer at 19 GHz) agree with the results of MEMLS if
In an independent study, Equation (10) was confirmed by the analysis of alpine snow samples from Weissfluhjoch, Davos, Switzerland (Reference Wiesmann, Mätzler and WeiseWiesmann and others, 1998; Reference Wiesmann and MätzlerWiesmann and Mätzler, 1999). Both p c and p ex were determined from the measured autocorrelation function (see Table 1). Except for depth hoar, p c is always larger than p ex. The mean ratio p ex/p c is 0.748, with a standard deviation of 0.150. Equation (10) can account for deviations of A(x) from the exponential behavior and for unresolved structures at the given resolution of the thin sections. That the latter effect is not negligible is indicated by the fact that the minimum ratios of p ex/p c are found for samples with the finest structure.
Table 1 Snow-sample data of Weissfluhjoch, adapted and extended from Reference Wiesmann, Mätzler and WeiseWiesmann and others (1998): snow density, snow type, visually estimated grain-size D max , correlation lengths p ex and p c . The data are grouped by snow type and ordered by density. The images in the last column are subsamples of the respective thin sections used to determine p ex and p c , and the sample number in column 1 is used for reference to the microwave data
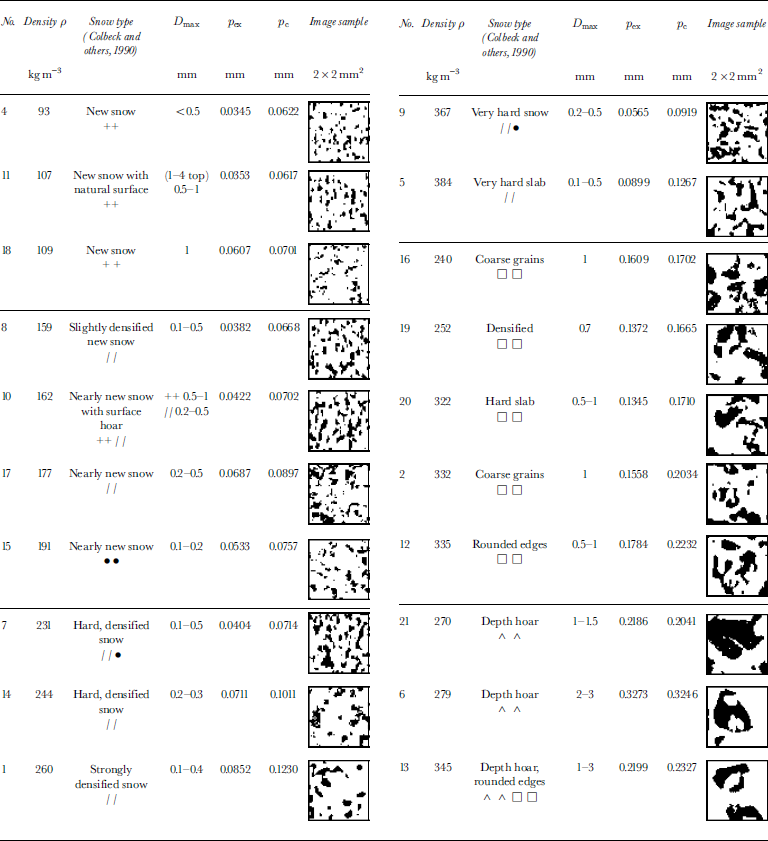
Also shown inTable 1 is the visually observed grain-size D max; it can be seen that this quantity is a very rough estimate, and therefore not suitable for quantitative analysis. Often D max is an order of magnitude larger than p c. This is especially true for fresh snowflakes with complex shape. The behavior is confirmed by Equation (14), shown below, and by the formulas of Table 2.
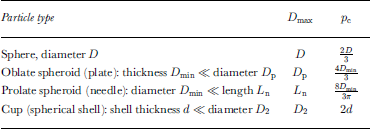
Table 2 Relations between dimensions and correlation length of isotropically distributed particles with free arrangement, according to Reference MätzlerMätzler (1997)
5 Numerical Relationships From Theory
Combining definitions and stereological properties
Eliminating q from Equations (1) and (5), and using Equations (3) and (10), we get
Freely arranged spheres
Assuming freely arranged spheres (Reference MätzlerMätzler, 1997) of constant diameter D, we get for A(x)
According to Equations (4) and (12) we get
Spherical shells and other particle shapes
Other particles of interest are plates, needles, hexagonal dendrites and cups. Whereas plates and needles can be approximated by oblate and prolate spheroids, respectively, dendrites are more complex, but may be obtained from combinations of needle- and plate-like components. Depth hoar, on the other hand, often consists of cup-like grains. Geometrically, such grains are similar to hollow spheres or parts of them, i.e. spherical shells. Expressions for correlation lengths of the proposed approximations to these particle shapes are given in Table 2, based on Reference MätzlerMätzler (1997). For hollow spheres of outer diameter D 2 and shell thickness d, a simple approximation, valid up to 2d ≅ 0.7 D 2, is
This can be seen from Figure 1, showing correlation functions for various values of b = 2d/D 2. According to Equation (4), p c is determined from the tangent to the curves at x = 0. The tangents cross the x axis at p c/d, which is near 2 for all curves, except for the sphere (2d/D 2 = 1). Thus p c only depends on d, but not on D 2 = D max. The same behavior is true for other non-spherical shapes; in general, p c is related to the minimum particle extent (Reference MätzlerMätzler, 1997), and the formulas of Table 2 can be used for estimating p c and the other parameters from visual inspection. It is only for spheres that p c directly depends on D max.
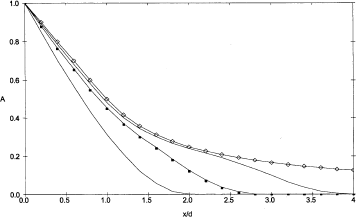
Fig. 1 A(x) of spherical shells of diameter D vs displacement x normalized to shell thickness d for different ratios, b = 2d/D,from top to bottom:b = 0.01, 0.5, 0.7, 1. The bottom curve also corresponds to the full sphere of Equation (12).
6 Discussion
The following order applies among the size parameters:
In the present view where the ice grains are mimicked by equivalent spheres, the second and third inequality of Equation (15) can be exactly related by Equations (11) and (13). The leftmost inequality is based on the empirical formula (10) found in two independent ways. The apparent difference between p ex and p c means that the correlation function is not exactly exponential. The rightmost relation in Equation (15) depends on the actual shape of the grains. An explanation is needed for the relationship between D and D o; by comparing Equations (11) and (13) it follows that
According to the definition of D o in section 2, the equivalent spheres of the optical model are not in direct contact. However, for the spheres, describing A(x) by Equation (12), a fraction s c of the sphere surfaces is in contact with other spheres due to sintering, and thus the surface area is reduced by the factor (1–s c). For freely arranged particles (i.e. a granular medium for which the probability for a given point to be in a granule is equal to v independent of position), we have s c = v (Reference MätzlerMätzler, 1997). In order to allow the same amount of scattering as for non-contacting spheres, the specific surface has to be kept constant; this means that the diameter decreases from D o to D, in correspondence to Equation (16). Thus Equations (11) and (13) are equivalent.
When comparing the empirical relationships (9a–9e) with Equation (11), agreement with ice spheres is possible if different v values are chosen for the different situations; reasonable agreement is found for the Crocus–MEMLS comparison (Equations (9a) and (9b)); then v is in the typical range for snow (0.2–0.4). Higher ice-volume fractions are needed to fulfill Formulas (9c–9e). However, it is more probable that these expressions are due to deviations from the spherical shape. This can be seen from the example of ice shells (Expression (14)), expressing the shell thickness d by the fraction b = 2d/D 2 (with b < 1), thus p c ≅ bD2. Comparing this expression with Equation (16) for D = D 2, and Equations (9c) and (10), we find agreement if
For v = 0.3 we find b = 0.3; this means that the shell thickness is about 30% of the shell radius. Such a deviation from the spherical shape is not unreasonable for depth hoar. The deviation becomes smaller for Expression (9e) and for higher snow density. Finally it should be emphasized that the differences between Expressions (9a–9e) can also be understood to reflect imperfections of the different models.
7 Conclusions
The representation of snow by spherical ice grains whose size is determined by the surface-to-volume requirement of Reference Grenfell and WarrenGrenfell and Warren (1999) is most useful not only for scattering at optical wavelengths, but also in the microwave range because of its relationship with the correlation length; thus this is the most important size parameter of granular media, and it is directly connected to the specific surface s. Processes with interactions at the grain surface are well described by structural information based on these parameters. Therefore grain-size, defined by D o (or equivalently by p ex, p c or D), obtains a physical basis. On the other hand, care has to be taken when the visually determined grain-size (D max) is used, especially for the complex-shaped particles of freshly fallen snow or hoar crystals. Such data may strongly overestimate D o, as shown by Table 1. The problem can be avoided if the particles are mimicked by an appropriate number of spheres to fit the complex shape with the same q value. This leads to the conclusion that the observer’s definition of grain-size as the maximum extent should be revised. The observer should also note the correlation length, or what is equivalent, the size of the minor axis of the prevailing grains (Reference MätzlerMätzler, 1997; Reference Grenfell and WarrenGrenfell and Warren, 1999), or any other related quantity as described here. Table 2 may be used as a practical guide for various particle shapes to relate visible size parameters to p c and further to the other parameters described here. For many situations this measurement can be done in the field using a microscope and a length scale. For particles with extreme axial ratios, for example in case of surface hoar, the visual estimate of the minor axis may not be possible. In such cases p c might be estimated from the surface-to-volume ratio of selected particles, by visually estimating their surface area, and by measuring the diameter of the resulting droplet of the melted particles to get the ice volume, or else by measuring the weight.
The increasing complexity of the task of measuring such quantities under field conditions may call for additional methods. A simple experiment can be done by looking at snow slabs with a portable microwave radiometer. Appropriate calibration data to determine p c exist from Reference Wiesmann, Mätzler and WeiseWiesmann and others (1998). Optimum frequencies with high sensitivity to p c are 40–50 or 80–100 GHz. Due to the strength of interaction of microwaves with snow, the lower and upper frequency range is optimum for sample depths 10–20 and 3–10 cm, respectively. A further method could be based on acoustic transmission experiments (Reference Buser and GoodBuser and Good, 1987), and if the measurement is to be concentrated to the surface of the snow cover, a near-infrared scattering experiment is appropriate (e.g. by measuring the absorption feature of ice at wavelengths around 1 μm (Reference Nolin and DozierNolin and Dozier, 2000)). These experiments are simple enough to work under field conditions. Wave-propagation and radiation measurements may allow for automation. Nevertheless we should not stop perceiving the beauty of snow.
Acknowledgements
It is a pleasure to thank the referees, T. C. Grenfell and R. E. Davis, and the editors, H. Rott and M. Sturm, for their valuable comments on the manuscript; A.W. Nolin and R. L. Armstrong for the inspiring discussion on this topic which started while I was a visiting scientist at the University of Colorado; A. Wiesmann who did most of the work leading to Table 1; and H. Mätzler who has always given me comfort and encouragement along my way.


