


Journal vol. 52, issue 177, pages 318–320, Correspondence from Skvarca and Naruse is reproduced here in full. Corrections have been made to Figures 1, 4 and 5.
A spectacular ice-dam rupture at Glaciar Perito Moreno (GPM), southern Patagonia, which occurred on 14 March 2004, was reported by Reference Chinni and WarrenChinni and Warren (2004). Unfortunately, that correspondence contains little more quantitative, glaciological information concerning the 2004 event than is known by the local people. It also includes some incorrect data and inadequate descriptions relating to the recent event and previous outburst floods during the 20th century. Here, we present a more comprehensive description of the process of ice-dam formation and rupture in 2003/04, and its consequences, with some recently measured field data which may relate to this phenomenon.
In September 2003 a narrow water channel between the GPM front and the opposite bank was completely closed (Fig. 1), thereby blocking the water draining from the southern arm of tributary lakes into Lago Argentino (LA), and ultimately into the Atlantic Ocean. The water level of the Brazo Rico (BR) and Brazo Sur (BS) lacustrine system (Fig. 2) continued to rise by several centimeters per day until March 2004, when it reached its highest level at 9.35 m above normal. Figure 3 shows the rise of water level measured daily at the Bajo de las Sombras (B-S) pier on the northern beach of BR–BS (O. Kloster, unpublished data). On 14 December 2003, the BR–BS water level, measured by conventional survey triangulation with an electronic distance meter (EDM), was 4.2 m higher than in Canal de los Témpanos (CT), the southern arm of LA.

Fig. 1. Geographic setting of Lago Argentino and Glaciar Perito Moreno (from Landsat TM image mosaic).
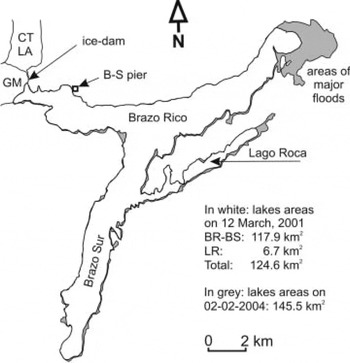
Fig. 2. Map showing the flooded area of the Brazo Rico–Brazo Sur–Lago Roca in early 2004. GM: Glaciar Moreno; CTLA: Canal de los Témpanos, Lago Argentino; B-S pier: Bajo de las Sombras pier.

Fig. 3. Change in water level of the lake Brazo Rico–Brazo Sur (BR–BS) from 1 October 2003 to 26 June 2004. Dates are dd-mm-yy.
Using a Landsat Thematic Mapper (TM) image of 12 March 2001, an area of ~124.6 km2 has been derived for the BR–BS pre-damming extent, including Lago Roca (LR). The lake system BR–BS–LR expanded to ~145.5 km2 on 2 February 2004 (Fig. 2), reaching its maximum extent of ~154 km2 on 11 March 2004, just prior to the outburst. The total volume of water stored in the BR–BS–LR system between 1 October 2003 and 11 March 2004 has been estimated at around 1.0 km3. This is in good agreement with water added to the volume of the main lake’s body after the outburst, obtained by multiplying the area of LA (~1345 km2, measured from Landsat image) by the 0.72 m rise in LA level (Fig. 4), yielding 0.97 km3.

Fig. 4. Variation in Lago Argentino (LA) water level from 1 February to 30 April 2004. Discharge of water stored in the BR–BS–LR system caused the level of LA to rise 0.72 m in 3 days (from noon 12 March to morning 15 March 2004). Dates are dd-mm-yy.
From 11 March onwards, the water started to drain through englacial and/or subglacial water channels enlarging gradually, until the full frontal part of the ice dam (several tens of meters high and several tens of meters wide) almost instantaneously collapsed on the late afternoon of 14 March. Figure 5 shows the water-level drop from 11 to 15 March at BR–BS, measured continuously with a water-pressure gauge set on the southern beach of the lake, combined with daily measurements at the B-S pier.

Fig. 5. Drop of water level of the BR–BS–LR lacustrine system from 11 March to 15 March 2004.
GPM has been in near-steady state during the last halfcentury (Reference Aniya and SkvarcaAniya and Skvarca, 1992; Reference Rott, Stuefer, Siegel, Skvarca and EckstallerRott and others, 1998), which represents ‘abnormal’ behavior compared with a large number of significantly retreating glaciers in Patagonia. At the middle reaches of the glacier, we measured a crossprofile of the glacier surface with an EDM. We have repeatedly measured the profile since 1990 (Reference Naruse, Skvarca, Satow, Takeuchi and NishidaNaruse and others, 1995; Reference Skvarca and NaruseSkvarca and Naruse, 1997), and found that during 1990–99 the glacier was very stable without thickening or thinning. However, between 1999 and 2002 the glacier was found to be thickening (Reference Skvarca, Naruse and De AngelisSkvarca and others, 2004). We believe the thickening trend at the middle reaches in 1999–2002 may have influenced the ice-dam formation in 2003; however, a more detailed mechanism is still unknown.
Water depths around the GPM calving tongue were measured with a hydrographic echo sounder in 1998, and a mean depth of about 90 m was obtained near the front (Reference Skvarca, De Angelis, Naruse, Warren and AniyaSkvarca and others, 2002). The surface profile of the tongue was measured by EDM triangulation in 1999, and the surface heights above the lake ranged from 40 to 70 m, with a mean of about 55 m (Naruse and others, unpublished data). The height above buoyancy, or ice thickness in excess of flotation (Reference Van der VeenVan der Veen, 1996), calculated as h − dpw/pi, was about 45 m before the damming, where h is ice thickness, d water depth, pw water density and pi ice density (900 kg m−3). At the time of the ice-dam rupture, h was 145 m and d was about 99 m. Thus the height above buoyancy was 35 m. Because of heavy undulations in the glacier surface and bedrock topography, it is easily considered that certain points of the ice dam may have been near flotation. This reduction in effective pressure at the bed may have influenced the sudden and rapid drainage of the BR–BS dammed lake.
The outburst that occurred in 2004 did not produce major flooding in the region around LA. However, there is a risk of major floods occurring in the future, which could affect the low-lying areas of El Calafate, a tourist town which is rapidly expanding along the southern coast of LA (Fig. 1). This could occur given a combination of several factors (e.g. the maximum BR–BS level (historically 23.5 m; Reference StueferStuefer, 1999), unusual precipitation and sudden outburst of the marginal lake formed in recent years on the eastern side of Glaciar Upsala (Fig. 1)).
We have several specific difficulties with the correspondence from Reference Chinni and WarrenChinni and Warren (2004), hereafter referred to as C/W. They are:
-
1. C/W state that ‘Between 1917 and 1988 there were 16 closures lasting from months to 3 years’, but later they refer to ‘a quasi-cyclic 4 year pattern’ and ‘the well-established 4 year cycle’. This statement is misleading because the cyclic or quasi-cyclic events occurred only between 1960 and 1988, and (as far as we are aware from the available literature and other documentation) no cyclic events were observed prior to 1960.
-
2. C/W describe ‘this long-maintained stability during a century’ for GPM. However, later they conclude there has been a ‘cessation of the cycle during the 1990s, combined with indications of negative net mass balance’. We consider it significant that C/W mention the negative mass balance for GPM, because this statement seems erroneous. The retreat of most of the glaciers of Hielo Patagónico Sur (s{}uthern Patagonia icefield) is well known and described elsewhere (Reference Aniya, Sato, Naruse, Skvarca and CasassaAniya and others, 1997; Reference Rignot, Rivera and CasassaRignot and others, 2003). However, GPM is an exception, behaving in near-steady state during most of the 20th century. The glacier was even in an advanced position in 1986, compared with the full period 1947–86 (Reference Aniya and SkvarcaAniya and Skvarca, 1992). Furthermore, recent (unpublished) analysis of 12 sequential Landsat TM images and three aerial photographs covering the period 1947–2005 reveals that since early 1947 this glacier reached its maximum position on 16 January 2004, i.e. only a few months before the ice-dam collapse, with a net advance of +1.2 km2. Extended analysis with satellite images to 19 February 2005 indicates an aerial loss of 0.4 km2 from 2004 to 2005, yielding a slightly lower net advance of +0.8 km2 for the last 58 years.
-
3. The ice dam was already formed in September 2003 (personal communication from H. Svetaz, 2003) when GPM overrode the opposite bank, impeding the water flow into CT; therefore the water level in BR–BS began rising much earlier than November (as reported by C/W) (see also Fig. 3).
-
4. As shown in Figure 3, between 1 October 2003 and 11 March 2004, the mean rate of lake level rise was +0.06 m d−1, with a maximum of +0.15 m d−1 measured on 1 March 2004. A period of higher rate (+0.12 m d−1) extended only between 21 February and 2 March. By late February the level of BR–BS had risen over 8.0 m, not 6.0 m as reported by C/W, and it reached a maximum height of 9.35 m, not 10.5 m as reported by C/W.
-
5. The water level of LA never ‘rose by as much as 4.5 m’ due to this outburst. With a rise of this amount, much larger areas of LA shores would be flooded and most of the present inhabited lower flat zones of El Calafate town would be under water. According to available data (personal communication from Sub-secretaría de Recursos Hídricos, 2004), the level of the main body of LA rose from 185.6 m a.s.l. on 1 February 2004 to 187.16 m a.s.l. on 15 March 2004 (Fig. 4), i.e. 4 days after the outburst on 11 March. The same data reveal that the outburst caused the LA level to rise by only 0.72 m between noon on 12 March and morning on 15 March. To raise the LA level by 4.5 m would require about six times more water than was accumulated in the BR–BS–LR lake complex. This is not possible because such a high level of water would overflow the ice dam or drain over the lowland on the northeastern side of BR into LA (Fig. 2). Thus, the 2004 outburst did not cause any serious flooding of the regions surrounding LA, as implied by the title of C/W.
Acknowledgements
We thank K. Satow and E. Isenko for collaboration in the fieldwork during the summer of 2003/04, and Compañía Hielo y Aventura, Prefectura Naval Argentina, Parque Nacional Los Glaciares and all their staff for efficient logistic support during many field campaigns carried out at Glaciar Perito Moreno from November 1990 to April 2004. Thanks are also due to Comisión Nacional de Actividades Espaciales (CONAE) for providing the Landsat images used in this study, to O. Kloster, B. Roil and H. Svetaz for providing valuable information, and H. Sala for helpful assistance in computing and producing the figures. We thank an anonymous reviewer and the scientific editor, J. Jacka, for useful comments.
8 February 2006


