


Introduction
Most of the non-ice-sheet-type glaciers on Earth have receded during the 20th century (Reference Shi and ChengShi and Cheng, 1991; Reference Dyurgerov and MeierDyurgerov and Meier, 2000). Alpine glaciers, especially those in temperate zones, are regarded as one of the best natural indicators of climate change (Reference HoughtonHoughton and others, 2001), including their contribution to eustatic sea-level rise (Reference MeierMeier, 1984). Hence the need for detailed global monitoring of glaciers (Reference OerlemansOerlemans, 1994; Reference Haeberli, Frauenfelder, Hoelzle and MaischHaeberli and others, 1999).
Many researchers have focused on alpine glacier variations in the southern Tibetan Plateau/western Himalaya during the last few decades (e.g. Reference Mayewski and JeschkeMayewski and Jeschke, 1979; Reference MillerMiller, 1984; Reference BishopBishop and others, 2004), yet little is known about glacier variations in the central Tibetan Plateau. Results have been published from only a few locations (Reference Liu, Shen, Sun and LiLiu and others, 2002; Reference Lu, Yao, Liu, Ding and LiLu and others, 2002). The headwaters of many great rivers, including the Yangtze and Yellow Rivers, are located in the Tibetan Plateau and are economically important downstream. It is essential and urgent for us to monitor glacier variations within the entire Tibetan Plateau.
Geladandong mountain, the highest peak in the Tanggula Mountains, with an elevation of 6621 ma.s.l., is located in the central Tibetan Plateau (Fig. 1). The Tanggula Mountains serve as a geographical boundary between the continental climate and the summer Indian monsoon over the Tibetan Plateau (Reference Zheng and ZhuZheng and Zhu, 2003). The north is subject to continental air masses, whereas the south is influenced by air masses from the summer monsoon. The two air masses meet between 32° and 34° N. The headwaters of the Yangtze River are located in the Geladandong mountain region (33°02’-33°41’N, 90°42’-91°41’E). In this paper, we use three series of Landsat images from various periods to study glacier variations in the Geladandong mountain region.
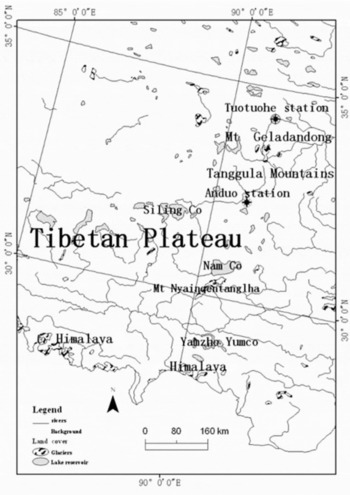
Fig. 1. Location map around Geladandong mountain in the central Tibetan Plateau.
Because of the large number and remoteness of most alpine glaciers, satellite-based remote-sensing techniques, including microwave data and optical imagery, have commonly been used in global-scale surveys. Landsat imagery, including the Landsat Multispectral Scanner (MSS; images of four spectral bands in the visible/near-infrared (VNIR) parts, with a pixel resolution of 79 m), the Landsat Thematic Mapper (TM; images of seven spectral bands from the visible to the thermal-infrared parts with 28.5m pixel resolution in the VNIR) and the Landsat Enhanced Thematic Mapper Plus (ETM+;images of eight discrete spectral bands with a 14.25m pixel resolution in the panchromatic band), has been one of the primary data sources for glaciological research (Reference Bindschadler, Dowdeswell, Hall and WintherBindschadler and others, 2001; R.S. Williams, Jr and J.G. Ferrigno, http://pubs.usgs.gov/fs/2005/3056/fs2005-3056.pdf). Landsat data have provided glacier information in remote areas since the beginning of the series in 1972 (Reference Meier, Freden, Mercanti and WittenMeier, 1973). In this work, glacier variations have been measured using a series of digital images since 1973, including Landsat MSS in 1973 and 1976 (1973–76, i.e. mosaic image from 1973 and 1976 to cover the entire Geladandong mountain region), TM in 1992 and ETM+ in 2002 (Table 1). The 2002 ETM+ is a scene with a slight snow cover that could be distinguished easily from the glaciers in the false-color image (RGB: 432). The 1992 and 1973–76 images are free of snow cover. The geometric resolution of optical bands of Landsat imagery in 2002 was improved by data fusion, using the 14.25m panchromatic band of ETM+, so that glacier interpretation could be improved.
Table 1. Landsat (MSS, TM and ETM+) data used in this work
We also use topographic maps at 1 : 100 000 (with about ±100m accuracy), which were compiled from snow-free aerial photographs taken in November 1969. The map area was surveyed and mapped by the State Bureau of Surveying and Mapping in China in June 1974.
The multispectral classification methods for glacier delineation with Landsat TM data include manual digitization, normalized difference snow index (Reference Silverio and JaquetSilverio and Jaquet, 2005), spectral-band ratio, and unsupervised and supervised classification techniques (Reference Hall and MartinecHall and Martinec, 1985; Reference Paul, Kääb, Maisch, Kellenberger and HaeberliPaul and others, 2002; GLIMS Algorithm Working Group, www.geo.unizh.ch/~-kaeaeb/glims/algor.html#Anchor-23240). Although on-screen digitizing by manual delineation of glacier ice is very time-consuming and laborintensive, it is still widely used (Reference Williams, Hall and ChienWilliams and others, 1997; Reference Raup, Kieffer, Hare and KargelRaup and others, 2000; Reference Khalsa, Dyurgerov, Khromova, Raup and BarryKhalsa and others, 2004; Reference Khromova, Osipova, Tsvetkov, Dyurgerov and BarryKhromova and others, 2006), especially when the analyst knows the area well and is knowledgeable about its glaciers. Reference Aizen, Kuzmichenok, Surazakov and AizenAizen and others (2006), for example, studied glacier changes in the central and northern Tien Shan and achieved maximum accuracy for the glacier boundaries by manually digitizing false-color composites of VNIR bands. For debris-covered glaciers, many semi-automatic methods have been utilized in recent years (for example Reference Paul, Huggel and KääbPaul and others, 2004; Reference Silverio and JaquetSilverio and Jaquet, 2005).
The very low reflectance of ice and snow in the middle infrared has been widely used for glacier classification, for example with threshold ratio images from raw data of digital number of TM bands 4 and 5 (Reference Bayr, Hall and KovalickBayr and others, 1994; Reference Jacobs, Simms and SimmsJacobs and others, 1997; Reference PaulPaul, 2001). This technique has proved to be simple, robust and accurate (Reference Paul, Kääb, Maisch, Kellenberger and HaeberliPaul and others, 2002). It has also been proposed as a method for reducing multiple effects (e.g. the topographic effect of direct light) within multispectral data (Reference Kriegler, Malila, Nalepka and RichardsonKriegler and others, 1969; Reference CraneCrane, 1971; Reference Vincent and AnsonVincent, 1973; Reference HolbenHolben, 1981). However, data adjustments (e.g. compensation for data offsets prior to ratio) should be considered an essential part of the band-ratioing process, especially for scenes containing deep shadow (Reference CrippenCrippen, 1988). The data offsets inherent in the band data can affect results of the ratio image. As we do not know the suitable offsets for the adjustment, we use images that result from subtracting band 5 from band 4 (TM4 – TM5) to discern the glacierized areas, including termini of individual glaciers, in the Geladandong mountain region after orthorectification and co-registration of all image scenes acquired on different dates. Orthorectification by digital elevation model (DEM) applications is employed to eliminate the effects of perspective distortion and to reduce the topographic effect on remotely sensed data (Reference Justice, Wharton and HolbenJustice and others, 1981; Reference KääbKääb, 2002, Reference Kääb2005).
Methodology
DEM data
The multitemporal and multi-source datasets must be accurately co-registered and orthorectified, using a DEM, before calculating glacier area changes based on pixels. Thus, DEM evaluation has to be carried out first. For the study site, we have DEM data at the 1 : 250000 scale (DEM25), which were created by contour digitization and interpolation from the 1 : 250000 topographic map compiled by the State Bureau of Surveying and Mapping in China. The DEM cell size is 100 m, and its co-registered error to the topographic map of 1969 is within 100 m.
The height accuracy of the basic DEM data was evaluated by calibrating 160 elevation check points on the 1 : 100 000 1969 topographic maps, with the corresponding elevation values for the same locations from the terrain data before orthorectification of the sequential satellite imagery. We obtained an average deviation of the elevations of 32.85 m, and a standard deviation of the elevation differences of 45.22 m, with reference to the 1 : 100 000 topographic map. The root-mean-square error (rmse) of vertical deviations for DEM25 (Reference Stevens, Garbeil and Mouginis-MarkStevens and others, 2004) is ±54.42 m, with maximum vertical deviations of –167 and +72 m. We used the DEM25 for orthorectification of the three sets of Landsat images. The digital images we used were converted from disparate sources to a common format defined in Arc/Info Grid with transverse Mercator projection and Krasovsky 1940 spheroid. Co-registration for all orthoimages is based on the 1 : 100 000 topographic map (which is used as the common ‘base’), and the co-registered errors are within 0.5 pixel (Table 2).
Table 2. Errors in co-registration of satellite images to the 1: 100 000 topographic map of the Geladandong mountain region
Delineation of glaciers and detection of variation
The study of glacier variations depends mainly on the delineation of the glaciers from sequential, co-registered orthorectified images. We know, both from field surveys in October 2005 and from the series of Landsat images, that there are no debris-covered glaciers in this region. A classification scheme was used in which non-glacierized areas were assigned a single-digit value of 5, and glacier areas were assigned a single-digit value of 7. Glaciers are mapped from Landsat TM and ETM+ images of 1992 and 2002, by unsupervised classification of imagery from band arithmetic (TM4 – TM5). Glaciers from Landsat MSS images of 1973–76 are mapped by unsupervised classification from false-color composite images which were constructed using MSS bands 4, 2 and 1 (i.e. RGB: 421). All results were resampled to the same 28.5m gridcell resolution, and some snow-covered, non-glacierized areas were eliminated by filter methods and manual editing. Classification accuracy for glacier delineations depends not only on the pixel resolution but also on the season when the imagery is taken. Although the image derived from spectral-band-algebraic operation (TM4 – TM5) works well for snow and ice, manual corrections are also required. The classification results of each individual image are more accurate if glaciological and field survey knowledge is applied to the glacier interpretation, as was done by Reference Williams, Hall and ChienWilliams and others (1997) on Vatnajökull, Iceland.
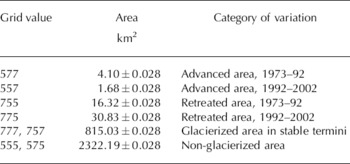
The classification scheme facilitated the algebraic operations in the Arc/Info Grid module. The one-digit value (i.e. 5 or 7) from each gridcell was integrated over the three images (1973–76, 1992 and 2002) by map algebra to generate a spatial-temporal integrated dataset with a three-digit value in each gridcell that simulated glacier change during the period 1973–2002 (Fig. 2). This hybrid-grid method enables us to track glacier variations during the corresponding period both on maps and in tables (Reference Ye, Yao, Kang, Chen and WangYe and others, 2006). Instances in which gridcells indicated changes that occurred more rapidly than was considered feasible (575, 757, etc.) were rejected as ‘noise’. These may be caused by false information or changes outside the expected range, such as different data sources or seasonal differences in snow cover in non-glacierized areas. The three-digit value from each gridcell was used to identify areas of glacier advance where non-glacierized areas became glacier areas, and areas of glacier retreat where glacier areas became non-glacierized during different periods (Reference Ye, Yao, Kang, Chen and WangYe and others, 2006). These regions could be identified from the map (Fig. 2).
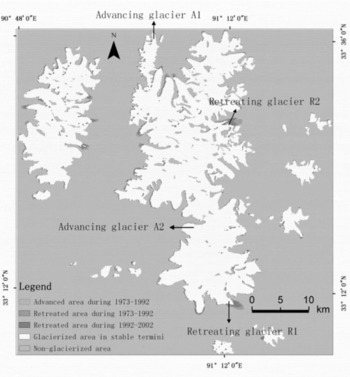
Fig. 2. Glacier variations in the Geladandong mountain region during 1973–2002.
Glacier retreat is evident at the glacier terminus or from changes in glacier geometry (nunataks) which result in separate flowlines (Reference Paul, Huggel and KääbPaul and others, 2004). Length changes were derived from the average, over three measurements, of the difference in glacier tongue positions between the glacier outline in the 1969 topographic map and individual images along the central flowline. The Earth Resource Data Analysis System (ERDAS) measurement software tool was used.
Accuracy of measurements
The measurement accuracy of the position of the glacier front is limited by the sensor resolution (Reference Williams, Hall and ChienWilliams and others, 1997) and co-registration error (Reference Hall, Bayr, Schöner, Bindschadler and ChienHall and others, 2003; Reference Silverio and JaquetSilverio and Jaquet, 2005). Since glacier variations are determined by values of the integrated grids (Fig. 2; Table 3) from the three digital images (from 1973–76, 1992 and 2002) together, the errors of co-registration to the 1969 topographic base map (with pixel resolution 100 m) play a very important role (equal to that of the sensor resolution) in the measurement. According to Reference Williams, Hall and ChienWilliams and others (1997), Reference Hall, Bayr, Schöner, Bindschadler and ChienHall and others (2003) and Reference Silverio and JaquetSilverio and Jaquet (2005), for multitemporal measures of glacier-front position using satellite images, each position has an uncertainty that can be calculated by
Table 3. Glacier variation during 1973–2002 in the Geladandong mountain region
where U T is the measurement uncertainty of the glacier terminus, λ is the original pixel resolution of each individual image and ε is the registration error of each individual image to the 1969 topographic map.
In our case, according to the above equation, glacier terminus measurement uncertainty is 148, 115, 111, 99 and 46m between each pair of datasets (i.e. 1969–73, 1969–92, 1969–2002, 1973–92, 1992–2002), respectively. The total U T among three images was 90m during 1973–2002, and among four images was 156m during 1969–2002.
Measurement accuracy of the glacier area from individual spatial data is also limited by the sensor resolution. According to Reference Hall, Bayr, Schöner, Bindschadler and ChienHall and others (2003), the measurement uncertainty in glacier area (UA) from images can be obtained using
The area accuracy in any one individual digital image can be expressed as
where U M is the area uncertainty of the spatial data (digital image, topographic map, etc.). Uncertainties in the glacierized area in our case are shown in Table 4.
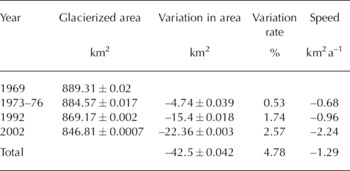
Table 4. Glacier area in different periods in the Geladandong mountain region
As the co-registration error also plays an important role in variation measurement between datasets, we included the registration error in the area accuracy calculation. Thus, changes in the area extent of a glacier during 1969–2002 with four spatial datasets were measured with an accuracy of ±0.042 km2 using
In our case:
In the same way, the total measurement uncertainty in glacier area during 1973–2002 among the three digital images was ±0.028 km2. All area variation uncertainties are shown in Tables 3 and 4.
Results
Values of the integrated grid from the three digital images (Fig. 2; Table 3) show that, while some glaciers in the Geladandong mountain region advanced during 1973–2002, others retreated. The area of glacier recession was much larger than that of glacier advance (Table 3). We also see that the areas of glacier advance decrease while the areas of glacier retreat increase through the time period.
From calculation of glacier area derived from classification of digital images, and from the 1969 topographic map, we determine that total glacier recession from 1969 to 2002 was ~43km2. The glacierized area in the Geladandong mountain region, from the 1969 map, was 889km2; the image mosaic of 1973 and 1976 indicated it decreased to 885km2 (Table 4). Glacier area decreased by 22km2 (i.e. 2.2km2 a–1) during 1992–2002, compared to 15.4km2 (1.0 km2 a–1) during 1973–92, and 4.7 km2 (0.7 km2 a–1) during 1969–73 (Table 4; Fig. 2). The area recession rate in Table 4 indicates that glacier retreat has accelerated in recent years.
The recession rates of some glacier termini in the Geladandong mountain region have also increased. For example, the terminus retreat of glacier R1, located in the south of the region (Fig. 2), was 983 ± 115m from 1969 to 1992, an average retreat rate of 43ma–1, while it was 2018 ± 111m from 1969 to 2002 a retreat rate of 61 m a–1 (Fig. 3a and c). This indicates that the glacier tongue retreated 1035 ± 46m during 1992–2002 (104m a–1). Similarly, the tongue of glacier R2, located in the northeast of the region (Fig. 2), retreated 1740± 115m (76m a–1) during 1969–92, while it retreated 2543 ± 111m (77m a–1) during 1969–2002 (Fig. 3b and d). This suggests the tongue retreated 803 ± 46m (80 m a–1) during 1992–2002. Thus, glacier recession has accelerated in recent years. This is the major characteristic of glaciers in the study area during 1969–2002.
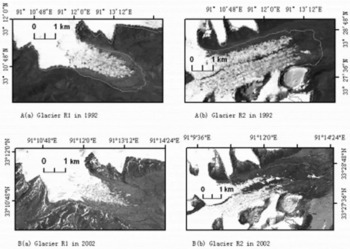
Fig. 3. Areas of retreating glaciers compared to the glacier extents on the 1969 topographic map. (a) Glacier R1 in 1992 Landsat TM image (bands 4, 3 and 2). (b) Glacier R2 in 1992 Landsat TM image (bands 4, 3 and 2). (c) Glacier R1 in 2002 Landsat ETM+ image (pansharpened with band 8). (d) Glacier R2 in 2002 Landsat ETM+ image (pansharpened with band 8).
Meanwhile, other glaciers in the Geladandong mountain region advanced 4.1 ± 0.028 km2 in total during 1973–92 and 1.68 ± 0.028km2 during 1992–2002 (Table 3). Glacier A1, which is located in the northern part of the region (Fig. 2), advanced 535 ± 115m (23 m a–1) during 1969–92, and 607 ± 111m (18 km2 a–1) during 1969–2002 (Fig. 4). Thus, the terminus advanced 72 ± 46m (6ma–1) during 1992–2002, much slower than in the previous period. The tongue of glacier A2, which is located in the southwestern part of the area (Fig. 2), advanced 311 ± 115m (14m a–1) during 1969–92; its advance could not be detected using Landsat TM/ETM+ imagery during 1992–2002 (Fig. 2). Advancing glaciers are generally located in the northern and western parts of the region, while glacier retreat dominates in the southern and eastern parts (Fig. 2).
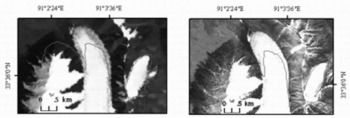
Fig. 4. Areas of advancing glacier A1 compared to its extent on the 1969 topographic map. (a) 1992 Landsat TM image (bands 4, 3 and 2). (b) 2002 Landsat ETM+ image (pansharpened with band 8).
Discussion
Misclassifications from individual images
Availability of cloud-free, end-of-ablation-period satellite scenes with appropriate glacier mapping conditions (cloud-and snow-free) is limited. Glacier monitoring by means of optical sensors is hampered by frequent cloud cover or perennial snowfields that are attached to some glaciers (Reference Williams, Hall and ChienWilliams and others, 1997). Because glacier and snow cover vary during different seasons, it is difficult to delineate glaciers from surrounding snowpack (the snow-covered, non-glacierized area) with only spectral characteristics of individual satellite images. Local knowledge gained from experience in the field (e.g. Reference Williams, Hall and ChienWilliams and others, 1997) is very advantageous. In addition, some misclassifications can exist among sequential images due to different observation times, pixel resolutions and data sources.
The misclassification of non-glacierized areas as glacier areas in the earlier maps/images resulted in an overestimate of glacier retreat during the corresponding period. For example, the smaller remaining ‘noise’ (small red areas in Fig. 2) comes from some non-glacierized areas surrounded by glacier areas (e.g. high mountain rock ridges, steep mountain peaks) which are misidentified as glacierized areas on earlier images (e.g. the 1992 image). They are however, correctly identified as non-glacierized areas on the 2002 image. Similarly, the misclassification of non-glacierized areas as glacier areas in the later images resulted in an overestimate of glacier advance during the corresponding period. The blue area in Figure 2, for example, is marked as ‘advancing’ during 1973–92. Some of the blue, however, does not occur at glacier termini, and cannot be regarded as advancing.
The hybrid-grid method enables the ‘noise’ to be identified both in spatial characteristics (Fig. 2) and in value (Table 3), which effectively improves the accuracy in detecting areas of glacier retreat and advance. We can reclassify the misclassified gridcells (Table 3), if there is an agreement with at least two other images (757, 575, etc.). The rules for reclassification are very important for detection and elimination of discrepancies in the hybrid grid. We will discuss the ‘noise’ between various data sources elsewhere. Meanwhile, we can further improve the accuracy of our results by utilizing the knowledge of glaciologists to correctly identify certain areas as glacierized or non-glacierized in the hybrid grid and work to verify the problematic areas with future field surveys.
Uncertainties of measurement
The uncertainties in area and length measurements can be considerable when comparing satellite data with topographic maps. Uncertainties have reduced with time, however, as pixel resolution of satellite images has improved, as shown by Reference Hall, Bayr, Schöner, Bindschadler and ChienHall and others (2003) who considered the errors inherent in mapping historical glacier positions in Austria from the ground and space. The equations that we use to calculate uncertainties need to be improved. First, the error in registration to the topographic base map is limited, to some extent, by the pixel resolution. Thus, the registration error and pixel resolution are not independent of each other, and their relationship in the measurement should be considered when calculating the uncertainties. Second, in the hybrid-grid development of each of the three images (1973–76, 1992 and 2002) based on a unified pixel resolution, the errors in co-registering to the 1969 topographic base map are not always enlarged by equal weight. The larger registration error image may play a more important role than the smaller registration error image in the measurement of uncertainties for the hybrid grid. Third, much of the mismatched and misclassified information between individual images can be detected and eliminated in the integrated grid (pixel size is 28.5 m). The hybrid and the reclassification of gridcells could reduce the measurement uncertainty to some extent (e.g. 575, 757). Therefore, uncertainties we provide are the maximum values (e.g. ±156m for terminus position, and ±0.042 km2 for the area, for 1969–2002). Further work is required for a more elaborate depiction of uncertainties in the analysis of glacier variations by the hybrid-grid method.
Glacier variations over the Tibetan Plateau
Our results show that the recession of glaciers in the Geladandong mountain region is less than in other regions in China (see also Reference Lu, Yao, Liu, Ding and LiLu and others, 2002), but the recession has accelerated in recent years. During 1969–2002, glacier area decreased by a total of 43 km2, or 4.8% (0.15% a–1) of the total area (889 km2) in 1969 (Table 4). This is much smaller than the average 7% retreat (0.18%a–1) for glaciers across China since the 1960s (Reference Yao, Wang, Liu, Pu, Shen and LuYao and others, 2004). Alpine glacier recessions are occurring throughout Asia (e.g. 8.4% decrease in glacier area during 1976–2003 in the Naimona’nyi region of the western Himalaya (Reference Ye, Yao, Kang, Chen and WangYe and others, 2006); 13.8% decrease in the Urumqi river drainage area during 1964–92 (Reference Chen, Liu and JinChen and others, 1996); 17% decrease in the A’nyêmaqên Shan from the headwaters of the Yellow River during 1966–2000 (Reference Yang, Ding, Liu, Lu and ChenYang and others, 2003); 10.3% decrease in the western part of the Qilian Shan during 1956–90 (Reference Liu, Shen, Sun and LiLiu and others, 2002); 9% decrease in the Pumqu river basin between the 1970s and 2001 (Reference Jin, Xin, Che, Wu and MoolJin and others, 2005); and 4% decrease of July 1st glacier from 1985 to 2002 (Reference Sakai, Fujita, Duan, Pu, Nakawo and YaoSakai and others, 2006)). The accelerated retreat in recent years observed in this study is consistent with the results of Reference Yao, Wang, Liu, Pu, Shen and LuYao and others (2004).
Reasons for glacier variations
Glacier variations are concurrent with the changes of summertime air temperature during the past 40 years, according to meteorological data from Tuotuohe station (4533 m a.s.l.) and Anduo station (4800 m a.s.l.), which are the closest stations to Geladandong mountain (Fig. 1). Figure 5 shows a time series of summer air temperature (May through September where monthly mean temperature is above 0°C) and annual precipitation, along with linear fits and 5 year fast Fourier transform smoothing. Annual precipitation at Anduo increases (Fig. 5b), while no clear trend is evident at Tuotuohe (Fig. 5d). However, a rise in summer air temperature at both stations is clear, especially since the 1990s (Fig. 5a and c). Rising temperature in the Geladandong mountain region is consistent with a prevailing warming over the Tibetan Plateau during the last few decades (Reference Liu and ChenLiu and Chen, 2000). Temperature rise causes stronger summer melting and a corresponding negative mass balance on the glaciers, which leads to a reduction in glacier area and retreat of glacier termini (Reference Yao, Wang, Liu, Pu, Shen and LuYao and others, 2004). Recession of glaciers in the Geladandong mountain region has accelerated during the past decade, also in concert with dramatic warming in the region during the same period. The glacier recession may also be part of a longer-term response (Reference OerlemansOerlemans, 2005; Reference KerrKerr, 2006), perhaps over many hundreds of years. Reference Su and ShiSu and Shi (2002) concluded that since the maximum of the Little Ice Age (17th century) the mean temperature of monsoonal temperate glaciers in China has risen by 0.81 °C and that glacier area has decreased by 3921.2 km2, an amount equivalent to 30% of the modern glacier area.
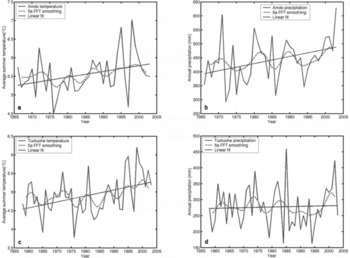
Fig. 5. Comparison between climatic parameters and glacier variations. (a) Average summer (May to September) temperature (°C) from Anduo station (1966–2003). (b) Annual precipitation (mm) from Anduo station (1966–2003). (c) Average summer (May to September) temperature (°C) from Tuotuohe station (1958–2003). (d) Annual precipitation (mm) from Tuotuohe station (1958–2003).
Despite the observations above, the reasons for glacier advances in the Geladandong mountain region have not yet been studied. They might be due to glacier surges (Reference Chinn, Winkler, Salinger and HaakensenChinn and others, 2005; Reference Larsen, Piotrowski, Christoffersen and MenziesLarsen and others, 2006), or to locally increased precipitation not detected by the sparse meteorological stations (e.g. Reference Chinn, Winkler, Salinger and HaakensenChinn and others (2005) who considered recent glacier advances in Norway and New Zealand, and Reference Hooker and FitzharrisHooker and Fitzharris (1999) who examined correlations between climatic parameters and the retreat and advance of Franz Josef Glacier, New Zealand). It is not clear at present whether the glacier advances are caused by the effects of glacier dynamics or local climate.
Future research
To date, our work has focused only on variations of glacier area. It has not included vertical variation due to down-wasting. We continue to investigate methods to calculate vertical variations from two DEMs from different times to study the volume variation of glaciers. This will enable us to generate a more comprehensive view of glacier variations in the Geladandong mountain region. It will also require detailed studies with various data sources and more intensive field surveys.
Conclusions
We have presented a method for investigation of glacier variations using GIS and remote-sensing technologies. By developing a hybrid classification of results from time-based digital images on gridcells, most of the glacier variations and misclassifications could be identified both in the synthetic map (Fig. 2) and the tables (Table 3). However, the measurement uncertainty for the hybrid-grid method needs to be studied further due to the dependent relationship between the registration error and the pixel resolution of the original data.
Our results show that while some glaciers in the Geladandong mountain region of the central Tibetan Plateau have advanced over the past three decades, others have retreated. Retreating glaciers prevail. Glacier area has reduced at a rate of 1.29 km2 a–1 during 1969–2002. In addition, glacier area recession has accelerated in recent years. The speed of glacier termini retreat has also increased. The change in glacier area in the region (4.8%) is less than the average rate (7%) over the high Asian plateau.
Acceleration of glacier shrinking is consistent with a dramatic increase in summer air temperature during the last decade, suggesting that summer temperature has played an important role in glacier variations in the Geladandong mountain region during 1969–2002. However, the reason for the spatial difference in the glacier variations (especially for the advancing glaciers) cannot be clarified without further detailed studies and in situ field surveys.
Acknowledgements
This research is supported by the National Nature Science Foundation of China (40401054, 40121101), the Chinese Academy of Sciences (‘Talent Project’, KZCX3-SW-339/334), the National Basic Research Program of China (2005CB422004) and the US National Oceanic and Atmospheric Administration (NA04OAR4600179). We thank C. Zhu, P.A. Mayewski, G. Hamilton, S. Kaspari, B. Grigholm, A. Kurbatov, Y. Wang and Y. Zhu for helpful suggestions. We also greatly appreciate helpful comments on the manuscript from R.S. Williams Jr, an anonymous referee and F. Paul. Constructive comments and generous efforts to improve this paper from the Scientific Editor, R. Naruse, are acknowledged and deeply appreciated.


