


Introduction
The Patagonian icefields, consisting of Hielo Patagónico Sur (HPS; Fig. 1) and the smaller Hielo Patagónico Norte (HPN), are the only large, temperate, mid-latitude ice masses in the Southern Hemisphere, and thus are key areas for the study of glacial response to climate change. HPS has high precipitation rates estimated at over 7000 mm a−1 w.e. (Reference Escobar, Vidal., Garin., Naruse., Naruse and Aniya.Escobar and others, 1992) and large ablation rates due to the relatively warm air temperatures (Reference Aniya, Naruse., Shizukuishi., Skvarca. and Casassa.Aniya and others, 1992). The combination produces a glacial system with a large but unquantified ice flux that should respond quickly to climatic variations. Despite HPS’s significance, there is little glaciological information available, mainly because of perennially inhospitable weather (Reference Warren and Sugden.Warren and Sugden, 1993) which has discouraged field investigations and limited classic methods of remote-sensing research. Glacier velocities have been measured on only 6 of the 48 outlet glaciers (C. R. Reference Warren and Sugden.Warren unpublished data, 1993; Reference Nishida, Satow., Aniya., Casassa. and Kadota.Nishida and others, 1995; Reference Skvarca., Satow., Naruse. and Leiva.Skvarca and others, 1995; Reference Warren and Sugden.Warren and others, 1995; Reference Rivera, Lange., Aravena. and Casassa.Rivera and others, 1997; Reference Skvarca and Naruse.Skvarca and Naruse, 1997; Reference Skvarca, Stuefer. and Rott.Skvarca and others, in press), and no complete mass-balance studies have been done on any of the glaciers (Reference Warren, Greene. and Glasser.Warren and Sugden, 1993).

Fig. 1. (a) Location of HPN and HPS. (b) The Penguin and Europa glacier areas with location of SIR-C swath (modified after Reference Aniya, Sato., Naruse., Skvarca. and Casassa.Aniya and others, 1996).
Of particular interest is the contribution of the Patagonian icefields to present and future sea-level change. In order to estimate this quantity, some fundamental glaciological data must first be obtained. Ice-flux measurement requires knowledge of the velocity field. Glacier mass-balance calculation necessitates the location of flow divides and topographic information. Estimation of the past and future changes in mass balance requires models that ideally incorporate glacier dynamic quantities such as the spatial distribution of velocity and strain rates. To understand the calving process and the formation of crevasses, estimates of the ice strength are essential.
Interferometric synthetic aperture radar (InSAR) techniques represent the most promising method of acquiring glaciological data over such vast and remote areas. The glaciological data are derived from the InSAR ice-motion and digital elevation maps with a high spatial resolution (<30m). InSAR data for HPS and HPN (Reference Rignot., Forster. and Isacks.Rignot and others, 1996a, Reference Rignot, Forster. and Isacks.b) were collected from NASA’s space-shuttle-based Spaceborne Imaging Radar C (SIR-C) in October 1994. A 37 km wide transect of the southern HPS (Fig. 1) was imaged on 7, 9 and 10 October 1994 nearly 48 and 24 h apart, respectively, with a look angle of 34° from the vertical. SIR-C interferometric data were acquired with vertical transmit and vertical receive (VV) polarization at L-band (λ = 24.23 cm) and C-band (5.67 cm). We use the longer-wavelength L-band data because they have been found to be superior to the shorter-wavelength C-band data for the temperate, fast-moving Patagonian glaciers (Reference Rignot., Forster. and Isacks.Rignot and others, 1996a). The accurate repeat of the space-shuttle orbits on the 3 days produced short baselines (the distance separating the antenna positions between the orbits) which are ideal for detecting surface displacements (Table 1). Although short-baseline interferometers do not produce highly accurate topographic maps, they are adequate for removing the topographic influence from the displacement signal.
Table 1. Interferometric SAR temporal and spatial baselines estimated from control points. The baseline components are perpendicular (Bn) and parallel (Bp) relative to the illumination direction

The short temporal baseline and the long wavelength of the SIR-C InSAR data provide a unique set of conditions for the study of temperate glaciers. While Earth Resources Satellite (ERS) interferometry data with short temporal base-lines (1- 6 day repeat orbits) have been used successfully on the polar ice sheets of Greenland (Reference Joughin, Winebrenner. and Fahnestock.Joughin and others, 1995; Reference Rignot, Jezek. and Sohn.Rignot and others, 1995; Reference Joughin, Kwok. and Fahnestock.Joughin and others, 1996a, Reference Joughin, Winebrenner., Fahnestock., Kwok. and Krabill.b, Reference Joughin, Tulaczyk., Fahnestock. and Kwok.c; Reference Kwok and Fahnestock.Kwok and Fahnestock, 1996; Reference RignotRignot, 1996; Reference Rignot, Gogineni., Krabill. and Ekholm.Rignot and others, 1997) and Antarctica (Reference Goldstein, Engelhardt., Kamb. and Frolich.Goldstein and others, 1993; Reference Kwok, Joughin. and Jezek.Kwok and others, 1996; Reference MacAyeal and Rignot.MacAyeal and Rignot, 1996), the C-band wavelength has provided only limited success on temperate glaciers (Reference Fatland and Lingle.Fatland and Lingle, 1996; Reference Vachon, Geudtner., Mattar., Gray., Brugman. and Cumming.Vachon and others, 1996). L-band SAR data are available from the previously orbiting. JERS-1, but the 44 day temporal baseline is generally too long for the fast-changing temperate glaciers.
This paper begins with a description of the imaged area, goes on to outline the steps used in the generation of the interferometric products — phase-coherence maps, a digital elevation model (DEM) and an ice-velocity map in the radar line of sight — and examines the uncertainties in these products. The last section presents a detailed analysis of the ice velocities.
Penguin and Europa Glacier Area
The part of the swath that was analyzed includes the western side of HPS which contains the terminus and most of the drainage areas of the Penguin and Europa outlet glaciers and the terminus of an unnamed glacier (referred to as HPS-19 by Reference Aniya, Sato., Naruse., Skvarca. and Casassa.Aniya and others, 1996). All three outlets are tidewater glaciers. The L-band amplitude image acquired on 7 October 1994 at 1647 h local time is shown in Figure 2. The radar bright areas at and above the tidewater termini of the glaciers are probably the result of strong multiple reflections from a heavily dissected crevasse region typical of other HPS calving glaciers (personal visit, 1995). The darker areas up-glacier represent smoother parts of the interior of the icefield. Careful examination reveals flowlines in the upper Penguin and Europa glaciers and bright areas in the middle part of Glaciar Europa which are caused by crevassing. The nunataks are imaged as the bright, roughly textured features protruding through the icefield.
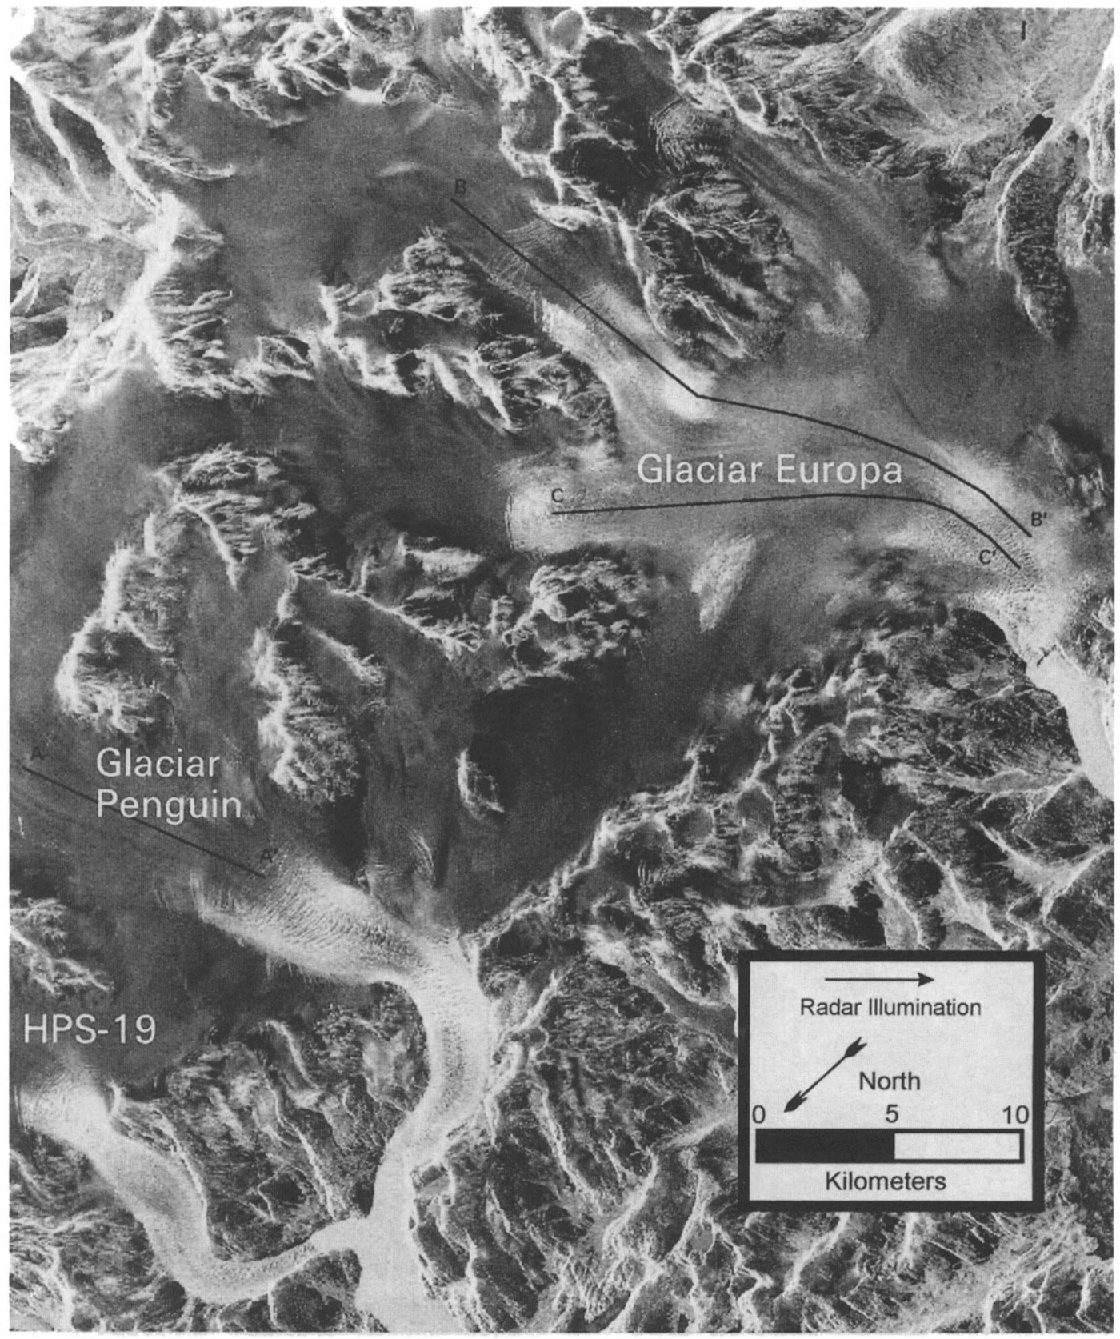
The catchment area of these three glaciers (along with the other 45 HPS outlet glaciers) have been estimated from Land-sat Thematic Mapper (TM) images at 530, 409 and 177 km2 for the Penguin, Europa and HPS-19 glaciers, respectively (Reference Aniya, Sato., Naruse., Skvarca. and Casassa.Aniya and others, 1996). The ice divides, estimated from flow-lines on TM scenes and aerial photographs, are poorly constrained between Glaciares Penguin and Europa (see Fig. 1b).
Generation of Interferometric Products
The theoretical background of InSAR has been discussed in detail by Reference Zebker and Goldstein.Zebker and Goldstein (1986), with the specific application to glacier studies by Reference Goldstein, Engelhardt., Kamb. and Frolich.Goldstein and others (1993), Reference Joughin, Winebrenner., Fahnestock., Kwok. and Krabill.Joughin and others (1996b) and Reference Kwok and Fahnestock.Kwok and Fahnestock (1996). The interferometric techniques used in this paper closely follow those of Reference Rignot., Forster. and Isacks.Rignot and others (l996a).
The main objective of this work is to isolate the surface displacement contribution and construct a map of one component of the ice velocity (in the radar-look direction) in order to estimate the ice-surface velocity field. This is achieved by first generating two interferograms using the three complex SAR images (Reference Zebker and Goldstein.Zebker and Goldstein, 1986). During the generation of the interferograms the slant-range pixels (azimuth 5.2 m, range 3.3 m) are re-sampled with a 3 × 3 averaging window to reduce noise at the expense of decreased spatial resolution. A 2 day interferogram is generated from the complex data acquired on 7 and 9 October (Table 1). A 1 day interferogram is produced from 9 and 10 October complex data. The phase of the 1 day interferogram is scaled (by 2.05) to compensate for the differences in temporal baselines. Assuming constant ice velocity, this equalizes the phase due to displacement for the 1 and 2 day interferograms. The 2 day and scaled 1 day interferograms are then subtracted, forming a “double-difference” interferogram which contains no phase contribution from displacements occurring during the acquisition period (Reference Kwok, Joughin. and Jezek.Kwok and Fahnestock, 1996). When the double-difference technique is applied to glacier surfaces, the assumption is made that the ice velocity has been constant throughout the period. This is a reasonable assumption for the large outlet glaciers sampled about 24 h apart, with the possible exception of the terminal areas which can have large sub–daily velocity variations (Reference Naruse, Skvarca., Satow., Takeuchi. and Nishida.Naruse and others, 1995).
The double-difference interferogram is used to generate a DEM. First, the phase contribution resulting from the different satellite positions (baseline) is removed using ground-control points (personal communication from A. Reference Rivera, Lange., Aravena. and Casassa.Rivera, 1997) and space-shuttle ephemerides data, a process referred to as “flattening” the interferogram. The modulo 2π phase is then integrated (unwrapped) (Reference Goldstein, Zebker. and Werner.Goldstein and others, 1988) and converted to a DEM using knowledge of the satellite position.
The 1day interferogram is also flattened and unwrapped, leaving phase contributions from topography and displacement. The topographic contribution is removed using the InSAR DEM. Finally, only the displacement contributes to the phase of the 1 day flattened-unwrapped interferogram, which is then converted to a map of ice velocity (ν r) in the direction of the radar illumination:

where λ is the wavelength (24.23 cm), φ d is the phase due to displacement and T is the time between acquisitions.
Interferometric Products
Coherence maps
An image of the magnitude of the spatially averaged cross-correlation function used to generate the interferograms indicates the level of phase coherence throughout the scenes and is referred to as a coherence map (Reference Zebker and Villasenor.Zebker and Villasenor, 1992). These maps provide a spatial indication of the quality of the interferometric data, with areas of high phase coherence corresponding to bright areas, while areas of low coherence are imaged as dark areas (Fig. 3a and b). The phase-coherence maps of both the 1 and 2 day interferograms indicate there are significant spatial variations in the near-surface properties of the icefield. Differences between the two maps are a result of changes in these properties during the 4 days that span the acquisition period and are also due to the difference in the amount of ice motion observed by the 1 and 2 day interferograms.

Fig. 3. Phase coherence map of (a) the 2 day interferogram and (b) the 1 day interferogram.
The coherence of the icefield from the 2 day interferogram (Fig. 3a) is generally high (>0.7), while the nunataks and rock surfaces at the margin are low (<0.3). The coherence is very low (<0.1) at the termini of all three outlet glaciers, and this low-coherence area extends significant distances up-glacier (HPS-19; 10 km; Glaciar Penguin: 12 km; Glaciar Europa: 3.5 km). The complete loss of coherence in these areas probably results from the large displacements and the rotation of the individual seracs forming the fractured surface (Reference Rignot., Forster. and Isacks.Rignot and others, 1996a). The abrupt loss of coherence at the margins of the two upper tributaries of Glaciar Europa can be explained by a combination of the rotation of the ice within the shear margins and large velocity gradients. This effect is seen to a lesser degree within the right shear margin of Glaciar Penguin.
The loss of L-band phase coherence has been observed approaching the termini of all Patagonian glaciers imaged during the SIR-C mission (Glaciar Moreno (Reference Rott, Stuefer., Siegel., Skvarca. and Eckstaller.Rott and others, 1998; Reference Michel and Rignot.Michel and Rignot, 1999) and four HPN glaciers (Reference Rignot, Forster. and Isacks.Rignot and others, 1996b)). The intense deformation and potential for melting typical of the lower parts of Patagonian glaciers makes classical InSAR phase measurements ineffective near the terminus. However, alternative approaches that use only the two-dimensional cross-correlation of the amplitude images can extend the displacement measurements to the terminus (Reference Rignot., Forster. and Isacks.Rignot and others, 1996a; Reference Rott, Stuefer., Siegel., Skvarca. and Eckstaller.Rott and others, 1998; Reference Michel and Rignot.Michel and Rignot, 1999). While these methods are less sensitive to temporal decorrelation and provide a two-dimensional velocity vector, their accuracy is degraded by more than an order of magnitude (Reference Rott, Stuefer., Siegel., Skvarca. and Eckstaller.Rott and others, 1998). Since this work focuses on areas away from the termini and utilizes the high accuracy required for calculating ice stress and locating flow divides, only the phase InSAR technique is used.
There are substantial differences between the 2 and 1 day coherence maps which, we believe, are related to the difference in time spanned by the interferograms and to the effects of changing surface properties. The shorter time interval of the 1 day interferogram translates into maintaining coherence at faster ice velocities, and a greater tolerance of daily rotation of ice blocks. The net effect of this is to extend the area of high coherence further down the glaciers and to provide higher coherence within the shear margins (Fig. 3b). The large area of low coherence on the lower part of Glaciar Europa cannot be explained by a time-interval change, and the relationship is the opposite of what would be expected for temporal decorrelation, In this area the 2 day coherence is higher than the 1 day coherence. The sequence of amplitude images (not shown) indicates that the radar return in this area is relatively unchanged between the days forming the 2 day interferogram (7 and 9 October) but increases dramatically on the last acquisition (10 October) which is used in the 1 day interferogram.
A large change in the radar return can be caused by a change in the dielectric properties of the glacier, which would alter the phase response and hence cause a low phase coherence. Melting or freezing of a snowpack can cause large changes in radar return (Reference MätzlerMätzler, 1987) and is the suspected cause of the low coherence. Reference Vachon, Geudtner., Mattar., Gray., Brugman. and Cumming.Vachon and others (1996) found very low coherence (<0.2) on all pairs of their ERS tandem dataset of a Canadian temperate glacier when the temperatures were above freezing during the acquisitions. Something similar to the HPS data was observed with an ERS-16 day coherence map having an area of higher coherence than the sequential 3 day coherence map (Reference Zebker, Werner., Rosen. and Hensley.Zebker and others, 1994). From temperature records they concluded the freezing of the soil and vegetation were responsible for the area of low coherence and that freezing or thawing of surfaces, in general, would cause low coherence.
While there are no temperature records or ground observations of Glaciar Europa during this time, an automatic weather station (AWS) was in place on Glaciar Moreno (Fig. 1b) approximately 50 km to the southeast (Reference Takeuchi, Naruse. and Skvarca.Takeuchi and others, 1996). The daily mean temperatures at the Moreno station during the 4 days of the SIR-C acquisitions indicate a warming trend (Table 2). The temperatures are extrapolated to the elevation range of the low-coherence area on Glaciar Europa using a lapse rate determined on Glaciar Moreno (Reference Takeuchi, Naruse. and Skvarca.Takeuchi and others, 1996). There may be errors in values and the timing of the extrapolated temperatures since Glaciar Moreno is on the eastern side of the continental divide. The temperatures suggest that near-freezing conditions may have prevailed between 7 and 9 October, while there could have been more melting on 10 October 1994. Extended melting on the surface of the glacier between the acquisitions of the 1 day coherence map would account for the low-coherence area.
Table 2. Calculated temperatures at 1200 m from AWS data on Glaciar Moreno, Argentina (Reference Takeuchi, Naruse. and Skvarca.Takeuchi and others, 1996)

Icefield surface topography
The DEM generated from the double-difference interferogram is sufficient to remove the topographic phase contribution from the 1 day interferogram in order to construct a velocity map, but, because of its relatively short baseline perpendicular to the radar line of sight (B n) it cannot be used for detailed topographic analysis (Table 1). The sensitivity of the interferometer to topography is proportional to B n:

where φ t is the phase contribution due to topography, z is the elevation, θ is the radar incidence angle, k is the wavenumber (2π/wavelength) and R 0 is the slant-range distance (Reference Joughin, Winebrenner., Fahnestock., Kwok. and Krabill.Joughin and others, 1996b, equation (9)). Each phase cycle (–π to +π) of the double-difference interferogram represents about 370 m of elevation, which translates to about three phase cycles over the approximate elevation range of the icefield in this area (1200 m). In contrast, typical ERS-l interferometers used to generate DEMs (Reference Zebker, Werner., Rosen. and Hensley.Zebker and others, 1994; Reference Joughin, Winebrenner., Fahnestock., Kwok. and Krabill.Joughin and others, 1996b) yield an elevation-to-fringe ratio which is 2–8 times more sensitive to topography. The ratio of Equation (2) can also be used to estimate the error in the interferometric topography (σ z) introduced by phase noise (σ φ). Phase noise is calculated from the coherence (γ):

where N is the number of looks of the interferogram (N = 0) (Reference Rodriguez and Martin.Rodriguez and Martin, 1992). Phase noise in the double-difference interferogram over the areas of typical coherence (0.6) and areas of low coherence (0.4) yields σ z of 18 and 36 m, respectively. Errors of this magnitude prevent the DEM from being used for detailed topographic analysis or as a benchmark to estimate future glacier elevation changes. Additional errors from baseline uncertainties, atmospheric delays and receiver clock noise are more difficult to quantify (Reference Rignot., Forster. and Isacks.Rignot and others, 1996a). Local errors may also result from differences in the penetration depth of the L-band signal into the snow/firn and ice, as well as multiple scattering from very rough surfaces such as crevasses, which lengthens the phase path length.
Since there are no topographic maps available for this area, a filtered version (25 pixel median filter) of the DEM is still useful and is shown in Figure 4 draped over an amplitude SAR image. The DEM covers only the icefield and excludes the nunataks and some areas on the ice where coherence values are low or unwrapping errors occurred. The elevations range from 800 m (dark blue), near the area where phase coherence is lost on Glaciar Europa, up to 2200 m (dark red). The approximate locations of the two primary topographic divides on the icefield between Glaciaires Europa and Penguin are indicated as black lines (Fig. 4) and are used in the analysis of the ice divides in the next section.

Fig. 4. A median-filtered DEM of the icefield generated from the double-difference interferogram over an amplitude image. Dark blue is 800 m and dark red is 2200 m. The two black lines on the DEM are the topographic divides between Glaciares Europa and Penguin.
Ice motion
The very short baselines which introduce large errors into the DEM are advantageous for surface displacement measurements. The 28 m perpendicular baseline of the 1 day interferometer (Table 1) yields a sensitivity of 570 m of elevation per phase cycle (Equation (2)) which translates into two cycles of phase for the range of icefield elevations. In contrast, one phase cycle represents 0.12 m of displacement (Equation (1)), implying the 1day interferometer is over 4000 times more sensitive to displacement than to topography. Since the phase of the unwrapped–flattened 1day interferogram is dominated by displacement contributions, only a general DEM is needed to remove the broad-scale topographic phase. The phase-noise-induced errors in the DEM (18–36 m) result in velocity errors of 0.6–1.2 cm d−1 (Reference Joughin, Winebrenner., Fahnestock., Kwok. and Krabill.Joughin and others, 1996b, Equation (15)). The errors of the velocity measurements(σ ν) due to phase noise (σ φ) in the 1 day interferogram are related to coherence (Equation (3)):

The phase-noise-induced velocity errors (and their corresponding coherences) are 4.6 mm d1 (0.72) for typical areas of the icefield, 7.3 mm d−1 (0.57) within the shear zones and 14.1 mm d−1 (0.36) at the lower part of Glaciar Europa affected by melting.
The additional errors from baseline uncertainties, atmospheric delays and receiver clock noise also apply to the 1 day interferogram and therefore directly to the velocity measurements. The cumulative effect of these errors is small and can be measured as the velocity of small ice-free regions which are assumed to have zero displacements. Most of the ice-free areas were manually masked because of their very low coherence (<0.2). The rock areas remaining are labeled in Figure 5. The perimeter of all rock areas has apparent velocities of 0 ± 1.0 cm d−1. This velocity range is shown as black in Figure 6. (There are non-rock areas with this velocity range, and their origin is explored in the next section.) The locations of the rock areas span nearly the full extent of range and azimuth, implying any residual tilt in the interferogram from errors in estimating the baseline produces velocity errors less than ±1.0 cm d −l. The interior area of a few of the rock outcrops has a measured velocity of –2 cm d−1. This error is greater than the 1.41 cm d−1 phase error calculated for the low-coherence areas, and therefore we can estimate the combined effect of the baseline uncertainties, atmospheric delays and receiver clock noise errors as ≈2 cm d−1. This value serves as an upper bound because it is impossible to determine from the amplitude image if some of the areas labeled bare rock contain the edges of small cirque glaciers with true ice motion.
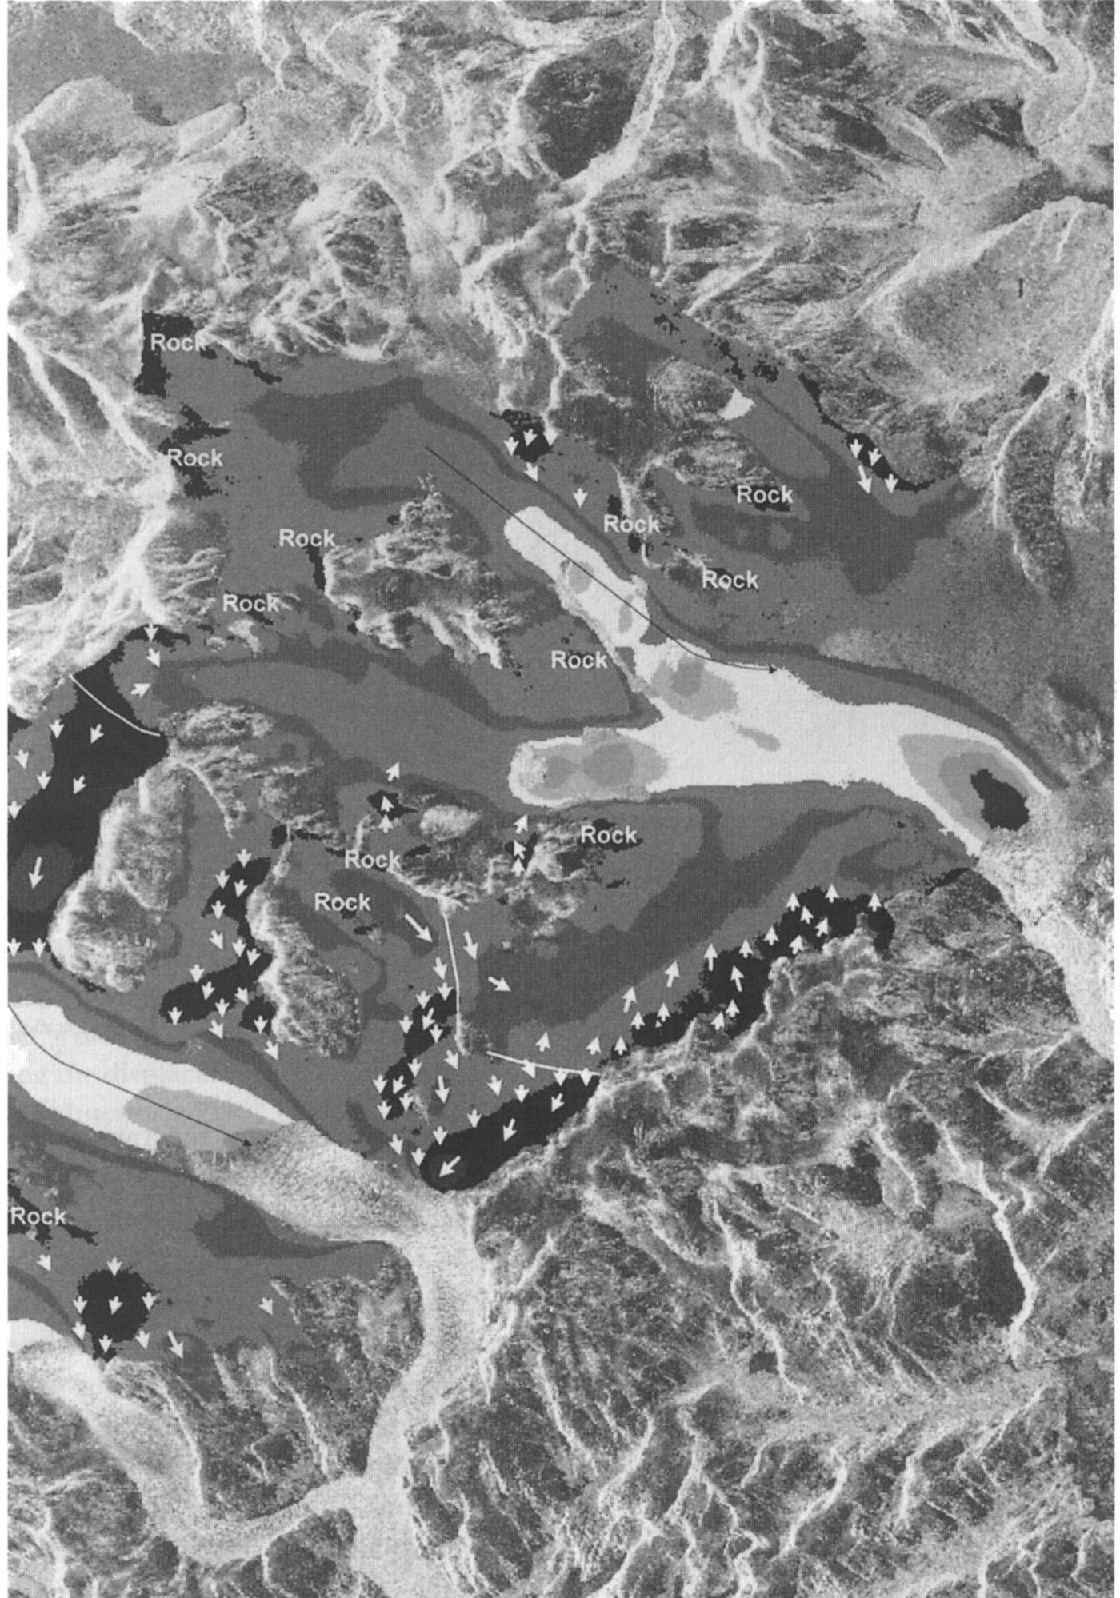
Fig. 5. Model of the flow patterns (white arrows) near the areas of transition from flow toward (dark shades) to flow away from (light shades) the radar illumination direction. The length if the arrows is not proportional to speed. Velocity contours are a gray-scale representation if Figure 6.

Fig. 6. Map of the ice velocity in the radar line if sight (from left). The solid red lines are the topographic divides from the DEM (Fig. 4). The dashed red line is the boundary between the velocity map with topographic phase removed (left) and the velocity map derived directly from the flattened–unwrapped 1 day interferogram (right). The black lines are the locations of the velocity profiles shown in Figures 7–9.
The ice-velocity map (Fig. 6) is spatially limited by the extent of the DEM. The phase of the 1 day interferogram was successfully unwrapped on a larger part of the lower end of Glaciar Europa. In this area the double-difference phase contained many unwrapping errors, and the assumption of steady ice flow over the longer time period is probably not appropriate approaching the terminus. Therefore, no DEM was generated for this area. The 1 day interferogram is dominated by displacement, and the change in elevation across lower Europa is estimated to be <200 m based on control points near the limit of the DEM and the ice front. Therefore, the assumption that the phase is independent of topography results in a relative velocity error of 4.2 cm d−1 (Equations (1) and (2)). This relative velocity field was converted to absolute velocity by adding a phase constant forcing the velocity to be continuous across the boundary (Fig. 6, red dashed line) with the DEM-derived velocity map. Similar extensions could not be added to the Penguin and HPS-19 glaciers because the limits of successful unwrapping for the 1 day and double-difference interferograms coincided.
Analysis of Ice Velocity
Radar line-of-sight velocities
The ice-velocity map contains only the component of ice motion in the direction of the radar illumination, but reveals the great spatial variation in velocity within this geometrically complex part of HPS (Fig. 6). The two purple hues represent ice motion toward the radar. The range of colors from blue (low velocity) to red (high velocity) represent motion away from the radar. The narrow range of velocities near zero, which includes the transition from ice motion away from to ice motion toward the radar, is shown in black. While much of the complexity of the map, particularly the change in sign of the velocity, can be attributed to the change in flow direction relative to the radar illumination direction, there are several obvious characteristics of the velocity field worth noting. The velocity patterns of the lower parts of all three glaciers are indicative of a central core of fast-flowing ice bordered by the slower-moving icefield on either side. The same observation was made by SIR-C InSAR for Glaciar San Rafael, Chile (Reference Rignot., Forster. and Isacks.Rignot and others, 1996a), and for Columbia Glacier, Alaska, from photogrammetry techniques (Reference Meier, Rasmussen., Krimmel., Olsen. and Frank.Meier and others, 1985). The ice accelerates toward the glacier termini and reaches a maximum line-of-sight velocity of 0.9, 1.5 and 2.2 m d−1 for the HPS-19, Penguin and Europa glaciers before phase coherence is lost. (These velocities represent the motion in the direction of the radar illumination, from the left of Figure 6 inclined 57° from the horizontal, and therefore underestimate the ice-surface velocity, which is computed along transects in the following subsection.) There are several circular regions of high velocity separated by troughs of slower velocity on the two upper tributaries of Glaciar Europa.
Velocity profiles
In order to construct a complete two-dimensional map of ice velocity, at least one more interferogram with an opposing line of sight is required (Reference Goldstein, Engelhardt., Kamb. and Frolich.Goldstein and others, 1993; Reference Kwok and Fahnestock.Kwok and Fahnestock, 1996). For areas where the flow direction (ζ) and surface slope (ø) is known, the radar line-of-sight velocity (ν r) can be projected onto the ice surface in the direction of flow yielding an ice-velocity measurement
equivalent to measuring the displacement of a feature on the ice surface (Reference Kwok, Joughin. and Jezek.Kwok and Fahnestock, 1996). The assumption of ice motion parallel to the ice surface is valid since the vertical component due to ablation is very small compared with the motion over most of the glacier. The horizontal component of the ice-surface velocity in the flow direction (ν fl-h) is calculated along the path of three flowlines that are observed on the amplitude image (Fig. 2). The location of the transects is also shown on the ice-velocity map (Fig. 6). The surface slope along the transects is calculated from the median-filtered DEM. The velocity profiles are smoothed using a boxcar-averaging function with a width of 50 pixels (≈750 m). Longitudinal strain rate is computed as Δν fl-h/ Δd fl, where d fl is the distance between velocity measurements along the transect (≈15 m).
Transect A
The ice velocity along the center line of Glaciar Penguin gradually increases from 1.7 to 2.0 m d1 during the first 3.5 km of the transect before quickly rising to 2.6 m d1 in the last 1.5 km (Fig. 7a). While the data end approximately 14 km from the terminus, this trend is similar to velocities recorded approaching the termini of other tidewater glaciers (Reference Meier, Rasmussen., Krimmel., Olsen. and Frank.Meier and others, 1985; Reference Naruse, Skvarca., Satow., Takeuchi. and Nishida.Naruse and others, 1995; Reference Rignot., Forster. and Isacks.Rignot and others, 1996a) which can be attributed to a dominance of basal sliding and the diminution of longitudinal back-stress on the terminus (Reference Meier and Post.Meier and Post, 1987). At this distance from the terminus the sharp increase in velocity is more likely the result of an increase in basal sliding, possibly due to an influx of subglacial water from increasing melt at lower elevations along with the availability of crevasse drainage.

Fig. 7. Glaciar Penguin flowline transects of (a) horizontal ice velocity and topography from the median-filtered DEM and (b) longitudinal strain rate: compression (–) and extension (+). The location of the initiation if crevassing as determined from the amplitude image (Fig. 2) is shown in (b). The location if the transect is shown in Figures 5 and 6.
Longitudinal strain rates in the first 3.5 km are slightly higher than the 10−2 a−1 typical of temperate glaciers (Reference PatersonPaterson, 1994) (Fig. 7b). The small oscillations from compressive to extensional flow may be a reflection of bedrock bumps. The strain rate at the location where crevassing begins along the transect is 0.25 a−1 and indicated by the vertical line in Figure 7b.
The location of crevasse initiation from the amplitude image (Fig. 2) combined with strain rates measured along the center line (Fig. 7b) allow the tensile strength of the ice to be estimated. Reference VaughanVaughan (1993) used published strain-rate measurements from field observations and remote-sensing data of crevassed and uncrevassed locations to estimate temperate- and polar-ice tensile strength. His model assumes crevassing is controlled by the strain rate in the deep ice and hence its constitutive relationship. The firn acts as a thin surface layer contributing little to the strength of the ice mass. The range of tensile strength found from the four temperate glacier studies cited is 90–200 kPa, all values being based on field observations.
The relationship used for converting strain rates to deviatoric stress simplifies to Glen’s flow law of ice under the assumption of only one surface component of strain, as is typically assumed along the center line. The symmetry of the crevasses about the center line (Fig. 2) supports the assumption of minimal lateral strain and therefore the use of the flow law. However, ice fractures in response to the absolute stress and not the deviatoric stress. The relationship between the longitudinal deviatoric stress (σ ′L) and the tensile strength of ice (σ T) is dependent on the failure criteria. Using the maximum octahedral shear-stress (von Mises) criterion (Reference RamsayRamsay, 1967) with the assumption of no lateral strain, we find
Applying Griffith’s criterion (Reference Jaeger and Cook.Jaeger and Cook, 1979) predicts
The tensile strength of ice can now be estimated from our observations of strain rate by incorporating the flow law with Equations (6) and (7), respectively:


where
The observed strain rate at crevasse initiation (0.25 a−1), with A set to Reference PatersonPaterson’s (1994, p.97) recommended value for temperate ice (6.8 × 10⁻¹⁵ s−1 kPa−3), implies the tensile strength of the ice is 182 ± 5 and 210 ± 5 kPa from Equations (8) and (9), respectively. (The error estimate is based on the 2 cm d−1 uncertainty in the ice velocity and the effect of the smoothing function on the profiles.) This result, using 15 m pixels to locate the crevassing, is within the range of tensile strengths measured during the field-based studies mentioned above. This also supports Reference VaughanVaughan’s (1993) conclusion that derived tensile strength is not significantly influenced by the resolution of the data.
Transect B
The velocity profile of the south branch of Glaciar Europa follows a flowline that can be traced almost continuously from the amplitude image. Within the first 9 km of the transect the velocities fluctuate dramatically over short distances, reaching a maximum of 2.6 m d−1 near 5 km, then slowing to a near constant speed of 0.4 m d−1 before accelerating to 3.3 m d−1 at the end of the transect (Fig. 8a). The magnitude and fluctuation of these velocities are very similar to those found on Columbia Glacier (Reference Meier, Rasmussen., Krimmel., Olsen. and Frank.Meier and others, 1985, Fig. 13). Beyond 10.5 km, where there is no InSAR DEM because of low coherence in the double-difference interferogram, the surface velocities are derived directly from the flattened unwrapped phase of the 1 day interferogram. The topography in this area is estimated by assuming a constant slope to a control-point elevation near the end of the transect.

Fig. 8. Glaciar Europa south-tributary flowline transects of (a) horizontal ice velocity and topography from the median-filtered DEM and (b) longitudinal strain rate: compression (–) and extension (+). The location of the initiation of crevassing as determined from the amplitude image (Fig. 2) is shown in (b). Velocity and topography to the right of the thick vertical line in (a) are derived from the 1 day interferogram and extrapolated to a control point, respectively. The location of the transect is shown in Figures 5 and 6.
The longitudinal strain rate for this transect can provide insight into the flow dynamics. The peaks at 2.3 and 4.3 km coincide with locations where the valley walls narrow the width of the glacier. This causes transverse compression of the ice, which is compensated by longitudinal extension (Reference PatersonPaterson, 1994). As the valley widens down-glacier, the flow tends to be more compressive. There are two points along the transect where crevassing initiates, with a crevasse-free zone between them (Fig. 8b, vertical lines). At the point near 2 km the strain rate is 0.3 a−1, which translates to a tensile strength of 194 ± 4 and 224 ± 5 kPa from Equations (8) and (9), respectively. This is slightly higher than the tensile strength found on Glaciar Penguin and at the upper end of the range cited above (Reference VaughanVaughan, 1993). Crevassing continues down-glacier until the 2.9 km location where a small compressive region begins and crevasses are no longer detected until the strain rate climbs back to 0.2 a−1 (tensile strength 169 ± 6 and 195 ± 6 kPa from Equations (8) and (9), respectively) at 4.1 km. Below this point it is difficult to detect the presence or absence of crevasses. The reinitiation of the crevassing at a lower strain rate, implying a lower tensile strength, seems reasonable since the ice was previously fractured. The very large compressive strain rate (–1.1 a−1) at 8.3 km is associated with the end of a very steep section (Fig. 8a) corresponding to a bright area in the amplitude image (Fig. 2). This feature is most likely an icefall. The increased noise of the strain rate between 9 and 11 km is a result of low phase coherence in the 1 day interferogram caused by the suspected melting episode discussed above. The strain rate begins to increase at 12 km as the glacier accelerates toward the terminus.
Transect C
The velocity profile of the north branch of Glaciar Europa begins below a gap in the velocity map and DEM which resulted from low coherence (Fig. 9a). This profile is similar to the last 11km of the south-branch velocity profile (Fig. 8a), with local velocity maxima corresponding to steepened topography followed by an acceleration toward the terminus. The flowline from the north tributary ends in the area of maximum velocity, reaching 5.4 m d−1. The longitudinal strain rate (Fig. 9b) is also similar to that of the last 11 km of the south branch (Fig. 8b). Since the transect begins below the initial crevassing location, strain rates from this profile cannot be used to compute tensile strength.

Fig. 9. Glaciar Europa flowline transects of (a) horizontal ice velocity and topography from the median-filtered DEM and (b) longitudinal strain rate: compression (–) and extension (+). Velocity and topography to the right of the thick vertical line in (a) are derived from the 1 day interferogram and extrapolated to a control point, respectively. The location of the transect is shown in Figures 5 and 6.
Flow divides
Since a flow divide is defined as a location where the horizontal component of the ice velocity is zero (Reference PatersonPaterson, 1994), one might expect flow divides tobe identifiable on an InSAR velocity map. Flow divides and their analogous feature on ice caps, flow centers, are found near topographic divides and summits but do not always have coincident locations. A flow divide can be displaced from a topographic divide because of asymmetric bedrock slopes (Reference PatersonPaterson, 1994) or a gradient of net accumulation across the divide (Reference Van der Veen and Whillans.Van der Veen and Whillans, 1992).
Flow divides and flow centers are important glaciological features that are difficult to locate, requiring intensive field measurements. Ice cores for paleoclimatic interpretation are desirable from ice-flow centers where corruption of the time-depth relationship from horizontal motion is minimized (Reference Jaeger and Cook.Van der Veen and Whillans, 1992). In order to measure the total mass balance of a glacier, its surface area must be known. In areas where individual glaciers originate from a common accumulation zone the flow divides must be mapped. The location of flow divides on HPS are additionally significant as they form part of the disrupted boundary between Chile and Argentina.
The numerous large nunataks and the generally ice-free continental divide in the southern part of HPS segregate the outlet glaciers into individual mountain glaciers separated by small flow divides. In this scene there are two segments of the flow divide which cross the icefield, separating ice flowing between Glaciares Europa and Penguin. The topographic divides on the icefield, estimated from the DEM, are shown in Figure 5 as red lines.
There is an area of zero velocity near the upper topographic divide between Glaciares Europa and Penguin which may represent the flow divide. Other zero-velocity bands are the result of ice flow perpendicular to the radar line of sight, but no reasonable model of flow patterns can explain the band of zero velocity near the upper topographic divide (Fig. 6). Therefore, we believe this band of near-zero velocity represents the upper flow divide between Glaciares Europa and Penguin.
There is no similar band of zero velocities near the lower topographic divide between Glaciares Europa and Penguin. The velocity along the topographic divide is at a local minimum and averages about 6 cm d−1. This is outside the expected cumulative error for velocity measurements and must be explained by something other than systematic-errors. The elevation of the two divides may explain the difference. The upper divide is near the highest point on the icefield at 2100 m. The lower divide is separated by a rock outcrop with the lower part straddling a gently sloping plateau at 1400 m. The upper part of the lower divide runs across an ice ridge at 1550 m. At these lower elevations it is conceivable that daily ablation rates approach several cm d−1. This vertical contribution to the radar line-of-sight velocity could be masking the zero horizontal velocity. Another possible explanation for the lack of zero velocities at the lower divide is a non-steady-state condition where one of the glacier’s drainage areas encroaches on the other.
Flow patterns
Thus far two situations have been identified that produce near-zero ice velocity, stationary ice-free areas and ice at a flow divide. The remaining bands of near-zero ice velocity distinguish areas of ice motion toward the radar from areas of ice motion away from the radar. These areas are thought to be locations where the velocity vector is perpendicular to the line of sight and therefore no motion is detected by the interferometer. The location of these low-velocity bands in areas where no flowlines are visible is used to constrain the orientation of the velocity vector in that area. A model of the general ice-surface flow direction is made from the locations of perpendicular flow superimposed on the line-of-sight velocity map (Fig. 6).
Summary and Conclusions
The L-band InSAR data of the Europa and Penguin glacier section of HPS allow us to demonstrate new glaciological applications of InSAR data and provide the first quantitative glaciological information for this area. In addition, the limitations of the technique for parts of the glaciers provide guidance for the acquisition schedule of future InSAR missions for temperate glaciers.
The application of InSAR to flow-divide mapping demonstrated that ice-flow divides may be located from a line-of-sight velocity map, but their detection may be limited in areas of high daily ablation. An additional InSAR velocity map with a different line of sight would allow extensive flow-divide mapping for a selection of ice-core sites, and drainage mapping of icefields and ice sheets. InSAR velocity along a glacier center line, where only longitudinal strain is present and the accompanying amplitude image for crevasse detection permit the tensile strength of ice to be estimated from a combination of InSAR data and the flow law of glacier ice. Coincident data of strain rates and crevasse initiation are needed to test physically based models of crevasse formation which are essential to the understanding of glacier calving processes (Reference Van der VeenVan der Veen, 1997). InSAR observations along a center line can readily supply these data. The flow direction of parts of the glacier where no flowlines are present can be constrained from the line-of-sight velocity map in areas where the ice-flow direction passes through the orientation perpendicular to the radar line of sight. Thus, with even a single component of velocity the vector orientations in some featureless areas can be constrained.
The limitation of temporal baselines for L-band InSAR techniques on temperate glaciers is illustrated by the coherence maps of this area. Two different phenomena are shown to cause isolated areas of low coherence on the glaciers, which limit the spatial extent of the InSAR data. The first is due to high glacial velocity and directly related to the length of time between the InSAR acquisitions. Large, uniform displacements within 5–15 km of the terminus, and large, differential displacements within the shear margins cause loss of interferometric data. Near the terminus an alternative application of the repeat-orbit amplitude data is more effective (Reference Rott, Stuefer., Siegel., Skvarca. and Eckstaller.Rott and others, 1998; Michel and Rignot, in press). The second process that results in low coherence is melting. It changes the physical properties of the snow/firn, thereby altering the scattering properties of the glacier. Thus, even though L-band’s longer wavelength makes it superior to C-band for InSAR studies on temperate glaciers, there are considerable limits to the temporal baseline for fast-flowing glaciers, especially in the presence of freeze/thaw conditions. This implies that winter acquisitions of InSAR data are desirable.
From a map of only the radar line-of-sight velocity it can be seen that the Europa, Penguin and HPS-19 outlet glaciers have central cores of high-velocity ice flanked by slower-moving ice. Knowledge of the flow direction greatly enhances the utility of the radar line-of-sight ice-velocity map for glaciological interpretation. The horizontal component of the ice velocity computed along a flowline of Glaciar Europa reaches a maximum of 5.5 m d−1 and varies rapidly, with several local maxima and minima occurring within both the north and south tributaries. Consequently, there are areas of high longitudinal strain rate (> 0.5 a1) which are attributed to a narrowing of the glacier. The horizontal velocity profile along the center line of Glaciar Penguin is typical of a tidewater glacier approaching the terminus. The center-line longitudinal strain rates at the locations of crevasse initiation for both glaciers imply tensile strengths of ice (169–224 kPa) which are within the range of field-based measurements on temperate glaciers.
Acknowledgements
Support for this work was provided by NASA through SIR-C grant 958745. The strain-rate analysis was done while R. F. was a Byrd Post-doctoral Fellow at the Byrd Polar Research Center. The authors are thankful for the insightful comments of G. Casassa and A. Rivera on an early manuscript and for their inspiration during a December 1995 visit to the Patagonian icefields by R. F. and E. R. The authors are grateful for the perceptive suggestions of the reviewers C. Warren and A. Luckman. This is Byrd Polar Research Center contribution No. 1138.


