


Introduction
For well over a century, cirques have been recognized as the product of alpine glaciation. Yet even though cirques show a close, indeed necessary, link to climate at all scales (Reference Derbyshire, Evans and DerbyshireDerbyshire and Evans, [c1976]) no empirically verified explanation for the localized variation in cirque development has been forthcoming. Glacier and cirque frequencies are so clearly dependent upon the topoclimatic effects (Reference EvansEvans, 1977) that it is surprising when statistical analyses indicate insignificant associations between cirque morphometry and the process controls (Reference TrenhaileTrenhaile, 1976, p. 457; Reference GordonGordon, 1977, p. 186–87). The complicating effect of variable bedrock materials explains much of this apparent paradox (Reference OlyphantOlyphant, 1977, p 212), but a failure to recognize the interaction between environmental controls has also been important.
This paper relates intramountain variability in cirque development to local-scale topoclimatic and geologic effects. Emphasis is placed upon the question of how the process-related factors combine to influence cirque development.
Local-scale process controls
Reference Andrews, Andrews, Barry and DrapierAndrews and others (1970), Reference GrafGraf (1976), and Reference EvansEvans (1977) have conclusively demonstrated that there is a causal link between topography and alpine glacier distribution. At the onset of a glacial cycle, those topographic sites that are most conducive to the maintenance of a positive net mass balance arc the first to be glacierized. With continued climatic deterioration, new sites become favorable for glacier maintenance (in response to the “law of decreasing glacial asymmetry with increasing glacial coverage” (Reference EvansEvans, 1977, p. 169)) but the original sites will maintain larger, more active, glaciers than the marginal sites. As climate begins to ameliorate (causing deglaciation) marginal sites are the first to be abandoned while the most favored are the last. It follows that the total length of time t that a cirque is/was glacierized varies with the glacial favorability of its topoclimatic situation.
Reference Derbyshire, Evans and DerbyshireDerbyshire and Evans ([c1976], p. 449–51) identify at least seven factors that should be considered in a model relating climate to glacier balance/activity. These include latitude, altitude, continentality, aspect (poleward, leeward, and eastward aspects are considered optimum), and topography. Altitude, aspect, and topography are assumed to be the primary local-scale controls, especially in rugged continental ranges where average cloudiness and wind drifting arc reduced (see Reference EvansEvans, 1977, p. 154). While protection from direct insolation (a function of aspect, slope, and topography) is probably the most important glacier control (Reference Andrews and MorisawaAndrews, 1971, p. 231; Reference EvansEvans, 1977, p. 152), the effect of altitude cannot be ignored. Altitude influences glacier mass balance (and consequently t via direct controls over average temperature (c. 0.6 deg per 100 m) and cloudiness (Reference Derbyshire, Evans and DerbyshireDerbyshire and Evans, [c1976], p. 450).
Intramountain variations in cirque development reflect both duration and intensity of glacial erosion:
where V is cirque volume (a measure of cirque development) and dV/dt represents the average rate of cirque enlargement (Reference AndrewsAndrews, 1972, p. 16). t depends exclusively upon topoclimalic situation (at least at the intramountain scale), but the rate of cirque erosion is also a function of the resistance of bedrock materials (Reference AndersonAnderson, 1978, p. 758).
Several variables influence bedrock erosibility (including intact bedrock hardness, permeability, and bedding attitude (Reference Sugden and JohnSugden and John, 1976, p. 166)), but fracture density is assumed to be the most important factor determining local-scale variations in susceptibility to cirque erosion. Densely fractured bedrock is especially susceptible to erosion by joint block removal and frost riving (Reference Embleton and KingEmbleton and King, 1975, pp. 231–33). Reference Boulton and CoatesBoulton’s ([c1974], p. 71) theoretical analyses suggest that glacial quarrying (crushing and plucking) should also be more effective on densely fractured bedrock. Indeed, Reference TempleTemple (1965, p. 192) concluded that the majority of well-developed cirques within the English Lake District are located in structurally weak (shattered) bedrock. Substituting the control factors into (1) gives:
where V is cirque volume and A, R, and J represent altitude, insolation, and bedrock joint density respectively.
Equation (2) identifies the primary local-scale process controls, but it does not suggest how the factors combine to influence cirque development. For example, the process controls could combine additively or multiplicatively and still satisfy the general relation. Similarly, the relationship between cirque development and the process controls could be linear or nonlinear and still satisfy Equation (2). A rational solution for the function is desirable, but given the indirect nature of the topoclimate–landform link, and our lack of knowledge about how cirque volume changes through time, and empirical approach seems warranted.
Acquisition of data
Recent efforts to correlate cirque size (area or volume) with topoclimatic effects have met with limited success (Reference Derbyshire, Evans and DerbyshireDerbyshire and Evans, [c1976], p. 487; Reference TrenhaileTrenhaile, 1976, p. 462; Reference GordonGordon, 1977, p. 192), One problem has been the lack of control over complicating regional factors such as latitude, windward/leeward contrast, and mountain structure. Another complication, especially in severely glaciated mountain masses, stems from the development of secondary cirques (possibly reflecting a late Pleistocene or early Holocene snow-line) at the more glacially favorable topoclimatic locations. In this study, emphasis is placed upon the detailed analysis of a relatively small number of cirques. The cirques were sampled from a compact, marginally glaciated, mountain massif in an effort to control the regional factors and at the same time avoid the complications that derive from overriding ice sheets and multiple cirque levels/ages.
Study area
Twenty-three cirques within the Blanca Massif portion of the Sangre de Cristo Mountains, southern Colorado, were studied during the 1976–78 field seasons (Fig. 1). All of the cirques are eroded into igneous intrusive lithology.Footnote * Hornblende diorite predominates near the head of Huerfano Valley, while the northern portion of the west ridge (around Baja and Saddle Cirques) consists of hornblende gneiss; but the greater portion of the massif is underlain by granodiorite (Reference JohnsonJohnson, 1969). There is a broad variation in average joint spacing within the study area (the spacing between continuous joints ranges from >10m to ˂30 cm, with a mean of approximately 1.4 m) that is independent of bedrock type.

Fig. 1. Map of upper Blanca Massif.
The Blanca Massif has not been extensively glaciated since late Pinedale time (c. 11000 B.P.), and then the orographic snow-line did not extend very far below the upland summits (Reference MorrisMorris, 1979; Reference Richmond, Wright and FreyRichmond, 1965, p. 225). The moderate degree of glaciation has resulted in an abundance of elementary cirque forms. Such forms simplify morphometric analysis because their outlines can be unambiguously defined on aerial photographs and topographic maps (Reference Evans and CoxEvans and Cox, 1974, p. 152).
Definitions and measurements
A cirque is defined as “a hollow, open downstream but bounded upstream by the crest of a steep slope (headwall) which is arcuate in plan around a more gently sloping floor. The floor of a cirque shows evidence of glaciation and a drainage divide is sufficiently close to the top of the headwall to indicate that little or none of the ice that fashioned the cirque flowed in from the outside” (Reference Evans and CoxEvans and Cox, 1974, p. 151).
Cirque volumes were estimated by the product LWD. Average values of cirque length L. and cirque width W are depicted in Figure 2. Average cirque depth D is defined as the vertical distance between the cirque lip and the mean elevation of the cirque rim. Cirque outlines were established with the aid of 1:19000 aerial photography, but the size measurements were abstracted from 1:24000 photogrammetrically reproduced topographic maps having a contour interval of 40 ft (12 m).
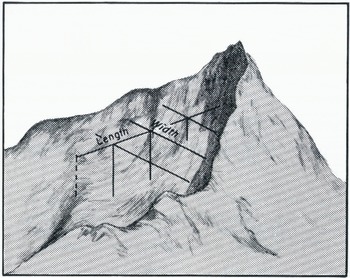
Fig. 2. Cirque morphometry. Average cirque length is the horizontal distance between the cirque lip and the midpoint of cirque headwall. Average cirque width is the mean of width measurements taken at the cirque lip and three equally spaced Points along the line defining cirque length. Width measurements were made between cirque side-wall midpoints.
Radiation receipt/reduction R is calculated from a knowledge of Earth-Sun geometry. The potential solar flux I can be calculated from
where I 0 is the solar constant (c. 1.94 Ly/min, c. 1.38 kW/m2), χ is the mean zenith-path transmissivity of the atmosphere (assumed to be 0.75), η is the optical air mass, and ξ is the angle formed by the surface and the solar beam. Reference Garnier and OhmuraGarnier and Ohmura (1968, p. 797) provide the following expressions for ξ and η. On an equinox
and
where δ is the solar declination, ø is the latitude of the site, γ is the hour angle of the sun (angular distance from the point of evaluation), θ is the aspect of the surface, and β its slope.
A cirque will be in shadow if the topography γ in line with the solar azimuth exceeds a critical height. The azimuth of the Sun ω is:
where ψ is the solar altitude
and the critical height γ c is:
where X is the horizontal distance (measured in line with the solar azimuth) between the cirque midpoint and the relevant topographic obstruction.
When Equation (3) is integrated over sufficiently small intervals (Δγ = 5° = 20 min) throughout a clear equinoctial day, taking into account that I = 0 when γ c < γ, the total potential insolation at a surface I t can be estimated. R is defined as:
where I p is the theoretical maximum insolation that a cirque mid-point could receive (i.e. I p = 452 Ly = 18.92 MJ/m2 for θ = 180° and β = 5°). A value of 5° was used for β in all calculations made for cirque mid-points because it allows variations in aspect to be included in the estimates of R, but minimizes errors that result from making estimates of glacier surface slopes. R then, measures the percentage radiation reduction that results from the combined effects of latitude, aspect, and topographic obstructions.
Altitude, defined as the average elevation of the summits on the cirque rim, was measured with respect to the Pleistocene glaciation limit (c. 3600 m in the Blanca Massif). Summit elevation is preferable to cirque-floor elevation because surrounding summits (process controllers) more effectively define altitudinal position of cirques within a massif than do cirque floors (products of erosion).
Two to three estimates of bedrock jointing were made in each of the sample cirques. A joint is defined as a continuous geological separation wider than 0.1 mm and up to several meters or more in length. This definition is equivalent to the engineering term “microfracture” (Reference JaegerJaeger, 1972, p. 28). Microfractures were chosen as the measurement variable because separations of this size seem to be most commonly exploited by mechanical weathering processes. Jointing estimates derive from direct tape measurements of block dimensions on intact rock walls. The mean of thirty measurements of joint spacing at a site provided an estimate of average joint spacing. The reciprocal of mean joint spacing is the density, or frequency, of jointing J.
In order to derive an estimate of joint frequency/spacing for an entire cirque, a three-stage procedure was employed, (1) Cirques were field mapped according to their jointing appearance. Wall sections were classified as to whether they appeared massive (i.e. unjointed) or densely fractured. (2) Joint measurements were made at sites that were deemed representative of their respective classes. (3) Weighted mean J values were calculated taking into account the relative proportions of massive and highly-jointed wall sections.
Empirical findings
Interregional factors, such as latitude, can induce trends in cirque development that are not related to local-scale effects (Fig. 3). Cirques in the present study have volumes ranging from 41.2 × 10⁷ m3 to 3.1 × 10⁷ m3 with a mean of 8.9 × 10⁷ m3. When plotted (Fig. 3) the size and location of the Sangre de Cristo cirques provide a logical extension of the trend identified by Reference GrafGraf (1976).

Fig. 3. Plot of cirque volume versus latitude for nine sub-ranges in the Rocky Mountains. Mountain ranges an identified by numbers: (1) Sangre de Cristo Mountains, (2) Front Range, (3) Wind River Range, (4) Teton Range, (5) Big Horn Mountains, (6) Beartooth Range, (7) Mission Range, (8) Livingston Range, (9) Lewis Range, (1)—this study; (2)–(9)—Reference GrafGraf(1976).
Correlations between the local-scale controls and the natural logarithms of cirque volume are summarized in matrix form (Table I).Footnote * The coefficients above the principal diagonal represent the simple (i.e. unpartialed) correlations between the variables. These correlations suggest a rather weak association between cirque development and the local-scale controls. However such an inference is misleading since a more penetrating analysis of these correlations indicates that cirque volume varies quite regularly with the process controls.
Table I. Correlation Coefficients* for Relationships Between Environmental Factors and Cirque Volume†

Second-order partial correlations are displayed below the principal diagonal of the correlation matrix (Table I). The bottom row gives the correlation between the natural logarithm of cirque volume and each environmental factor, partialed out on the other two process controls (Reference Overall and KlettOverall and Klett, 1972, p. 44). Note that the three local-scale controls have equivalent partial correlations with the natural logarithm of cirque volume. Most surprising is the partial correlation between bedrock joint density and the dependent variable. The simple product-moment correlation between these two variables is an insignificant 0.21, but their partial correlation is a highly significant 0.71 which implies that the relationship between cirque development and bedrock materials should not be studied independently from the factors controlling glacier mass balance and erosion potential (A and R in Equation (2)).
Reference TrenhaileTrenhaile (1976, p. 457) and Reference GordonGordon (1977, p. 188) show that there is no clear relationship between cirque orientation and cirque size, yet the Blanca Massif data indicate a statistically significant correlation between cirque volume and radiation reduction. One explanation for this apparent discrepancy is that cirque orientation is a relatively poor indicator of protection from insolation. Estimates of the reduction in mean radiation for cirques oriented toward the four primary quadrants in the Blanca Massif (Table II) suggest that cirque orientation is indeed a poor indicator of radiation reduction, although final judgment must await further data. Note that the single south-west-facing cirque (Como Cirque, Fig. 1) experiences a 19% reduction in potential radiation input due to the high (>4 200 m) peaks that are situated on its southern and eastern rim.
Table II. Relationship between Radiation Reduction and Cirque Aspect

The Blanca Massif data indicate that surrounding landforms profoundly affect the radiation inputs to individual cirques. The relationship between topography and radiation input should be considered fundamental to future research, particularly at higher latitudes where topographic shading should be accentuated (Reference Wendler and IshikawaWendler and Ishikawa, 1974, p. 216).
The correlation results suggest that there might be a non-additive interaction between the local-scale process controls. Accordingly, the correlation between the natural logarithm of cirque volume and the product ARJ was computed. Note that this interaction factor represents increasing erosion potential (the product AR) modified by an index of erosibility (J). The computed correlation coefficient is a highly significant 0.86 (α = 0.05), which implies a strong multiplicative interaction between the local-scale process controls. A partial-correlation analysis indicated that all three of the individual sub-components (A, R, and J) have statistically insignificant partial correlations with the natural logarithm of cirque volume when their interaction is taken into account. These last two findings support the notion that environmental factors combine multiplicatively (not additively) to influence intramountain variation in cirque development. Reference Chorlton and ListerChorlton and Lister (1971, p. 159) noted a similar interdependence between spatial controls in their study of glacier budget components.
A least-squares estimate for the parameters in an equation that relates cirque volume to the process controls gives:
The constants are significantly different from zero at α/2 = 0.025 with 21 degrees of freedom and the regression equation accounts for 74% of the variation in the sample of cirque volumes.
It is useful to view the product AR as an index of topoclimate, higher values representing glacially favorable topoclimatie situations and the opposite for low values. Differentiating Equation (10) with respect to the topoclimatie index gives
Equation (11) indicates that the relationship between topoclimate and cirque development depends upon bedrock jointing. Bedrock materials can interact with topoclimatie factors so as to enhance the link between cirque development and topoclimate (this would occur where an optimal topoclimate coincides with densely fractured bedrock); or, in situations where massive bedrock coincides with a favorable topoclimate, the geological factor can serve to dampen the topoclimate–landform link. This last finding underscores the need for some sort of control (statistical or experimental) over geologic factors in studies that propose to relate climate to glacial morphometry. Note that differentiating Equation (10) with respect to any of the local-scale controls yields an equivalent result; the relationship between cirque development and an individual process control depends upon the levels/values of the other controlling factors. For this reason it is difficult to assess the relative importance of individual process-related factors; they are completely interdependent (Reference HaynesHaynes, 1968, p. 233, reached a similar conclusion in her study of long profiles of cirques).
A basic assumption of this study is that a symmetry exists between process duration and topoclimatic situation (i.e. t ∝ AR). If this assumption is valid, then the appearance of the dependent variable in its own derivative (Equation (11)) implies a positive feedback (from form to process) in cirque development. As a cirque enlarges it becomes a more effective snow trap which in turn promotes a larger cirque glacier and more intense erosion. This inference is not unreasonable since Reference GordonGordon’s (1977, p. 193) data indicate a similar positive feedback mechanism in cirque evolution. Indeed Reference KingKing (1970, p. 198) has suggested that positive feedback is a characteristic feature of glacial geomorphic systems.
The greatest source of error in the model behind Equation (10) is a lack of information about the initial volumes of individual cirques. Clearly, cirque development reflects previous geomorphic history in addition to an interaction between the force of climate and the resistance of bedrock materials. Unfortunately, it is impossible to establish with any precision what the topography of an area was like before cirque erosion commenced (Reference Embleton and KingEmbleton and King, 1975, p. 215). The inclusion of a factor representing bedrock resistance (J) may partially compensate for the lack of any estimate of initial volume since it is possible (although not necessarily true) that preglacial hollows were larger in the more erosiblc materials.
Conclusion
Topoclimatic factors interact among themselves as well as with bedrock materials in their influence over spatial variations in cirque size. The potential for cirque erosion is greatest at sites that promote a positive glacier mass balance. Glacially favorable sites occur below high mountain summits (>4000 m within the Blanca Massif) and in positions relative to surrounding topography that minimize total daily radiation receipt. However, a glacially favorable topoclimate does not necessarily imply optimum cirque development, because the actual process of cirque enlargement is dependent upon an interaction between factors controlling the potential for, and resistance to, erosion.
Partial correlation coefficients suggest that altitude, radiation reduction, and bedrock joint density exert approximately equivalent control over cirque development when the other two factors are held constant. However, the multiplicative effect of the environmental factors (ARJ in Equation (10)) predominates over any independent influence. Notwithstanding its good fit to the Blanca Massif data, the model is merely an empirical expression for what is certainly a more complex relationship. When applied to another glaciated upland, Equation (10) might not hold due to the adverse effects of wind-induced snow redistribution, preglacial relief, and/or submergence beneath ice sheets.
While controlling factors are easy to identify at the conceptual level, their relationship to landform configuration is complex. When studied independently of each other, any one of the process-related factors may not correlate with a morphometric component simply because one, or several, of the other control factors are complicating the relationship of interest. As alpine geomorphologists increasingly couch their research within the framework of models that consider the possible interaction between controlling factors, a concomitant increment in the benefits that derive from morphometric analysis should emerge.
Acknowledgements
This research was part of a larger study on facies variation, glacial/periglacial processes, and Neoglacial palcoclimates, undertaken by the Department of Geography, University of Iowa, and supervised by Professor Neil E. Salisbury. Mr S. E. Morris assisted in the acquisition of bedrock jointing estimates. Drs W. L. Graf and C. E. Thorn provided valuable comments on an earlier version of this paper. Computer funds were provided by the Graduate School of the University of Iowa, Figures were produced by the Cartographic Services Facility, University of Maryland at College Park.


