


Introduction
The western part of Vatnajökull is located in the eastern volcanic zone above the centre of the Iceland mantle plume (Reference Wolfe, Bjarnason, Vandecar and SolomonWolfe and others, 1997). Meltwater produced at some of Iceland’s largest geothermal areas is collected in three subglacial lakes in this area, the western and eastern Skaftá cauldrons and Grímsvötn (Fig. 1), which is located above Iceland’s most active central volcano (Reference ThórarinssonThórarinsson, 1974). These lakes drain regularly in jökulhlaups: the Skaftá cauldrons drain underneath Tungnaárjökull over a distance of 30 km into the river Skaftá, while Grímsvötn drains 50 km underneath Skeiðarárjökull into the river Skeiðará. The western Skaftá cauldron drains every 1–2 years while the eastern cauldron usually drains every 2–3 years (Reference ZóphóníassonZóphóníasson, 2002). Jökulhlaups from Grímsvötn used to occur with a variable interval of 1–10 years (Reference BjörnssonBjörnsson, 2002). During the large jökulhlaup in November 1996, following the eruption in Gjálp, north of Grímsvötn, the ice dam of the lake was severely damaged causing continuous leakage until August 2000, when some meltwater started to accumulate again in Grímsvötn. Since then, five small jökulhlaups have been observed from Grímsvötn, the largest in October–November 2004.
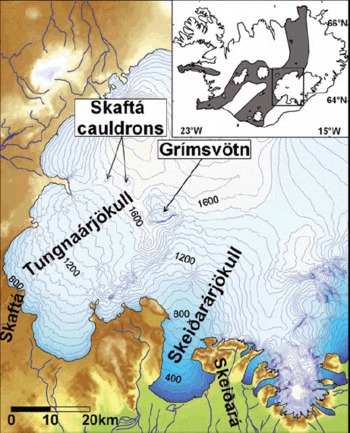
Fig. 1. The study area. The contour lines represent the glacier in 1995. The volcanic zones of Iceland are shown in grey in the inset.
The typical hydrographs for jökulhlaups in Skaftá and Skeiðará are different in shape. Jökulhlaups in Skeiðará usually have a long build-up time (1–2 weeks) increasing exponentially, with a peak flow ~1000 m3 s−1, and a rapid decline (1–2 days). The typical hydrographs for jökulhlaups in Skaftá rise almost linearly for 1–2 days, with peak flow of 300–1300 m3 s−1, which is followed by a roughly exponential decrease over several days (Reference BjörnssonBjörnsson, 1977, Reference Björnsson1992, Reference Björnsson2002; Reference ZóphóníassonZóphóníasson, 2002).
The shape of typical hydrographs of Skeiðará jökulhlaups has been explained by invoking tunnel flow (Reference NyeNye, 1976; Reference BjörnssonBjörnsson, 1992, Reference Björnsson2002). The sudden rise in the discharge during jökulhlaups in Skaftá, however, suggests sheet flow or coupled sheet and tunnel flow (Reference BjörnssonBjörnsson, 1992, Reference Björnsson2002; Reference Flowers, Björnsson, Pálsson and ClarkeFlowers and others, 2004). The jökulhlaup following the Gjálp eruption in 1996 (peak flow between 4 × 10⁴ and 5 × 10⁴ m3 s−1 (Reference Björnsson and HaraldssonBjörnsson, 1997; Reference Snorrason and HaraldssonSnorrason and others, 1997)) did not reveal tunnel flow characteristics (Reference BjörnssonBjörnsson, 1997, Reference Björnsson2002; Reference JóhannessonJóhannesson, 2002). Jökulhlaups of this magnitude are beyond the scope of this paper, the jökulhlaups discussed here being much smaller.
Due to the shortage of ice motion data, no comprehensive studies have been carried out on how jökulhlaups in Skeiðará and Skaftá influence the glacier ice flow. This has improved since the advent of satellite-borne interferometric synthetic aperture radar (InSAR) which has enabled us to study the flow field of glaciers during jökulhlaups. InSAR has been used to map glacier flow since the early 1990s (e.g. Reference Goldstein, Engelhardt, Kamb and FrolichGoldstein and others, 1993; Reference Joughin, Winebrenner and FahnestockJoughin and others, 1995). InSAR has also proven useful in identifying subglacial water transport (Reference Gray, Joughin, Tulaczyk, Spikes, Bindschadler and JezekGray and others, 2005). Several InSAR studies have been conducted on Vatnajökull. In all cases data from the ERS-1/ERS-2 (European Remote-sensing Satellite) tandem mission with 24 hour repeat observations, available at specific dates between May 1995 and March 2000, were used. Because of the short repeat interval, so far this has been the only satellite dataset usable for interferometric studies on temperate glaciers such as Vatnajökull, that undergo rapid surface changes. InSAR was used to analyze the displacement field around the eruption site of Gjálp following the eruption in 1996 (Reference Rott and SiegelRott and Siegel, 1998; Reference Alsdorf and SmithAlsdorf and Smith, 1999; Reference Björnsson, Rott, Gudmundsson, Fischer, Siegel and GudmundssonBjörnsson and others, 2001; Reference Gudmundsson, Gudmundsson, Björnsson, Sigmundsson, Rott and CarstensenGudmundsson and others, 2002a). Reference Fischer, Rott and BjörnssonFischer and others (2003) used InSAR to study surges on Vatnajökull.
Grímsvötn and the Skaftá cauldrons have also been studied specifically with InSAR. Reference Jónsson, Adam and BjörnssonJónsson and others (1998) used InSAR data to investigate the displacement field around the western Skaftá cauldron after a jökulhlaup in August 1996. Reference Björnsson, Rott, Gudmundsson, Fischer, Siegel and GudmundssonBjörnsson and others (2001) applied InSAR to study the infilling of the Skaftá cauldrons from January 1997 to January 1999, as well as the surface displacement of the floating ice cover of Grímsvötn for the same period. Both of these studies focused on the jökulhlaup source shortly after or between jökulhlaups. In this paper the focus is on a new topic, namely the effects of the subglacial floodwater on glacier flow during jökulhlaups from Grímsvötn and the Skaftá cauldrons, using a unique InSAR dataset.
Methods
In order to estimate the flow field of glaciers we follow the approach of Reference Reeh, Mohr, Madsen, Oerter and GundestrupReeh and others (2003), who derived the threedimensional flow field on Storstrømmen, Greenland, by combining interferometric radar line-of-sight (LOS) velocities from ascending, v a, and descending, v d, orbits and the mass continuity equation. The three velocity vectors v e, v n and v u (e, n and u stand for east, north and up) can then be derived from the equations:
where S is the surface elevation, H the glacier thickness and F the ratio of the average velocity in a vertical ice column to the surface velocity. For isothermal glaciers like Vatnajökull we expect F to be between 0.8, corresponding to deformation alone (Reference PatersonPaterson, 1994), and 1, corresponding to sliding alone. In our calculations we assume F equal to 0.9. From numerical experiments with the data, we know that variations from F = 0.9, within the given limit, can cause errors in the velocity components of a few centimetres per day.
If the horizontal flow direction, α, measured counterclockwise from the east, is known, Equation (1) or (2) can be replaced by:
For Skeiðarárjökull the velocity field was first calculated from Equations (1–3) using an ascending scene from 29 to 30 December 1995 and a descending scene from 27 to 28 December 1995 (Table 1). It is reasonable to assume that α is constant in time as long as the changes in surface topography over the study period are very small, as in our case. The derived horizontal flow direction was therefore used as an input to the calculations for the March 1996 scene. In the case of Tungnaárjökull this was not possible because of the lack of coincident InSAR data from opposite orbits. We therefore aligned α along the slope direction of the glacier surface, smoothed with filters with width corresponding to ten times the ice thickness at each location. A weighted-average filter was used with the weight decreasing linearly with distance from the centre pixel as suggested by Reference Kamb and EchelmeyerKamb and Echelmeyer (1986).
Table 1. The interferograms used in the study to map glacier flow

Solutions of Equations (1–3) were derived for Storstrømmen by iteration, starting with the right side of Equation (3) equal to zero (Reference Reeh, Mohr, Madsen, Oerter and GundestrupReeh and others, 2003). In the case of the Vatnajökull outlets, the iteration diverged both when ascending and descending orbits were combined and when α was prescribed using Equation (4). This is presumably due to higher spatial variability in the glacier flow than on Storstrømmen, and the more complex subglacial topography. Therefore, the velocities were derived using Markov random field regularization, optimized with simulated annealing (Reference Gudmundsson, Sigmundsson and CarstensenGudmundsson and others, 2002b), which is a computationally much slower approach. During the simulated annealing, carried out at resolution of 100 m x 100 m, a box filter of size 500 m × 500 m was applied to the flow divergence since spatial variability of higher frequency in the flow divergence is assumed to be physically not retrievable (Reference Reeh, Mohr, Madsen, Oerter and GundestrupReeh and others, 2003). Areas were masked out in the retrieved velocity fields where the residuals of the equations used in the simulated annealing optimization corresponded to phase signal >π rad at the end of the optimization. That corresponds to half a fringe in an interferogram. One fringe (a phase difference of 2π) in ERS SAR (wavelength 5.66 cm) interferograms corresponds to a LOS displacement of 2.83 cm. Usually the residuals are much smaller than half a fringe.
Prior to the simulated annealing optimization, the InSAR data were topographically corrected, unwrapped and geometrically transformed to map projection. The digital elevation model (DEM) used for Tungnaárjökull is from 1998 (Reference DallDall, 2003; Reference Magnússon, Björnsson, Dall and PálssonMagnússon and others, 2005) and for Skeiðarárjökull from 1997 (Reference Bacher, Bludovsky, Dorrer, M–nzer, Oltan and Gr–ndigBacher and others, 1999). The complete Tungnaárjökull DEM was corrected using global positioning system (GPS) data, acquired by the Institute of Earth Sciences, University of Iceland, to represent the time when the InSAR data were obtained. Only the lower part of Skeiðarárjökull (<700 m a.s.l.) was corrected in the same way, due to lack of GPS data. From mass-balance studies and GPS surveys, conducted during the last 15 years on other outlet glaciers of Vatnajökull (Reference BjörnssonBjörnsson and others, 1998, Reference Björnsson2002) and coincident GPS measurements (unpublished data at the Institute of Earth Sciences, University of Iceland), we know that surface topography changes in higher areas are small over 1.5 years, except during surges. Therefore it can be concluded that both DEMs are correct within at least 10 m for the given dates. For a scene from 2–3 October 1995 at Tungnaárjökull and another from 27–28 March 1996 on Skeiðarárjökull (Table 1) minor phase corrections (<2 rad) were carried out on the lower part of the glacier (<1200 m a.s.l. on Tungnaárjökull, <600 m a.s.l. on Skeiðararjċkull) to compensate for the impact of ice surface lowering during 1 day due to ablation, using a degree-day ablation model and temperature from a nearby weather station. The remaining error in the derived LOS velocities, mostly atmospheric, should generally correspond to less than half a fringe in the InSAR data.
In some areas part of the LOS velocities detected may be caused by redistribution of subglacial water forcing local rise or subsidence of the glacier surface. In the scene from March 1996 on Skeiðarárjċkull a clear sign of subglacial water accumulation was detected at one location, which we also took into account directly before retrieving the large-scale motion field (see next section) since Equations (1–4) do not account for this.
Observations
The impact of the March 1996 jökulhlaup on Skeiðarárjökull
The jökulhlaup in Skeiðará́ in March–April 1996 was the last typical jökulhlaup in the river before the eruption in Gjálp later that year and the resulting jökulhlaup. Only one InSAR pair (Fig. 2b) of Skeiðararjċkull was obtained during the jökulhlaup, on 27–28 March 2006, just at the beginning when the discharge had only reached 1/15 of the 3000 m3 s−1peak (Fig. 3). We observe in this InSAR scene that the Grímsvötn ice sheet is subsiding, but the spatial resolution of the data is too low to observe all fringes and derive the volume of the water outflow over 24 hours. By comparing the March 2006 interferogram with that from 29–30 December 1995 (Fig. 2a), we observe a significant difference in the LOS velocity on Skeiðarárjċkull, while in other areas it shows little change.

Fig. 2. Topographically corrected interferograms of Skelðarárjökull, superimposed on radar amplitude images from (a) 29–30 December 1995 during cold and dry winter conditions and (b) 27–28 March 1996 during the initial phase of the jökulhlaup.

Fig. 3. The hydrograph for the jökulhlaup in Skeiðará in March–April 1996 (Reference Snorrason and HaraldssonSnorrason and others, 1997). The time when the ERS-1/ERS-2 tandem pair was derived is shown on the graph.
In the interferogram from 27–28 March we observe a LOS displacement of 13 cm (4.5 fringes) at a location where the horizontal flow is close to the across-track direction of the satellite path and consequently the sensitivity of the interferometric signal to horizontal flow is very small. Interpreted as purely horizontal displacement in the flow direction, α, from December 1995, we would get more than 6 m displacement at the location where the peak of this signal is observed. Therefore it is not possible to derive a reasonable solution for the three-dimensional flow field from the topographically corrected InSAR data in this area directly from Equations (1), (3) and (4). However, the sensitivity of the interferogram to the various flow directions points out that this local maximum of LOS displacement was mainly related to vertical motion. We propose that this was caused by water accumulation in the jökulhlaup flood path, either in a subglacial water pocket between the ice and the bedrock/till or in a till layer underneath the ice that caused the till to expand (Reference ClarkeClarke, 1987; Reference Truffer, Echelmeyer and HarrisonTruffer and others, 2001). To estimate the glacier uplift due to water accumulation (Fig. 4) we first simulate the LOS velocity for the geometry of the March scene using the velocities derived in December 1995 without such an event. The March LOS velocities are on average around 2.6 times the December LOS velocities for the area shown in Figure 4. According to our hypothesis, a significant part of the residual obtained when subtracting the December LOS velocities (corresponding horizontal flow field shown in Fig. 5a) multiplied by a factor of 2.6 from the March LOS velocities is caused by redistribution of basal water. From that we derive up to 15 cm uplift of the glacier surface due to water accumulation in an area of ~7 km2 (Fig. 4). The volume of the floodwater accumulated corresponds to a flow rate of 4 m3 s−1 over 24 hours. Based on this estimate, the InSAR data were corrected prior to deriving the three-dimensional flow (horizontal flow field shown in Fig. 5b), since Equations (1), (3) and (4) do not account for this local effect. The rest of the interferogram from 27–28 March 1996 (Fig. 2) looks rather smooth, with only a few small bull’s-eye patterns of 1–2 fringes, which could indicate minor redistribution of floodwater. We therefore conclude that only a small part of the LOS displacement could have been due to redistribution of floodwater in other parts of Skeiðarárjökull.

Fig. 4. Estimated vertical uplift in centimetres due to water accumulation, 27–28 March 1996, during the initial phase of the jökulhlaup. Prior to the simulated annealing optimization a phase corresponding to the uplift shown in the corner image (in centimetres) was subtracted from the unwrapped topographically corrected phase. The black line in the main image shows the estimated flood path of the jökulhlaups in Skeiðará, using static pressure potential.

Fig. 5. The horizontal velocity field (a) at the end of December 1995 derived from ascending (29–30 December) and descending (27–28 December) InSAR pairs and (b) on 27–28 March 1996 during the beginning of the jökulhlaup, derived from a single ascending pair. The light blue curve in (b) shows the estimated flood path of the jökulhlaups in Skeiðara, using static potential. The glacier surface velocity in December and March on three cross-sections is shown in (c). The cross-section locations are shown in (b). W and E indicate west and east end of the cross-sections on the graph.
When we compare the derived velocity field during the jökulhlaup with the velocity field in December 1995 (Fig. 5), we observe an up to three-fold velocity increase. The area affected was up to 8 km wide and we observe that the velocity increase propagated upwards to an area to which no floodwater could possibly have drained (Fig. 5b and c). Two InSAR scenes are available after the jökulhlaup, namely 10–11 April and 12–13 April 1996. Both these scenes show a clear sign of subsidence near the area where water accumulation was detected during the beginning of the jökulhlaup. This may be the aftermath of the jökulhlaup or merely related to the rainfall occurring on the days before these InSAR scenes were obtained. We have observed subsidence of the glacier in other InSAR scenes of this area shortly after rainfall (unpublished data at the Institute of Meteorology and Geophysics, University of Innsbruck).
The impact of the October 1995 jökulhlaup on Tungnaárjökull
The jökulhlaup in early October 1995 was atypical for Skaftá. It was small, with a maximum flow of 60 m3 s−1. Discharge of >40 m3 s−1 persisted for almost a week and the flood lasted for almost 2 weeks (Fig. 6), in contrast to the usual flood time-span of several days. From an interferogram of 2–3 October we observe 25 cm LOS displacement (9 fringes) northeast of the eastern Skaftá cauldron, compared to 10 cm LOS displacement (3.5 fringes) on 16–17 September 1995 (Fig. 7). In both cases the signal of the eastern cauldron itself is decorrelated. At the same time we observe 12 and 9 cm uplift at the centre of the western Skaftá cauldron for 16–17 September and 2–3 October, respectively. Since it is unlikely that much water could drain from the area reaching 3 km northeast of the eastern cauldron (Fig. 7) we conclude that the increased LOS displacement on 2–3 October in this area is caused by increased ice flux towards the cauldron, triggered by water draining from the eastern Skaftá cauldron. This was unexpected as the largest jökulhlaup in Skaftá (total volume) since 1970 drained from that cauldron only 3 months earlier, in July 1995 (Reference ZóphóníassonZóphóníasson, 2002). From the interferogram of 2–3 October 1995 we also derive a significant increase in glacier ice flow on Tungnaárjökull, relative to the derived flow field for 18–19 September 1995 (Fig. 6). The area affected spread out to as close as 7 km short of the glacier margin. This suggests that the flood had reached this area not later than 1100 h on 3 October, 1.5 days before floodwater reached the glacier margin, which would mean that the speed of the floodwater front on the last day before reaching the margin was hardly more than 0.2 km h−1 or 0.6 m s−1.

Fig. 6. (a) The jökulhlaup hydrograph (unpublished data from the National Energy Authority database, personal communication from S. Zóphóníasson, 2006). The flow is measured at Sveinstindur, around 20 km from the river outlet at the glacier margin, but it has been shifted back by 8 hours, corresponding to the time it takes the water to flow this distance. (b) Contour map of the surveyed area. (c–g) The horizontal flow field before (c), during (d–f) and after the jökulhlaup (g). The dates corresponding to each motion field are shown on the hydrograph (a). The blue curves (b–g) show the estimated path of the jökulhlaup in Skaftá, and the red curves (b–g) show the estimated water divides of Skaftá (Magnúson and others, 2004).

Fig. 7. Topographically corrected interferograms superimposed on radar amplitude images, from (a) 16–17 September 1995 and (b) 2–3 October 1995, both from descending orbits, with significantly increased LOS displacement on 2–3 October northeast of the eastern cauldron, indicating that water is draining from that cauldron.
Three interferograms, obtained during the rise and at the peak of this jökulhlaup, covering the whole or parts of Tungnaárjökull, were used to derive three-dimensional flow fields of the glacier (horizontal flow fields shown in Fig. 6). Decorrelation of the interferometric signal due to surface changes caused gaps in the flow fields in addition to those areas where the simulated annealing did not produce a good solution.
Subglacial accumulation or release of floodwater during the jökulhlaup might affect our results to some degree. If water volume corresponding to the peak flow of the jökulhlaup (60 m3 s−1) over 24 hours were distributed evenly over the area affected by the jökulhlaup, the thickness of the layer would, on average, correspond to LOS displacement of 2.9 cm (~1 fringe). The extreme case of such a difference in water input from the cauldron and water output at the margin is most likely to occur during the beginning of the jökulhlaup. The first two scenes obtained during the beginning of the jökulhlaup (2–3 October and 5–6 October, 1995) are from descending orbits, which means that LOS displacement due to uplift of the glacier due to water accumulation has a sign opposite to that of LOS displacement induced by horizontal flow. The flow velocities for these dates are therefore more likely to be being underestimated. Possible errors caused by this do not change the regional flow pattern but are mostly localized in areas where we observe ‘bull’s-eye’ patterns in the interferograms, in some cases up to 4 phase fringes 1–2 km in diameter. However, since the contribution from glacier ice flow to the LOS velocity is high at these locations, it is more difficult to discriminate between the glacier ice flow and vertical movements caused by redistribution of basal water than at the location on Skeiðarárjökull shown in Figure 4. The separation of InSAR motion into these two components was therefore omitted.
The jökulhlaup occurred at the end of a surge in Tungnaárjökull (Reference Björnsson, Pálsson, Sigurðsson and FlowersBjörnsson and others, 2003), shortly before a peak of a surge in Sylgjujökull, an outlet north of Tungnaárjökull (Fig. 6). Since the derived flow fields are influenced by surge movements we compare flow fields during the jökulhlaup with flow fields derived from InSAR tandem data both before (18–19 September 1995) and after (21–22 October 1995) the jökulhlaup.
From the derived horizontal velocity fields before, during and after the jökulhlaup (Figs 6 and 8) we observe a velocity increase from 0.2 to 0.8 m d−1 in some areas. A large part of Tungnaárjökull moves 2–4 times faster during the initial phase of the jökulhlaup, before the peak discharge is reached, than either before or after it. The area affected by the jökulhlaup was at least 9 km wide. On reaching peak discharge, however, the glacier above the estimated flood path (Reference Magnússon, Björnsson, Pálsson and DallMagnússon and others, 2004), halfway down to the margin, slowed to velocities similar to those observed before the jökulhlaup (Fig. 8a). At the same time the area north of it, extending into the estimated river basin of Tungnaa (Fig. 8c), did not slow down.

Fig. 8. (a) The derived horizontal velocities on three cross-sections over Tungnaárjökull before, during and after the jökulhlaup. (b) The corresponding dates and (c) the location of the cross-sections. The estimated river basins of Skaftá and Tungnaá are outlined in (c) (Reference Magnússon, Björnsson, Pálsson and DallMagnússon and others, 2004). The colour image in (c) shows the horizontal displacement rate on 2–3 October 1995. N and S indicate north and south end of the cross-sections on the graph.
Discussion
The widespread impact of the studied jökulhlaups on glacier motion is remarkable. The jökulhlaup discharge at the time of the InSAR observations of Skeiðarárjökull in March 1996 was only ~200 m3 s−1 (Fig. 3), which is less than the normal discharge in Skeiðará during the summer (personal communication from S. Zóphóníasson, 2006). The peak flow during the jökulhlaup in Skaftá was around 60 m3 s−1. That is comparable to normal summer discharge draining from the glacier into the western branch of Skaftá (personal communication from S. Zóphóníasson, 2006), into which the flood-water drained. The background discharge during the time of the InSAR observations was ~25 and 15 m3 s−1, for Skeiðará and the western branch of Skaftá, respectively (personal communication from S. Zóphóníasson, 2006). In some of the other InSAR data acquired over these outlets during summers, we found that normal summer discharge has less effect on glacier sliding than the jökulhlaups, presumably because in summer water drains through a well-developed tunnel system (Reference RöthlisbergerRöthlisberger, 1972; Reference ClarkeClarke, 2005; Reference Lappegard, Kohler, Jackson and HagenLappegard and others, 2006). This implies that during the beginning of both jökulhlaups at least some of the water drained under the glacier as sheet flow several kilometres wide, enhancing basal lubrication, hence increasing sliding. Whether the increased sliding occurs at the boundary between ice and bedrock/till (Reference KambKamb, 1987) or due to increased deformation of a till layer beneath the ice (Reference ClarkeClarke, 1987; Reference Truffer, Echelmeyer and HarrisonTruffer and others, 2001) cannot be concluded from our observations.
The observations at the eastern Skaftá cauldron, however, show no significant velocity increase over the first 6 km of the flood path, suggesting that in this upper section of the glacier the floodwater drained through a tunnel the whole time. Both jökulhlaups occurred outside the main melting season and the discharge rates were relatively small compared to many other jökulhlaups (Reference BjörnssonBjörnsson, 2002). Tungnaárjökull was, in addition to that, at the end stage of a surge where we expect the water flow to be distributed (Reference KambKamb, 1987; Reference BjörnssonBjörnsson, 1998). Well-developed tunnel systems during the summer, under a non-surging glacier, might be able to transport jökulhlaups of similar size to those studied here without significant impact on the glacier flow. It is plausible that under those circumstances little floodwater would be distributed outside a tunnel system.
The slowdown of the sliding observed over the estimated flood path on Tungnaárjökull during the peak of the jökulhlaup suggests evolution from sheet flow to tunnel flow. Flood outlet formation indicates similar evolution during much larger jökulhlaups (Reference BjörnssonBjörnsson, 1974; Reference Snorrason and HaraldssonSnorrason and others, 1997; Reference Roberts, Russell, Tweed and KnudsenRoberts and others, 2000), which modellers have been able to simulate (Reference Flowers, Björnsson, Pálsson and ClarkeFlowers and others, 2004). The reason for the velocity increase in the area north of the flood path, which extended into the Tungnaa river basin (Fig. 8) and retained its fast flow during the peak of the jökulhlaup, is not obvious. However, the data from Skeiðarárjökull also show that forces related to ice-flow acceleration may propagate to areas beyond the sphere of the floodwater (Fig. 5c). The interpretation of the data is complicated by the observation that the ice basin of Tungnaárjökull and the river basin of Skaftá do not coincide (Reference Magnússon, Björnsson, Pálsson and DallMagnússon and others, 2004). The dynamic effects of the floodwater and ice-flow acceleration at Tungnaárjökull could, therefore, in a similar manner, have propagated west and downwards (instead of upwards in the case of Skeiðarárjökull) into a region of a surge in its closing stage (Reference Björnsson, Pálsson, Sigurðsson and FlowersBjörnsson and others, 2003) (Fig. 6). Alternatively, some water from the jökulhlaup may have drained into this area, where it may have entered the linked cavity system of the surging glacier, restricting the water flow, increasing basal water pressures and resulting in enhanced sliding (Reference KambKamb, 1987). A similar phenomenon occurred in September 1991 when a jökulhlaup from Grímsvötn was halted by a surge in Skeiðarárjökull (Reference BjörnssonBjörnsson, 1998).
Conclusions
By analyzing InSAR data from the ERS-1/ERS-2 tandem mission we are able to study the dynamic response of two glacier outlets of Vatnajökull, during jökulhlaups. On Skeiðarárjökull, on 27–28 March 1996, we observe an up to three-fold velocity increase during the initial phase of a jökulhlaup, in an area up to 8 km wide. On this type of glacier, water is assumed to flow in winter through a distributed or linked cavity system (Reference WalderWalder, 1986; Reference KambKamb, 1987; Reference Lappegard, Kohler, Jackson and HagenLappegard and others, 2006). Such a system is not able to conduct the rising water flow of a jökulhlaup, which results in increased subglacial water pressure and may also cause mechanical uplift by forcing the water into areas around flow channels (Reference Hubbard, Sharp, Willis, Nielsen and SmartHubbard and others, 1995). These effects are confirmed by the InSAR analysis, when, during the early phase of the jökulhlaup, water accumulated at one location in the path of the jökulhlaup corresponding to 4 m3 s−1 discharge over 24 hours, causing uplift of an area of ~7 km2 by a maximum value of 15 cm.
On Tungnaárjökull, InSAR data enabled us to locate the source of a small jökulhlaup that came from the eastern Skaftá cauldron in October 1995. Deduced from the same InSAR scene, a stable ice velocity field indicated that water drained in a tunnel from the cauldron for the first 6 km of the flood path. Further downstream we observed widespread impact of the jökulhlaup water on glacier sliding (up to a four-fold increase over a 9m wide area) suggesting sheet flow or coupled sheet and tunnel flow during the initial phase of this jökulhlaup, similar to the initial phase of the jökulhlaup in Skeiðará, a few months later. Furthermore, we conclude from the affected area that the floodwater had reached 23 km downstream from the cauldrons (7 km from the glacier margin) 1.5 days before the jökulhlaup water emerged at the edge. Hence, the speed of the water front for this last 7 km to the river outlet was not more than 0.6 m s−1. Slowdown of the glacier sliding above the estimated flood path, once the discharge of the jökulhlaup in Skaftá peaks, however, implies that the sheet flow breaks down into a tunnel flow, rapidly conducting the floodwater.
The phenomena observed in the InSAR data presented, obtained during these jökulhlaups, provide important hints on subglacial hydraulic processes.
The glacier acceleration observed in the early phase of both jökulhlaups confirms the concept that rising water pressure due to increased water inflow in a slow-flowing hydraulic system forces water into areas outside the channels and reduces the coupling of ice with the glacier bed, thus triggering instability of ice flow (Reference ClarkeClarke, 1987, 2005; Reference Hubbard, Sharp, Willis, Nielsen and SmartHubbard and others, 1995; Reference Iverson, Hanson, Hooke and JanssonIverson and others, 1995).
Acknowledgements
The ERS-1/ERS-2 tandem data were made available by the European Space Agency through projects AO3.108 (VECTRA) and AO3.239. The DEM obtained with EMISAR in 1998 was used courtesy of Ørsted-DTU, Denmark. This work is a part of E.M.’s PhD work at the University of Innsbruck, which is supported by the Bertha von Suttner Foundation, the Icelandic Centre for Research, Landsvirkjun and the Memorial Foundation of Helga Jónsdóttir and Sigurliði Kristjánsson. The Icelandic Road Administration supported part of this work. We thank T. Nagler and F. Müller for help with processing the InSAR data. S. Guðmundsson is thanked for valuable advice regarding the simulated annealing computations. We thank S. Zóphórníasson at the National Energy Authority for supplying discharge data and E. Sveinbjörnsson at the Icelandic Meteorological Office for supplying meteorological data. F. Tweed and an anonymous reviewer are thanked for very constructive and helpful reviews.


