Introduction
The Quelccaya ice cap (lat. 13°56’S., long. 70°50’W.) in the Cordillera Oriental of southern Peru has a maximum elevation of 5 650 m and is uniquely suited for the application of ice–core climatic techniques. Initial results from the climatic ice–core studies and glaciological investigations have been published (Reference ThompsonThompson and others, 1979; Reference ThompsonThompson, 1980). The central objective of the field research program remains the retrieval of one or more ice cores to bedrock, from which a climatic history for tropical South America will be reconstructed on the basis of microparticle and oxygen–isotope analyses. The work of Quelccaya expeditions in 1978 and 1979 included ice thickness determinations using gravity survey and mono–pulse ice radar sounding techniques. In addition, a study of the variation of the largest outlet glacier over a 15 year period was accomplished by means of aerial and terrestrial photogrammetry to assess one measure of the stability of the ice cap system.
Gravimetry
A west–east traverse was made across the ice cap along the route indicated on the map in Figure 1. The techniques used are similar to those employed by Reference LittlewoodLittlewood (1952) and Reference BullBull and Hardy (1956). A Worden geodetic gravity meter was used and the station positions and elevations were determined by triangulation and trigonometric levelling.
Free-air and Bouguer corrections have been applied to measured station gravity values assuming that all the material under the stations has a density of 2.6 – 103 kg m–3. “Deficiencies” in the Bouguer anomalies at ice–cap stations, compared with those on rock adjacent to the ice, are attributed directly to the replacement of material of density 2.6 – 103 kg m–3 by ice of density 0.9 – 103 kg m –3. This is equivalent to 1 mgal deficiency Figure 1 Figure 2 representing 14 m of ice. An initial analysis of the gravity data has been completed without application of terrain corrections. The ice depths and bedrock topography obtained are presented in Figure 2. Additional potential errors in these results arise from the assumption for the mean density of rock in the area and the possibility of the occurrence of a low–density drift layer of unknown thickness at least in some locations along the traverse.

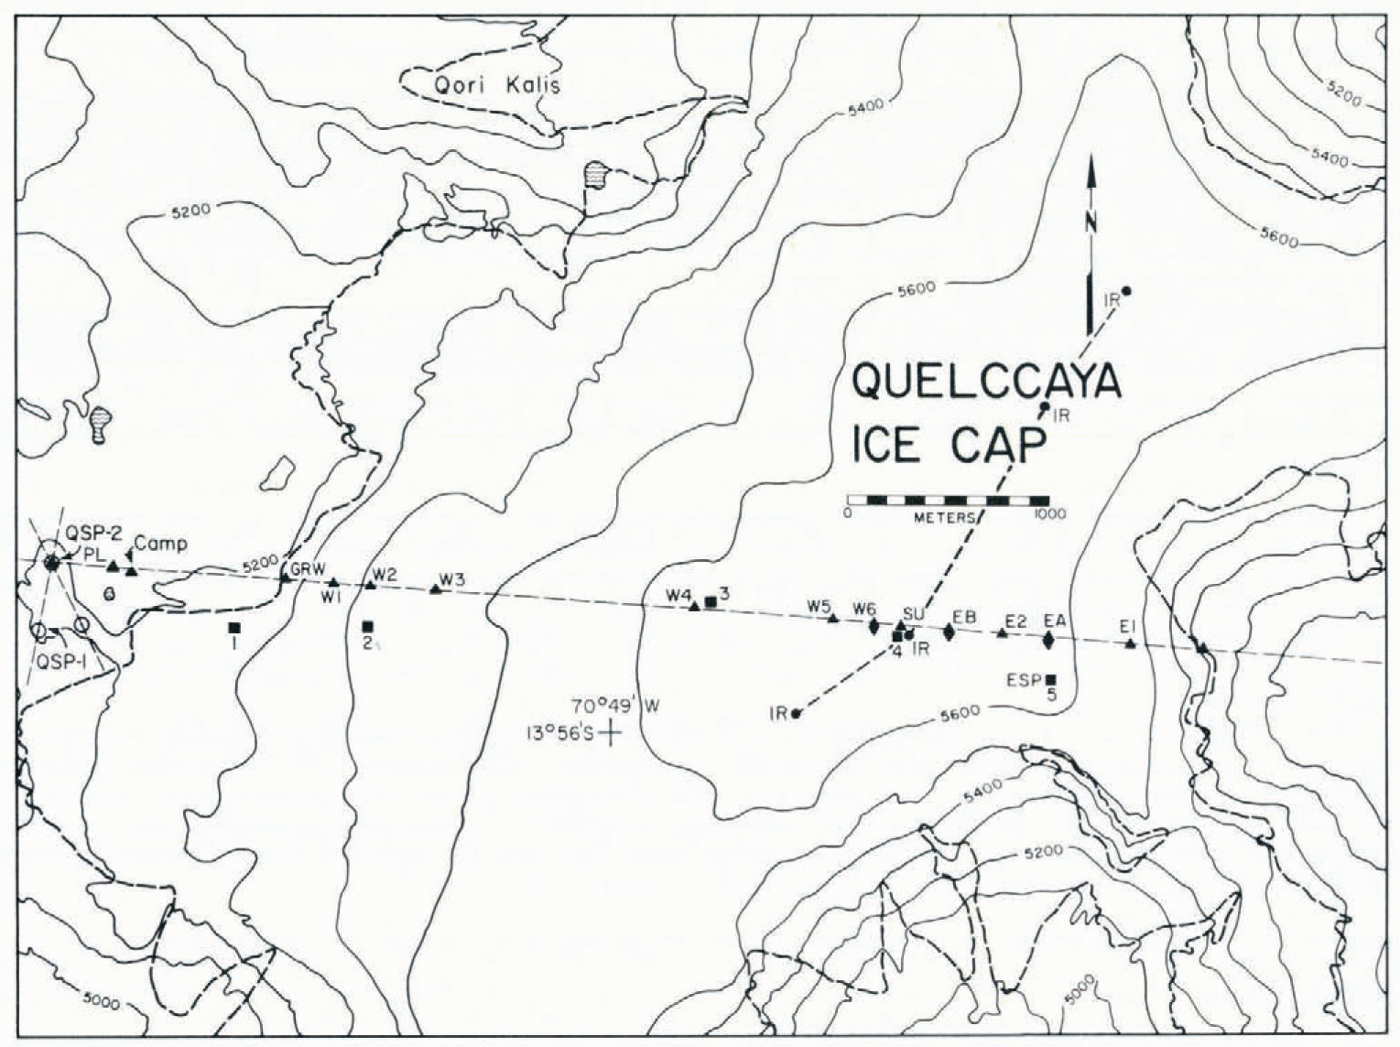
Fig. 1. This map illustrates the central section of the Quelccaya ice cap. The dashed line represents the edge of the ice. Along the transects, triangles represent survey sites where gravity measurements were made, circles represent mono–pulse ice radar sounding sites, diamonds represent survey sites and squares indicate where ice–core samples for microparticle, oxygen isotope, and total β radioactivity were taken to a depth of 8 m or more.

Fig. 2. Ice depths and bedrock topography as determined from the west–east gravity survey are shown. Symbols along base line are the same as those in Figure 1. The thickest ice occurs along the west–east traverse at the summit of the ice cap.
Mono–pulse ice radarsoundings
Radio echo–sounders have been used successfully for sounding cold polar ice since the early 1960’s (Reference RobinRobin, 1975[a]) but were not generally successful on warm temperature glaciers where the echo from the ice–bedrock surface may be obscured by echoes from water–filled pockets in ice (Reference SmithSmith and Evans, 1972; Reference WattsWatts and England, 1976). Appreciating this, Vickers and Bollen have developed a temperature glacier sounder at the Stanford Research Institute under contract to the U.S. Geological Survey.
Since the Quelccaya ice cap is temperate (Reference ThompsonThompson, 1980), a glacier sounder was constructed in 1979 for temperate ice using designs furnished by S. Hodge (U.S. Geological Survey, Tacoma, personal communication). The equipment consists of a transmitter, used to generate voltage steps a few hundred volts in amplitude, and identical transmitting and receiving antennas. The antennas, resistively loaded dipoles tuned to radiate a single cycle at 5 MHz, were placed directly on the surface and separated by 50 to 100 m. Since signal levels were strong, the receiving antenna was coupled directly to an oscilloscope from which the data were recorded on Polaroid film. The oscilloscope time base, calibrated prior to going into the field, was used as the reference for all time measurements. Recording the signals in this manner permitted measurements of travel time, amplitude, and relative phase at several discrete points on the ice cap (Fig. 1). However, the wide separation between sample points created difficulties in interpreting some of these results.
Examples of radar data collected on the Quelccaya ice cap are shown in Figure 3. The complete wave train (Fig. 3a) includes the surface wave which travels along the upper surface of the air–snow interface, arrivals scattered from features within the ice, and a strong echo at about 1.5 μs which is interpreted as the reflection from the ice–rock boundary. None of the waves interpreted as reflections from the ice–rock interface appear to be distorted nor are there any strong arrivals later than the bedrock reflection, suggesting that the bedrock is relatively smooth.
Complications which arose in some of the collected data are also shown in Figure 3. An occasional, unexplained distortion of the transmitted wave (Fig. 3b) made it difficult to relate like parts of the transmitted and reflected waves for travel–time measurements. An oscilloscope triggering malfunction resulted in a partial loss of the transmitted wave (Fig. 3c) creating some zero–time uncertainty.

Fig. 3. These are typical echograms obtained along the north–south crest of the ice cap. In each echogram the letter A indicates the surface wave and the letter B indicates the bottom reflection. The return echoes are well defined, which is typical of a relatively flat bedrock surface. A complete wave train from the plateau south of the Summit dome is illustrated in a. The wave train in b is from the saddle between the North and Summit domes, while the wave train in c is from the Summit dome.
Travel–time measurements were made by correlating peaks and troughs on the transmitted and reflected pulses, taking into account the relative phase of the reflected pulse. Measurements were straightforward (Fig. 3a) where the entire wave train was recorded, but in some cases where the initial part of the transmitted pulse is missing, travel–time measurements could still be made by correlating the latter part of the transmitted pulse, which was recorded, with the appropriate part of the reflected pulse. (It is assumed that the form of the transmitted pulse is known from the complete wave trains and that the form does not change with time.) The measuring error is estimated to be less than ±0.05 μs for all the data except those displaying the extreme distortion of the transmitted pulse. For these data an error of ±0.1 μs is assumed.
The average wave speed V used to reduce the travel–time measurements into thicknesses, was calculated by estimating the average density, ρ, of the calculated ice column and Reference RobinRobin’s (1975[b]) empirical relation
where c is the wave speed in a vacuum. Density has been measured to a depth of 11 m on the Quelccaya ice cap (Reference ThompsonThompson, 1980). Reference VallonVallon and others (1976) find that firn on a temperate glacier in France approaches full density (ice) at 30 m and therefore, the Quelccaya density data have been linearly extrapolated to reach ice at 30 m. To investigate the effect of this assumption (Equation (1)), two limiting curves corresponding to full density at 25 and 35 m were calculated. Using these models of density and total ice thicknesses of 120, 150. and 180 m, average wave speeds fell in the range between 171 and 174 m μs–1. Therefore, an average wave speed of 172 ± 2 m μ s –1 was adopted where the error represents the estimate of speed extrema. It is unlikely that the wave speed is significantly less than this value. If the ice density remains low to depths greater than 35 m, the average speed will increase as will the computed ice thicknesses. Therefore, in the worst case, the computed ice thicknesses are minimum values.
The total ice thickness H is found by incorporating the measured travel times T, the average wave speed V , and the antenna separation s, into the formula

The calculated thicknesses H are illustrated in Figure 4.
Depth–age calculations for the Quelccaya ice cap
Future work on the Quelccaya ice cap calls for the recovery of one or more ice cores to bedrock. In this section we attempt to estimate the length of the climatic record potentially available from these cores. Our general approach will be to envisage the simplest dynamical environment consistent with our current knowledge of the Quelccaya ice cap in order to obtain an estimate of possible upper and lower bounds on the potential depth–age profile.
Previous work by Reference ThompsonThompson (1980) has determined the current accumulation rate b to be 1.24 m a–1 (ice) and the ice thickness H between Summit and North domes (Fig. 4) is taken to be 180 m. In addition, we make the following assumptions:
-
(1) The ice cap is in steady state with an accumulation rate that is independent of time.
-
(2) Bottom melting is occurring at a rate b m of 0.005 m a–1 (ice). This corresponds to a typical geothermal heat flux of 1.7×l06Jm –2 a –1 and is based on temperature measurements by Reference ThompsonThompson (1980) which indicate that except for theupper 10 m, the ice is temperate throughout.
-
(3) The ice flow is two–dimensional, with the vertical coordinate y positive downward measured from the upper surface of the ice.
-
(4) The horizontal velocity is constant at the base of the ice cap.

Fig. 4. Ice thickness estimates from the mono–pulse ice radar data illustrate that the thickest ice occurs between the North dome and Summit dome.
We also need to make some assumptions concerning the explicit form of the vertical strain–rate ε y . Assumptions (3) and (4) imply that the vertical strain–rate must vanish at the base of the ice cap. We will also consider a constant vertical strain–rate to see what effect a more realistic treatment of bottom sliding would have on our estimates.
The models we will consider for the vertical strain–rate are of three types. The first type (Class I flow model) represents a flow regime in which the strain–rate varies most rapidly with depth in the upper part of the ice sheet. Bore–hole tilting measurements on the Devon Island ice cap (Reference PatersonPaterson, 1976) and on Athabasca Glacier (Savage and Reference SavagePaterson, 1963) seem to be consistent with this type of model. For the second type of model (Class II flow model), the largest strain–rate variation occurs in the lower part of the ’ice cap. This type of strain–rate variation with depth was observed on the Blue Glacier (Reference ShreveShreve and Sharp, 1970; Reference HarrisonHarrison, 1975), on the Barnes Ice Cap (Reference HookeHooke, 1973) and also on Athabasca Glacier (Savage and Reference SavagePaterson, 1963). (See Reference RaymondRaymond (1980) for a review of bore–hole tilting results from temperate glaciers.) Finally, the third model considered involves the explicit use of a flow law, along with an attempt to incorporate the longitudinal stress in a simple way.
Class I flow model
We take the vertical strain–rate to vary with depth according to
where

is the reduced depth. The vertical velocity v(y) is calculated by integrating Equation (3):

with
We have also used the boundary conditions that the vertical velocity on the upper and lower surfaces of the ice sheet be b and b m, respectively. Since

the depth–age profile t(y) is given by integrating Equation (6):

We find for Class I models that the age of ice near the bottom of the ice cap varies greatly with the exponent n (see Table 1). For example, ice one meter above bedrock is 3 250 years old for n= 1, compared to 12 500 years old for n=4. This is due to the more rapid layer thinning that occurs for the more actively deforming ice represented by higher values of n. The thickness of an annual layer as a function of depth is

At a depth of 100 m, we find that an annual layer has thinned from 1.24 m to 0.25 m for n = 1, while at the same depth, for n = 3 the annual layer thickness is only 0.05 m. Depth–age curves for n = 0 to 4 are shown in Figure 5.
The length of the climatic record that can be obtained from an ice core depends on the depth to which annual layers can be identified. The use of stable–isotope or microparticle stratigraphy requires that enough samples be taken from an annual increment to define the annual peak in either of these features. We require that at least five samples be taken per layer. Due to the difficulty involved in cutting very thin sections of core in the field (core cannot be maintained in frozen condition due to lack of refrigeration facilities near the Quelccaya ice cap), we require here that an annual layer must be at least 0.02 m (ice) thick to be clearly identified.
The age of an annual layer of initial thickness 1.24 m that has been thinned to 0.02 m is displayed in Table 1 for Class I models with exponents n ranging from 0 to 4. It is interesting to note that values of n = 1 to 4 give about the same age, 1 100 years.
Table I. Result of using different models to calculate ice thinning and age In this Table, γ 0 is the depth in meters at which an annual layer of original thickness 1.24 m (ice) has thinned to the minimum layer thickness of 0.02 m; t 0 is the corresponding age in years and t b is the age in years of ice one meter from the bottom. The ice thickness is taken as 180 m and it is assumed that bottom melting is occurring at a rate of 0.005 m a-1.


Fig. 5. Theoretical depth–age profiles for the Quelccaya ice cap. The figure shows depth–age profiles calculated from the flow models discussed in the text. The x marks the position on each curve where an annual layer of surface thickness 1.24 m has thinned to 0.02 m. The n = 1 curves are identical for Class I and Class II flow models.
Class II flow model
Here the vertical strain–rate is given by
The same form, with n = 2, has been used by Reference WhillansWhillans (1979) in his analysis of the Byrd Station bore–hole tilting results. The vertical velocity, for n ≠ 0, is

The resulting depth–age profile is displayed in Figure 5. From Table 1 we see that the maximum and minimum ages of 1 044 and 600 years are bracketed by n = 1 (identical to the n= 1 case for Class I models) and the constant strain–rate model n = 0 in Equation (3)), respectively. We see also from Figure 5 that the constant strain–rate model is actually the limiting case of n→∞. This can be shown explicitly by letting n approach infinity in Equation (9).
We note from Table 1 that the minimum annual layer thickness occurs within a relatively narrow depth interval, between 160 and 170 m, for n= 1 to 4, while the corresponding age differs by several hundred years.
Flow–law model
Finally we consider a chronology based on a flow law of the form
where

with ε ij the components of the strain–rate tensor and σ’ij the deviator stresses (Reference GlenGlen, 1955, 1958; Reference NyeNye, 1957). We assume that the flow is effectively two–dimensional so that the effective shear stress τ reduces to
where σ’ is the longitudinal deviator stress and τ xy is the shear stress. Following Reference NyeNye (1957) we take
so that the vertical strain–rate becomes
Since we require that the vertical strain–rate vanish at the base of the ice cap, we will assume that the longitudinal deviator stress can be written
The shear stress is
and
where E is the activation energy for creep and θ the absolute temperature. For temperatures close to the melting point of ice, the experiments of Reference GlenGlen (1955) and Reference SteinemannSteinemann (1958) suggest that n ≈ 3 and E≈ 1.4 eV (Reference BarnesBarnes and others, 1971). We have finally for the vertical strain–rate
The one free parameter in the model, σ0, the surface longitudinal deviator stress, can be fixed by integrating Equation (18) and applying the boundary conditions on the vertical velocity. Taking the nominal ice thickness to be 180 m, with sin α ≈ 0.06 as suggested by the surface profile of the ice cap in the vicinity of North dome and Summit dome, and taking the constant A≈5× 10⁸ (m2 N–1)3 a–1 (Reference BarnesBarnes and others. 1971) we find that σ0 ≈ 1.3 – 105 N –2. Since the basal shear stress τ0 ≈ 1 – lO5 N –2, we have a flow regime for which the longitudinal stress dominates in the upper part of the ice sheet and the shear stress dominates in the lower part. Having fixed the one free parameter, we find that the minimum layer thickness occurs at a depth of 157.9 m, where the ice is ≈1 300 years old.
It should be emphasized that no attempt is being made to describe the flow regime in terms of the actual stress environment, which is unknown. We have avoided explicitly incorporating effects such as three–dimensional flow, non–steady state, and bottom sliding. The first two effects could alter our estimated depth–age profiles in either direction, depending on their nature. Significant bottom sliding, for which the sliding velocity changes with distance from the ice crest, would imply a non–vanishing basal longitudinal deviator stress. We would expect the basal vertical strain–rate to be non–zero also. Such a situation resembles the case where the strain–rate is constant with depth, in that the rate of layer thinning in the lower part of the ice sheet would be less than if the basal vertical strain rate vanished. The net effect would be to reduce the possible record available.
It may be possible, then, to obtain a detailed climatic record extending back 600 to 1 300 years from an ice core taken on the Quelccaya ice cap. This would encompass the last Neoglacial period or "Little Ice Age" and provide valuable information about climatic behavior at low latitudes during this period.
Mapping of Qori Kalis glacier variations
In 1978 terrestrial photography of the Qori Kalis glacier (Fig. 6), the largest outlet glacier of the Quelccaya ice cap, flowing west (see Fig. 1). was carried out to determine whether significant changes had occurred on the glacier. A topographic map of the glacier was compiled for this purpose at a scale of 1:6 000 from 1963 aerial photography and coordinates of the terrestrial camera stations and of control points CP1, CP2 and CP3 (Fig. 6) used for the terrestrial photography, were measured during this compilation. The height difference and distance between camera stations were also measured in the field in 1978 and the two determinations are in excellent agreement.
The terrestrial photographs were taken from a 370 m base line located on a bluff about 900 m from the glacier terminus with a Hasselblad 500 EL Data camera equipped with a Zeiss Biogon 60 mm lens and a focal–plane reseau. This allowed corrections for film deformation to be applied. Lens distortion was negligible and atmospheric refraction was ignored because of the close range of the photography. The position of the edge of the glacier was determined analytically from comparator measurements on a Zeiss PSK stereocomparator. Unfortunately, foreground areas of the glacier could not be fused stereoscopically and monocular measurement of some of the points was required.
A comparison of the position of the glacier determined from the 1978 photography with that determined from the 1963 photography is shown in Figure 7. The 1978 outline is approximated Figure 6 Figure 7 by connecting the discrete point determinations by straight–line segments. The photo points which were measured are shown in Figure 6. A detailed analysis of the photogrammetric results suggests that the coordinates of these points are determined with a precision of about ± 10 m. As illustrated in Figure 7 the terminus of the Qori Kalis glacier has retreated more than 100 m over this 15 year interval. The inside of the large moraine at point CP1, as indicated in Figure 6, is 440 m from the present ice margin.

Fig. 6. This Hasselblad camera photograph of the Qori Kalis glacier was taken in 1978. The photo points which were measured during the photogrammetric analysis are indicated by dots.

Fig. 7. Fig. 7. This map compares the extern of the Qori Kalis glacier as determined from the 1978 photography with that determined from the 1963 photography. The terminus of the glacier has retreated more than 100 m.
The retreat of tropical glaciers is well documented and appears to have been characteristic of tropical glaciers over the past century. The glaciers of Mount Jaya, New Guinea (Reference AllisonAllison and Peterson, 1976), are in a recession which began near the middle of the nineteenth century according to the modelling work of Reference AllisonAllison and Kruss (1977). In East Africa the glaciers of Kilimanjaro, the Ruwenzori, and Mt Kenya have been receding since the earliest observations near the end of the last century (Reference HastenrathHastenrath, 1975; Reference WhittowWhittow and others, 1963). In the Americas, Reference WoodWood (1970) reports a decrease in ice extent by one third between 1939 and 1969 for most Colombian glaciers. For the Ecuadorian Andes, Reference HastenrathHastenrath (1981) evaluated historical sources since the era of Spanish colonization. The ice equilibrium line appears to have been lower than at present in the sixteenth and eighteenth centuries and glacier recession began in the middle of the nineteenth century at the latest and has continued to the present. Further, Reference MercerMercer (1962) reports a rise in snow–line of 780 m from 1886 to 1942 in the Cordillera Blanca of northern Peru.
Conclusions
Two independent techniques have been used to determine the thickness of the Quelccaya ice cap. The gravimetry and mono–pulse radar ice–thickness determinations are very comparable. The greatest thickness measured was 180 ± 10 m in the saddle between the Summit and the North domes. Using the current accumulation measurements, depth–age calculations indicate that an ice core record covering at least the last 600 years and possibly a much longer time period can be obtained from this tropical ice cap.
In an attempt to determine the equilibrium of the Quelccaya ice cap the position of the 1978 margin of Quelccaya’s largest outlet glacier, the Qori Kalis, has been compared to the position of the 1963 margin. These results indicate that the outlet glacier has thinned over this 15 year interval and the terminus has retreated more than 100 m. At this stage it is not clear whether the retreat of this ice tongue reflects a simultaneous retreat for the entire Quelccaya ice plateau. Nevertheless, the ice–tongue retreat is consistent with the retreat of other tropical glaciers over the past century.
Acknowledgements
We thank the National Science Foundation Division of Atmospheric Sciences (grant ATM7821609) and the Division of Polar Programs (GV41411) for support of this work. The authors wish to thank Ronald Coliman and Peter Ropp who were involved in the collection of ice–thickness data and Tim Tindall for his work with the photogrammetric study of the Qori Kalis glacier. We gratefully acknowledge the Peruvian Instituto Geológico Minero y Metalúrgico for field and logistical support. Thanks go to Charles Bentley and the University of Wisconsin for loan of the Worden gravity meter used in the gravity survey. Thanks to Raymond Watts of the USGS for many valuable discussions on the mono–pulse ice radar unit. Special thanks are extended to Colin Bull and Ian Whillans for review and discussions valuable in formulating this manuscript.