


Processes resulting in gas entrapment in sea ice
Savel’yev (1963) has proposed dividing the processes involved in the formation of the gas content of sea ice into syngenetic (connected with phenomena occurring under the ice at the time of its formation and growth), and epigenetic (occurring within the ice cover itself). To these should also be added a third group of phenomena which occur at the upper boundary of the ice cover and lead to the entrapment of gas. These latter processes will be called exogenetic.
Savel’yev (1963) has referred to the following three processes as syngenetic:
-
1a. The entrapment of gas within the primary ice layer at a time when it consists of separate crystals that have not, as yet, frozen together. This gas is presumed to be captured partly from the atmosphere and partly from the water.
-
1b. The release of gas from solution during the further freezing of sea-water. This process occurs continuously during ice growth in all the freezing areas of the oceans.
-
1c. The inclusion in the ice of gas bubbles which rise from the sea bottom, primarily as the result of the decomposition of organic matter. Such inclusions are distinguished by their lenticular form, whereas other inclusions are commonly cylindrical or pearshaped (Kheysin and Cherepanov, 1968; Bari and Hallett, 1974).
It is also possible to imagine four epigenetic processes which result in the formation of gas inclusions:
-
2a. The substitution of air for a part of the brine which, during the course of ice melting, drained downward out of the ice when the initially closed brine pockets change into interconnected vertical brine channels. Zubov (1945) and Savel’yev (1963) consider this to be a cardinal process in the development of the gas porosity of sea ice. Zubov (1945, 1957) even developed a table that allowed the computation of the changes in the bulk density of the ice that result from such substitution. However this process can only occur in the uppermost layers of the ice cover, those above sea-level, because at locations below sea-level sea-water will substitute for the brine.
-
2b. The release of gas from entrapped brine as the result of its further freezing.
-
2c. The formation of water-vapour-filled pores during internal ice melting. When melting occurs on the walls of brine pockets, the volume of melt water that is produced is less than the volume of ice that melts. As a result voids can be formed on the upper ends of the brine pockets. These voids are then quickly filled with vapour as the result of the partial evaporation of ice and brine.
-
2d. The formation of gaseous inclusions from oxygen produced through photosynthesis by algae living in the ice. The possibility of this phenomenon was first noted by Zubov (1945); the latest studies by Buynitskiy (1973) have confirmed this possibility.
There are also two exogenic processes that would result in the formation of gaseous inclusions:
-
3a. The capture of air during the formation of “infiltration” ice, i.e. the ice produced if the snow cover on top of the ice sheet becomes saturated with either sea-water or melt water and then refreezes.
-
3b. The possible migration of air inclusions from the snow cover into the underlying ice cover. Zubov (1945), Savel’yev (1963), and Kheysin and Cherepanov (1969) have noted that when a vertical temperature gradient is present in the ice sheet, sublimation will occur at the warm ends of the air inclusions with the deposition of water vapour occurring at the cold ends. This causes the air bubbles to migrate in a direction opposite to the direction of heat flow. It is only natural to suggest that this phenomenon should result in the migration of air bubbles that originally formed in the snow into the ice.
In considering the different mechanisms that can possibly contribute to the formation of the gas porosity of sea ice, one should remember that it is currently impossible adequately to estimate the quantity of oxygen liberated by algae. It is also difficult to estimate the volume of air that will be included in infiltrated ice in as much as it is unknown what part of the air will be displaced by water.
Syngenetic processes
Process 1a has been investigated by Matsuo and Miyake (1966) who considered the gas content of a primary ice cover composed of horizontally elongated crystals with a random c-axis orientation. We will refer to this layer as the transition layer. It is reasonable to assume that the water trapped between these initial crystals will contain a large amount of dissolved air. There are also probably a number of air bubbles that are initially trapped as well. Matsuo and Miyake also suppose that atmospheric gas diffuses into this layer and obtain, from the diffusion equation, the following expression for the concentration of gas in the ice:
where C is the content of a given gas in the ice at time t with time t = 0 taken at the beginning of freezing and C∞ is the content at t = ∞, Cw is the concentration of the same gas in the water, Vt is the volume of the transition layer within the limits of area s, and β is the absorption coefficient which is equal to 0.340, 0.346, and 0.76 cm min–1 for nitrogen, oxygen, and CO2, respectively (at a temperature of 0° C). Assuming that the two principal components of the gas entrapped in the ice are nitrogen and oxygen, we can write the following equation for the gas porosity of the ice vi
where i is the number of the process.
It is obvious that s/Vt = ht where ht is the thickness of the transition layer. In this case, on the basis of Equation (1) we have
Here CΣW = CNw+Cow and the coefficient β can be taken as approximately 0.342 cm min–1 or 2.34 x 10⁻⁴ cm d–1.
In Equations (1) and (3), C∞ and V ∞ are unknown. Matsuo and Miyake did not determine them and their determination would require quite long experiments. Judging from the observations made by Savel’yev (1963) during three months in the Arctic, v ∞ can be more than 0.050. Our own observations made during a 101 d period on the White Sea gives V∞ greater than 0.112.
Process 1b is caused by the release during freezing of a part of the gases that were initially dissolved in the sea-water. During freezing the salinity and density of the upper layer of the sea of thickness z are raised because of the rejection of salt by the growing ice sheet. This causes what Zubov (1945) has termed the vertical winter circulation. Assuming that this process is basically one-dimensional, if as a result the salinity of the portion of the water column involved in the vertical circulation sz can be raised by dSw over the area s during the time dt, then as a consequence the solubility of some gas can be lowered by dL. In this case a gas with a volume s dL can be released from the water column sz, and the gas concentration in the ice layer that has formed dh will be

If the increase in the depth of the winter circulation layer is neglected in comparison with the value of Z, we can determine z from

where dM is the mass of ice in layer dh, dm is the mass of salts included in it, S is its salinity, — dmw and — dMw are the decreases in the masses of salt and of water within the limits of the layer z, and SW is the salinity of the water. The mass changes dM and —dMw can be expressed in terms of dh, z, s, the ice density S, and the increase in the water density dρ:
and
Substituting these values in Equation (5), we obtain
and from Equations (4) and (6)
Let us now consider the concentration within the ice of the two main gases that are dissolved in the sea-water by writing Equation (7) as

and
Because of Equation (2) we have
Here V 1b, is the ice porosity which is formed as the result of process 1b and
Note that Equation (8) includes the ice density which is itself connected to the porosity by means of the relation
where δp is the density of pure ice. Therefore instead of Equation (8) we have

As has been pointed out by Tsurikov (1976), the ratio of the salinities of ice and of water (S/Sw) is related to the rate of growth of the ice cover (w = dh/dt) in the following manner
Therefore

We will use the empirical formulae for the nitrogen and oxygen saturation of sea-water developed by Fox (see Zubov, 1957) in which the results are expressed in dimensionless units. These are

and

where θ is the temperature of the water and [Cl] w its chlorinity. Newer equations are available for the dependence of the oxygen solubility on temperature and chlorinity; for instance those of Green and Carrit (UNESCO, 1973). However they are complicated and inconvenient to use. Also for the present purposes the differences between the values of L 0 calculated by the formulae of Fox and of Green and Carrit are negligible (for θ = 0°C, they do not exceed 0.8% of the quantities themselves, which does not have a great effect on our approximate calculations).
The water temperature at the lower surface of the ice is at the freezing point τ, the exact value of which is dependent on the water composition. The dependence between these two quantities can be simply expressed by using a formula of Miyake (1939)
Taking this into account, we can rewrite Equations (14) and (15) as

from which we obtain

To obtain the density of sea-water we will use the empirical equation of Knudsen (Forch and others, 1902)
where σ0 is the relative density for 0°C, σd is the relative density of distilled water, and A(θ) and B(θ) are functions of temperature. σ0 can be expressed as a function of the chlorinity of the sea-water by
and σd, A(θ), and B(θ) vary with temperature as


Bccause in the case we are considering θ = τ and τ is associated with the chlorinity of the water via Equation (16), we can solve Equations (19) to (22) neglecting the terms in [Cl]w with powers higher than the third. Differentiating the resulting equation we obtain

By means of Equations (18) and (23), the values of dL N/dρ, dL O/dρ, and dLΣ /dρ given in Table I can be calculated. The results obtained by graphically interpolating the derivatives (Fig. 1) can then be substituted in either Equation (11) or Equation (13) to determine the ice porosity v Ib.
Table I. The derivatives dL N/d p , dL o/d p , and dL Σ/d p

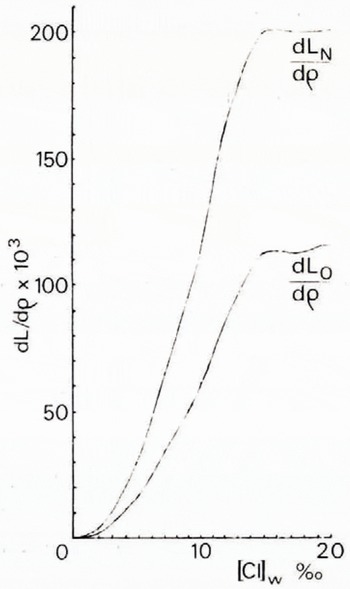
Fig. 1
Process ic, i.e. the gas release from the sea bottom, can be treated by assuming that the rate of release is constant
Hence in the time interval dt a gas volume equal to dVs is released and will accumulate at the base of the ice sheet. In addition
ana from Stefan’s (1891) analysis of ice growth
and
where ki is the thermal conductivity of ice, θ is the temperature of the upper boundary of the ice, and A is the quantity of heat necessary for the formation of 1 cm3 of sea ice at a temperature equal to the freezing point of sea-water τ. From Equations (24) and (25) we now have
Here the value A is equal to the density of sea ice δ multiplied by the latent heat of pure ice λ and by a factor which gives the mass of pure ice in 1 g of sea ice. According to Tsurikov (1975), this factor is equal to or larger than 0.1. Hence A ≥ 0.1 λδ and

It should be noted that if in this equation τ = θ, i.e. if the temperature gradient is equal to zero, ice growth stops.
Now consider the porosity of some layer, say h2 — h1 . In this case we must integrate Equation (27) within the limits of 0 to vIc and h1 to h2 . As a result we have

where Δh 2 = h2 2—h1 2 . Now taking Equation (10) into account we have

and if we wish to consider the porosity of the complete thickness of the ice cover, then h1 = 0 and

Epigenetic processes
Process 2a (i.e. the substitution of air for a part of the brine) occurs during the course of ice melting, when closed brine pockets change into interconnected channels that extend through the ice sheet. The process should be analysed starting from a knowledge of the volume of substituted brine. The relative volume of brine in the complete thickness of the ice cover is equal to the ratio of the brine volume V b to the total ice volume considered
By analogy, the relative volume of brine in the portions of the ice above water-level and below water-level must be

where Zu and z0 are draft and free-board of the ice relative to sea-level. Because V b0 = V b — V bu, according to the last three equations we have
and from Equation (30) we obtain

From Archimedes Principle, if the ice is not covered with snow, it follows that
where M and M w are the masses of ice and displaced water respectively and g is the acceleration due to gravity. The assumption about the absence of snow on the ice is reasonable because the snow cover usually melts before significant melting starts within the ice itself. We then rewrite Equation (32) as
where
As the brine in the above-water part of the ice is replaced by air we can rewrite Equation (31) as

and then substituting from Equation (33)

Next taking Equation (10) into account we obtain
which, when solved as a quadratic equation, becomes

Tsurikov (1976) concluded that the formation of through channels occurs only after the relative brine volume on every horizon of the submerged portion of the ice reaches a value of at least 0.044. Then assuming that v bu is equal or greater than its minimum, we can obtain an estimate of the maximal value for v2a from Equation (34). First we note that the density of pure ice δρ only changes from 0.917 (at o°C) to 0.922 (at —23°C) and if we take an average value of δρ = 0.92 the possible error. from this source will not be more than 0.3%. Also, although the density of sea-water varies with temperature and composition, if we consider its value to be ρ =1.00 the possible error due to this is less than 3%. Taking these approximate values into account, Equation (35) can be written as
If from the two roots of Equation (36) we select the one which gives the increase of v2a that depends on the increase in v b as in Equation (34), we obtain
Process 2b considers the release upon further freezing of gas that is dissolved in brine trapped within sea ice. During the course of freezing, sea-water with a mass of ρVW turns into pure ice with mass δp V p and brine with mass ρ b V b. From this we can write
where V w is the volume of the frozen water, and V, V p, and V b are the volumes of the sea ice, pure ice, and brine respectively. During this process some of the gas that was initially dissolved in the unfrozen sea-water having a concentration of Cw will still remain in the brine where the gas concentration has now reached saturation concentration L and some will come out of solution resulting in gas-filled pores within the ice. Therefore
where C is the relative gas content of the ice.
From Equation (38) we have
and, as has been demonstrated by Tsurikov and Tsurikova (1972), the relative mass of brine in the ice ρ b V b/δV is equal to the ratio of the chlorinity of sea ice to that of the brine
Now, substituting the last two equations in Equation (39), we have

and, taking Equation (2) into account

where C NW and Cow are the concentrations of nitrogen and oxygen in the sea-water before it freezes. Now denoting CNw+Cow = CΣw and substituting the value of δ as obtained from Equation (10) into Equation (41) we obtain

This equation includes the densities of brine ρ b, sea-water ρ, and pure ice δρ all of which are variables. However the possible error resulting from taking ρ b = 1.10 cannot be more than 7% ( ρ b = 1.00 at —0.2 ° C and 1.19 at —23°C). The errors resulting from assuming ρ = 1.00 and δρ = 0.92 are even less, as stated earlier 0.3 and 3.0% respectively. Hence as an approximation we can obtain from Equation (43)

I know of no determinations of the solubility of gases in the brine formed from freezing sea-water. Therefore to obtain values of L N and L 0 we have used Equation (17) even though this equation can only be used with confidence to chlorinity values corresponding to sea-water ([Cl] b < 20‰) and to temperatures above —2.0° C. Values of L N and L 0 so calculated are presented in Table II and are positive only to some limiting [Cl]b value which appears to lie in a range between 83 and 86‰. This corresponds to a freezing temperature of between — 8.4 and — 8.8°C. Furthermore, from Table II we can see that the value of LΣ/LN changes only slightly. Therefore taking its value as 1.56 we can simplify Equation (44) to
Values of L N and L O for different values of the chlorinity of the brine are given in Figure 2.
Table II. Limits of brine saturation by nitrogen and oxygen

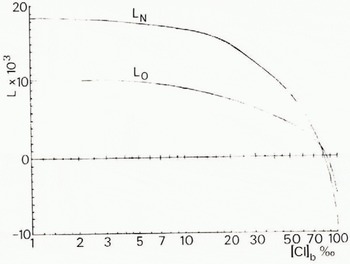
Fig. 2
Process 2c is concerned with the formation of pores that are filled with water vapour. As ice temperatures decrease during a period of ice growth, ice gradually freezes out of the brine so that the brine composition will change to the specific composition that is in equilbrium with ice at the new temperature. The volume of ice that is formed will be more than the volume of brine that it has replaced. As a result strains will occur in the ice causing stresses which can exceed the strength of the ice and result in the formation of cracks. In the opinion of Savel’yev (1963) these cracks quickly refreeze.
In the course of the following rise of temperature dθ, a part of the ice that forms the walls of the brine pockets will be dissolved and the volume of brine will increase by dV b, a volume which is less than the volume of melted ice dVp . If cracking of the ice took place on the previous cooling cycle and the cracks refroze, a void with the volume
can appear on the upper ends of the brine pockets. These voids are quickly filled with water vapour as a result of the partial evaporation of ice and brine.
It is obvious that V p = M p/δP. Also if we neglect the relatively small mass of crystallized salts and assume that M = 1, we have M p + M b = 1 and hence V P = (1—M b)/δp, so
and
Then instead of Equation (46) we can write

or, taking Equation (40) into account,

This equation can be integrated between the limits 0 and V2c or ([Cl]b)0 and ([Cl]b)2, taking into account that d[Cl] = 0 in as much as the chlorinity of the ice is not dependent on temperature. As a result we have

where

Because δρ ≈ 0.92 Mg m -3 and ρ ≈ 1.10 Mg m-3 we can write
Exogenetic processes
Of the two exogenetic processes we mentioned earlier, no way has been found to develop a quantitative formulation of process 3a, therefore we will only discuss process 3b.
Process 3b which is concerned with the migration of air inclusions across the snow-ice interface can be investigated using a theoretical relation developed by Kheysin and Cherepanov (1969). In considering the rate of migration (dζ/dt) of spherical air bubbles through ice they obtained

where ki and ka are the thermal conductivities of ice and air, D is the diffusion coefficient for water vapour in air, and γ is the density of saturated water vapour. According to Kheysin and Cherepanov the values of these parameters when applied to Equation (49) are ki = 54 x 10–4 cal g-1 cm-1 s-1, ka = 5.84 x 10⁻³ cal g-1 cm-1 s-1, D = 22 cm2 s-1 and δ = 0.9 g cm-3. If the snow is quite fresh we can consider that λ = 80 cal g-1 and we can obtain values for
Table III. The rate of migration of air bubbles and brine pockets in the ice with the temperature gradient I/deg cm–1

Calculations of possible gas porosity in sea ice
Let us consider young ice about 8 cm thick having a temperature of —10°C at its upper surface and —1.9°C (i.e. the freezing point of sea-water) at its lower surface. If this temperature gradient were to remain unchanged it would take 5.5 months for an air bubble 1 mm in diameter to move entirely from the snow cover into the ice. In fact the process would occur even slower than this in as much as typical temperature gradients encountered in real sea ice are usually appreciably lower than this. Therefore the displacement of air inclusions from the snow into sea ice can only occur within a very thin layer with a thickness of less than a millimetre occurring at the upper ice surface. Also the shorter the ice growth season the thinner the layer.
We will now consider the possible contributions of processes 1 b, 2 b, and 2 c. Suppose that a new ice layer 10 cm thick has grown under a 20 cm thick ice cover. Let the chlorinity and salinity of this layer be 3.85‰ and 6.93‰ respectively. In addition let the same parameters for the sea-water under the ice be 13.00‰ and 23.48‰ and also assume that the total gas content of the water is CΣW = 0.027 and that the ice temperature profile is linear, changing from — 10°C on the upper ice surface to the freezing point on the lower. If after the formation of the new ice layer in question, its temperature rises by an average of 0.5°C, then v 1b = 0.067, v 2b=0.020, v 2c = 0.110 and v 1b +v 2b + v 2c = 0.197 (or expressed in percent 34 + 10 + 56 + =100).
Under the same conditions, except for the chlorinity and the salinity of the sea-water which are now taken as 19.30‰ and 35.00‰ respectively, and with a proportional increase for the salinity of the ice, we have v Ib = 0.091 (59%), v 2b = 0.005 (3%), v 2C = 0.058 (38%) and
As can be seen from these examples, the porosity values are large: 15 to 20% of the total ice volume. Nevertheless they appear possible in as much as we have observed ice porosities of 17% on the Caspian Sea. The above calculations indicate that the main contributions to the formation of the gas content of the ice come from the release of gases from the water and the generation of water-vapour-filled pores. The effect of the release of gases from the brine is relatively small. However, these apparently small values may be caused by our limited knowledge of the solubility of gas in brine. Only in the case of the release of gas from the brine will the porosity depend inversely on the composition of the sea ice. In the other processes the porosity will increase if the salinity increases. Our observations on the White and Caspian Seas show that changes of porosity and composition can occur with both the same and the opposite signs.
It is difficult to estimate porosity values resulting from the release of gases from the bottom because of the lack of knowledge of the rate of release of such gas. According to our determinations on Ozero Baykal, v Ic varies between 0.088 and 0.180. These are probably not extreme Values.
Let us now consider the possible porosity values which can be attributed to effect 2a, the substitution of a part of the brine by air. Tsurikov (1976) has shown that the strength of sea ice will become equal to zero if the volume of brine or gas inclusions exceeds 0.9 (90%)of the total volume of sea ice, while the minimum value of v 2a is certainly zero. According to Equation (37) these values of v 2a correspond to brine volumes v b= 0.374 and 0.631 respectively. Hence Equation (37) can only be used within these limits until the part above sea-level has replaced brine by air. Although v b= 0.374 is a large value, it is a most probable one because of the internal melting of ice that takes place in the course of the rise in the ice temperature in the spring and summer. Judging from the data of Tsurikov (1976), the relative brine volume of 0.374 at a temperature of —0.2°C corresponds to an ice salinity of only 1.38‰.
The gas composition of sea ice
Among investigators who study sea ice there is no common opinion what to call the gaseous phase of sea ice. Kheysin and Cherepanov (1969), Weeks and Assur (1968, 1972), and Bari and Hallett (1974) call it air; Zubov (1945), Savel’yev (1963), and Matsuo and Miyake (1966) are more careful in calling it gas, a more general term. We can appraise the applicability of the first term by examining the limited results that are available concerning the composition of the gas in sea ice. Analyses of the composition of such gases have been performed by Bruns (1937) and by Matsuo and Miyake (1966) and are presented in Table IV. As can be seen, the composition of the gas in sea ice can differ significantly from that in the atmosphere (O2/N2 = 0.27) with the ice sometimes being deficient in oxygen (to O2/N2 = 0.19) and sometimes enriched (to O2/N2 = 0.46). However the content of oxygen in the ice never reaches the value that would correspond to the saturation-values of these gases in sea-water at its freezing temperature (O2/N2 = 0.54). This is presumably the result of oxygen being depleted because of the oxidation of organic matter and the respiration of marine organisms living below the ice at a rate higher than it can be produced in the course of photosynthesis. This latter process is, of course, greatly slowed by the photo-insulating action of the ice. This argument is supported by the high CO2 content of some samples of sea and pond ice (24.3% and 24.8% respectively). Savel’yev (1963) has suggested that the lower O2 content and the higher CO2 content in the ice as compared with that in the water is the result of the activity of organisms living within the ice. We consider this explanation doubtful in as much as if it were true microscopic animals would be expected to develop rapidly within the ice. However, this is not the case since according to Buynitskiy (1973) the rapid development of algae was observed instead.
Table IV. Gas composition in sea and pond ice

During process 1a gas is captured from both the atmosphere and the water. Therefore the composition of the resulting gas should be different from that in the atmosphere alone. This difference should be more the calmer the sea because the presence of waves promotes the capture of gas from the air in the upper part of the water column. In process Ib, however, which is concerned with the separation of gases from solution within sea-water, the composition of the resulting gas should approach the composition of the gas in the sea-water. In all probability the composition of gases rising up from the sea bottom will be different from those in the atmosphere or in the ocean. For instance, Zubov (1945) has pointed out that the pores from some samples collected in the Laptev Sea were filled with methane.
In the course of the substitution of air for a part of the brine (via process 2a), the pores are filled with gases of atmospheric composition. However this substitution only affects the layers of the ice cover that are located above sea-level. In the parts below sea-level any loss of brine would be replaced by sea-water. The composition of the gases released from the brine (in process 2b) must be close to the gas content of sea-water because the brine originates from this water, process 2c would lead to the formation of pores filled mainly with water vapour. If the gas in the pores results from photosynthetic processes carried out by algae within the ice, it would be rich in oxygen (process 2d).
The composition of gas in infiltration ice (process 3a) will be similar to that in the atmosphere. However this process can only affect the composition of the upper layers of the ice cover. The same can be said about process 3b, but in this case the penetration of air is so slight to be of little practical importance.
Conclusions
The problem of the formation of the gaseous porosity of sea ice is clearly in need of investigation both in the field and in the laboratory. As the first step it would be desirable to determine the solubility of oxygen and nitrogen in sea-water brines of different compositions.
From the analysis of the gas compositions in sea ice it is possible to conclude that this composition differs quite clearly from gas in the atmosphere in all but the very uppermost layers of the ice.


