


Introduction
A knowledge of ice-crystal growth and the factors which may influence growth is an important tool in interpreting the texture, fabrics and crystallization histories of ice bodies in permafrost. In the U.S.S.R., Reference ShumskiyShumskiy (1955) and Reference Vtyurina. and VtyurinVtyurina and Vtyurin (1970) have employed petrologic analysis on permafrost ice but the English literature contains only a few papers utilizing the technique (Reference Black and CoatesBlack, [c1974], Reference Blackunpublished; Reference GellGell, 1975, Reference Gellunpublished). Pingos (ice-cored hills) represent one of the most studied forms produced by ground ice (Reference ShumskiyShumskiy, 1955; Reference MüllerMüller, 1959; Reference Mackay.Mackay, 1973) and several theories have been proposed to explain pingo growth. In the earlier literature (Reference SumginSumgin, 1940; Reference ShumskiyShumskiy, 1955; Reference MüllerMüller, 1959), injection ice was considered to be a major factor in pingo growth. Reference ShumskiyShumskiy (1955) suggested that rapid freezing and uplift occurred. On the other hand, Reference Mackay.Mackay (1973) has discounted injection ice as the major factor in pingo growth, although it may occur temporarily, and he considered that most massive ice in pingos is of segregation origin.
It is the intention in this paper to discuss fabric differences between ground ice known to be of injection origin and pingo ice on Tuktoyaktuk Peninsula, N.W.T., Canada. Growth rate, growth direction, and solute rejection will be inferred from consideration of crystal size, shape, dimensional and lattice orientation, and inclusion distribution.
Field and Laboratory Techniques
Field samples were obtained both with a CRREL corer and, on accessible coastal exposures, with a chain saw. Samples were placed in freezer boxes and transported in a few minutes by helicopter to cold storage at ≤ —20°C. At such a temperature no major changes in texture are to be expected (Reference CarteCarte, 1961; Reference Kamb, Heard, Heard, Borg, Carter and Raleigh.Kamb, 1972). Most specimens were analysed within a few days of sampling. Thin sections of sediment-free ice were prepared by microtome, as described by Reference LangwayLangway (1958). In pingo ice, which contained bands of high sediment content, thick sections were gradually thinned with emery paper and carborundum, and excess sediment particles were removed with a point. As the study was field-based, only optical methods were employed, c-axis orientations were measured by standard universal stage techniques; a-axis orientations were found by etching.
Results
Tuktoyaktuk Peninsula is in the zone of continuous permafrost. Within the permafrost, taliks may occur beneath large deep lakes. If such lakes drain, lake-bottom material will freeze gradually and ground ice may grow.
Icing-mound ice
Following drainage of a large lake on Tuktoyaktuk Peninsula, permafrost is aggrading and several pingos are growing. Tension cracks radiate from pingos (Reference Mackay.Mackay, 1973, fig. 18) and water is under artesian pressure at the base of permafrost. In winter 1973-74, water travelled up a tension crack and became injected into the active layer (Reference MackayMackay, 1975) to form an icing mound (Fig. 1).

Fig. 1. Icing mound, Tuktoyaktuk Peninsula. The mound is about 3 m high. The hill on the left is a pingo.
Layering in the ice was determined by bubbles which occurred in distinct bands parallel to the mound surface. Bubble size and shape were uniform within a given band but varied from band to band. Adjacent to the active-layer soil was a zone of clear ice, next to which was an opaque layer containing many small bubbles, then alternating zones of clear ice and of long bubbles elongate normal to the layering. Crystal size varied from <1 mm2, in equi-dimensional crystals in the upper "chill" zone, to >80 mm long by ≤8 mm wide in elongate crystals in the lower "columnar" zone, c-axis orientations became more concentrated with depth into a girdle with preferred orientation normal to the direction of crystal elongation (Fig. 2). The development from a chill zone, comprising small crystals with non-preferred lattice orientations, of a zone of columnar crystals with strongly preferred c-axis orientations is typical of ice crystallizing from bulk water (Reference Ketcham and HobbsKetcham and Hobbs, 1967).

Fig. 2. Fabrics of icing-mound ice. a. Vertical sections, 80 crystals; b. Vertical section, upper columnar crystals, 20 crystals; c. Vertical section, lower columnar crystals, 20 crystals. In each diagram the line marked c indicates compositional layering.
The upper zone of small crystals corresponds to the zones of clear ice and small spherical bubbles. This represents very rapid freezing with copious crystal nucleation against the cold active-layer soil, and gas rejection leading to supersaturation at the interface, followed by widespread nucleation of bubbles which had little time to grow. Further from the ice/soil interface, elongate bubbles are preferredly located at vertical grain boundaries of elongate crystals. This represents slower crystallization due to a reduced thermal gradient. Increased gas concentration in the liquid between two crystals leads to growth of filament-shaped bubbles which widened downwards as expelled gas moved along the concentration gradient. Thus bubbles became fewer but larger. In some cases, filaments have bulbous zones or are in several sections, indicating variations in gas supply. Conditions were thus critical in terms of gas concentration and freezing rate in this transient growth phase; once a steady state was attained, bubble diameter remained constant giving rise to cylindrical bubble segments several centimetres long.
The geomorphic evidence (Reference MackayMackay, 1975) and petrologic criteria of bubble zones, crystal zones and lattice orientations are all indicative of ice growth into bulk water injected into a frozen active layer.
Pingo ice
There have been more studies of pingo ice than of icing-mound ice. Reference MüllerMüller (1959) studied some crystal characteristics of pingo ice in the Tuktoyaktuk area, and reported crystal size >10 mm mean diameter but no c-axis measurements were presented. Reference Mackay and StagerMackay and Stager (1966) made a field inspection of exposed pingo ice and estimated that 80% of c-axes pointed toward the centre of the pingo. Worm bubbles had two axial orientations: parallel to c-axes and toward the outer base of the pingo. Reference ShumskiyShumskiy (1955) reported that pingo ice comprised large crystals with random crystallographic orientation, and contained large irregular curved and vertically elongate bubbles. The ice was thought to have frozen from a mass of intruded water.
Ice from three pingos, representing three stages in the classification of Reference Mackay.Mackay (1973) was studied. In a small pingo which had ceased growth (Reference Mackay.Mackay, 1973, fig. 15, pingo No. 11) the core comprises lenses in peat overlying a 0.8 m thick, relatively pure ice core. Crystals are very elongate, some > 160 mm long and 30-40 mm wide at the base. Vertical grain boundaries are locally offset at soil inclusions, indicating differential heat flow, c-axes tend toward a horizontal orientation in the deeper ice (Fig. 3b) but the concentration is weaker than in the icing mound discussed above. Discontinuous peat layers interrupt the pattern locally. The ice layer terminates abruptly at a coarse sediment layer. From the crystal characteristics, it is evident that freezing was unidirectional downwards. If the ice core resulted from injection of water into already frozen material, there would be evidence of freezing upwards from the base also. It appears that bulk water existed temporarily at the freezing front. The absence of a "chill zone" at the top of the ice core indicates that initial freezing was slower than in the icing mound, or that considerable grain growth has since occurred, in annealing conditions.
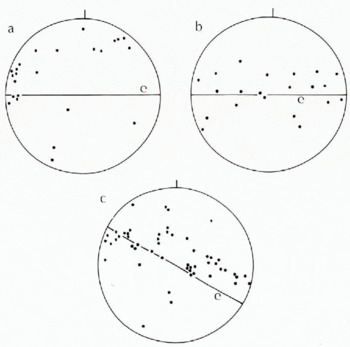
Fig. 3. Fabrics of pingo ice. a. Pingo. No. 11, crystals in upper part of core; b. Pingo No. 11, crystals in lower part of core; c. Large pingo, crystals near base of core. In each diagram the line marked c indicates compositional layering.
A second pingo exhibited a 3 m thick ice core, overlain by 3.5 m of stony clay and 0.35 m of fine sand, and underlain by sand containing pore ice. Compositional layering in the ice is determined by bubble content of layers parallel to the contact with the soil. The upper 2 m of core contains a few bubbles, mainly on crystal boundaries. Intercrystalline positions may result from original rejection of gas to grain boundaries or later boundary adjustment. The lower 1 m is more bubbly, and comprises elongate bubbles up to 15 mm long at the top, with size gradually decreasing toward the underlying pore ice. In the lower ice, bubbles have both intercrystalline and intracrystalline positions. Crystal size decreases with depth, while dimensional orientation becomes more preferred, normal to the compositional layering. Fabric diagrams for the upper ice display a fairly diffuse pattern but c-axes become approximately parallel to compositional layering near the base of the core (Fig. 3c). It appears that no major flow of ice has occurred, as the dimensional orientations of crystals and bubbles are normal to the layering; this conclusion is supported by lattice orientations in the basal ice. A possible increase in freezing rate during pingo growth is indicated by, successively: ice containing large bubbles orthogonal to the banding, with smaller crystals than the bubble-poor ice, then ice containing small bubbles, then pore ice. Such an increase in freezing rate could be produced by uplift of the lake bottom and exposure to cold air temperatures. Thus the crystal characteristics are not representative of injection ice growth but conditions differed from those inferred for the small pingo discussed above.
The core of a third pingo, in Tuktoyaktuk, comprises alternating layers of segregated ice and pore ice. The pingo is lower and broader than the previous one and much older as it has well-developed ice-wedge polygons. Deformation of the pingo is reflected in crystal characteristics, such as polygonization of large strained crystals. Hence fabric data are not indicative of growth conditions alone.
Discussion
Crystallization of ice from bulk water has been studied in detail in the field (Reference RagleRagle, 1963) and in the laboratory (Reference Perey and PounderPerey and Pounder, 1958; Reference Ketcham and HobbsKetcham and Hobbs, 1967). By comparison, although there have been many studies of ice lensing in terms of gross heave, heave rate, and relationship to soil particle and pore size, there have been no concomitant studies of fabrics of the ice in the lenses apart from a brief note by Reference PennerPenner (1961). Thus much of the following discussion of fabrics of segregated ice must remain speculative.
Segregated ice lenses result from the nucleation, growth, and coalescence of ice crystals in layers normal to the direction of heat flow in freezing soil. Given suitable soil conditions, growth will continue provided that a balance is maintained between heat flow and water influx. In general, the more slowly that crystallization proceeds, the more complete is the impurity rejection and the larger the crystals (Reference Anderson and MorgensternAnderson and Morgenstern, 1973). Subtle variations of temperature at the freezing plane are believed to determine whether segregation lens ice grows in the field situation (Reference MackayMackay, 1975). Such temperature variations may also influence crystal characteristics. For example, in the lower part of a lake-ice cover, crystal size reportedly increased sharply when ice growth almost ceased due to warm air conditions (Reference ButyaginButyagin, 1966). This is probably a grain-boundary migration phenomenon (Reference KnightKnight, 1966) in which the boundary is displaced perpendicular to its tangent plane. The driving force is interfacial energy. It seems likely that such grain-boundary migration may occur in ice lenses. Grain-boundary movement may also result from the presence of soil particles in permafrost ice, due to the difference in thermal conductivity between ice and soil. Grain-boundary movement away from the vicinity of a wire in polycrystalline ice was ascribed by Reference Ketcham and HobbsKetcham and Hobbs (1967) to the wire forming a more efficient heat sink than the ice, thus causing grains adjacent to the wire to protrude further into the water than the surrounding grains. In freezing soils, the principle may be expected to apply but the results would be complex due to the existence of a large number of heat sinks.
Reference Mackay and StagerMackay and Stager (1966) reported that in pingo ice beneath a 5.5 m overburden c-axes tended to point toward the pingo centre. If this is a growth fabric, c-axes are parallel to the inferred heat-flow direction. If the c-axis orientations were related solely to heat-flow direction, local sediment inclusions would be expected to have an influence. However, this is difficult to check, as in the field post-freezing processes related to thermal gradients and creep have influenced fabrics, and c-axis orientations have been measured only rarely and in small numbers in laboratory-grown lenses (Reference PennerPenner, 1961). In addition, other factors, such as overburden pressure, may influence c-axis distributions. Reference GossGoss (1953) showed that lattice-preferred orientations may be different when metal crystals are grown under conditions of stress. This has not been studied in ice growth but (Reference KambKamb 1959, Reference Kamb, Heard, Heard, Borg, Carter and Raleigh.1972) investigated the development of ice fabrics in various stress fields. Theory predicts that in uniaxial compression a c-axis maximum would occur around the unique stress axis (Reference KambKamb, 1959), although in experimental work Reference Kamb, Heard, Heard, Borg, Carter and Raleigh.Kamb (1972) found an incomplete small-circle girdle around the compression axis in ice at 0°C. Overburden pressure may thus influence growth and later fabrics of pingo ice.
Thus, fabrics of ice layers in permafrost are complex functions of water supply, freezing direction, freezing rate, local thermal gradients, and later thermally and mechanically induced stress systems. The ice of the icing mound represents a simple condition, where rapid freezing of bulk water occurred beneath a thin overburden. The ice was sampled soon after growth began, thus little time was available for post-freezing processes to influence substantially the growth texture and fabrics. By comparison, the pingo ice studied was old, e.g. the small pingo discussed above grew about 25 years ago, and the others are much older, as seen by ice-wedge growth in the overburden. Other pingos in the area may have begun growth several hundred years ago (Reference Mackay.Mackay, 1973) and it is likely that growth fabrics have been modified due to changing thermal gradients, creep, etc. Reference ShumskiyShumskiy (1955), while arguing that injection ice is a major factor in pingo growth, did not provide sufficient textural and fabric data for comparison with the results and discussion presented here.
Conclusion
An attempt has been made to infer growth conditions of some ice layers in permafrost, in particular 10 distinguish segregated ice and injected ice, and to compare these results with published data. Icing-mound ice, known to have formed from water injected into a frozen active layer, showed evidence of copious nucleation in a chill zone next to the soil, and growth into bulk water, giving rise to elongate bubbles and crystals parallel to growth direction. Crystal c-axes were normal to the growth direction. In contrast, crystal characteristics of pingo ice show no evidence of an injection origin. In a small pingo, bulk water occurred temporarily at the freezing front but freezing was unidirectional. Had the water been injected into frozen soil, upward freezing would have occurred also. In a larger pingo, variations in freezing rate were inferred from texture and fabric criteria.
Acknowledgements
Field work was supported by the Geological Survey of Canada, the Polar Continental Shelf Project (Department of Energy, Mines and Resources, Canada), the Inuvik Research Laboratory, and grants to Dr J. R, Mackay from the National Research Council of Canada and the Department of Indian Affairs and Northern Development, Canada. Dr Mackay gave helpful comments on the manuscript.


