


The ratio of the accumulation area to the total, used as an indication of a glacier’s regimen, is unsatisfactory because the different rates of increase of net ablation below, and of net accumulation above, the firn limit are ignored. When the area distribution and the firn limit of a glacier are known, a formula can be used that not only calculates a glacier’s condition much more accurately, but also indicates its probable response to a change in the firn limit.
On the Gorner Gletscher in Switzerland and the Taku Glacier in Alaska, the increase in net ablation below the firn limit has been found to be almost linear with altitude.Reference Renaud 1 , Reference Nielsen 2 Thus, if the ablation area is divided into equal vertical intervals, the net ablation in each is in the ratio 1:3:5:7:9 and so on. Above the firn limit, the increase in net accumulation is also approximately linear, except within about 500 ft. (152 m.) of the firn limit, where the rate of increase is greater due to changes in the albedo of the surface in this zone, and at higher elevations where, as the zone of maximum snowfall is approached, the rate of increase begins to fall.;Reference Ahlmann 3 It appears that, if the net accumulation from the firn limit to 500 ft. (152 m.) above is taken as 2, the values for successive 500-ft. (152 m.) intervals are in the ratio 5:7:9:11 and so on until the zone of maximum snowfall is approached. On the Juneau Ice Field the curve begins to flatten at about 5,000 ft. (1,524 m.). This implies a doubling of the net accumulation between 500 ft. (152 m.) and 1,500 ft. (457 m.) and a further doubling by 3,500 ft. (1,067 m.) above the firn limit.
If the areas of equal vertical intervals are measured they can he multiplied by the relevant factors, but the totals for the ablation and accumulation areas will then be in different units. If the glacier is known to be in equilibrium, these two totals will be equivalent, and a factor can be found to make them equal. The same factor can be applied to glaciers not in equilibrium; the ratio of accumulation units to total expressed as a percentage will then be 50 for a glacier in equilibrium, over 50 for an advancing and under 50 for a receding glacier; this figure may be called the Mass Balance Index (M.B.I.). Needless to say, this is still not a precise formula; for instance, neither orientation nor the effects of wind drift are taken into account. Furthermore, no account is taken of the protective effect of surface moraine in the ablation area: this can be such a serious source of error that some glaciers are not suitable for study by this method. Above a certain level (about 5,500 ft. (1,676 m.) in coastal Alaska) the net accumulation increases more and more slowly until, when the zone of maximum snowfall is passed, it starts to decrease. Until the form of this curve is known, it is not possible to use the formula for glaciers with névés above this level unless only small areas are involved.
Reversing the procedure, the firn limit when a glacier was larger than at present may be determined, provided the former extent and surface level are known. Where the former extent is not known, it can be calculated by using the firn limit derived from a glacier nearby.
The area distribution of a glacier may be plotted graphically, and the altitude of the firn limit shown. On the same graph, using different units on the vertical scale, the total net ablation and accumulation in each altitude interval may be shown. This is much more informative than the area distribution curve: it shows directly the relationship between the accumulation and ablation, shows up the comparative unimportance of areas near the firn limit (Figs. 1 and 2), and illustrates much more clearly the effect on the economy of changes in the firn limit (Figs. 1–3).
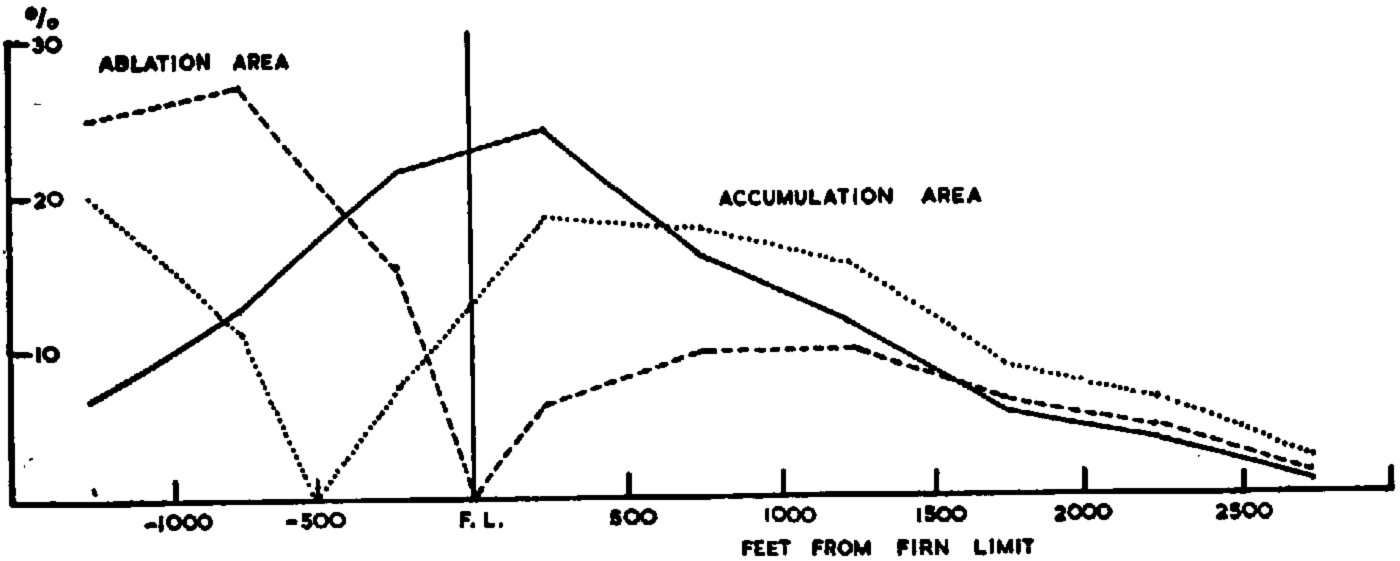
Fig. 1. The area distribution and turnover distribution of the Tebenkov Glacier. Mass Balance Index: 40, Mass Balance Index if firn limit fell 500 ft. (152 m.): 70. Percentage of total area _____. Percentage of total turnover — — — — —. Percentage of total turnover iffirn limit fell 500 ft. (152 m.)………
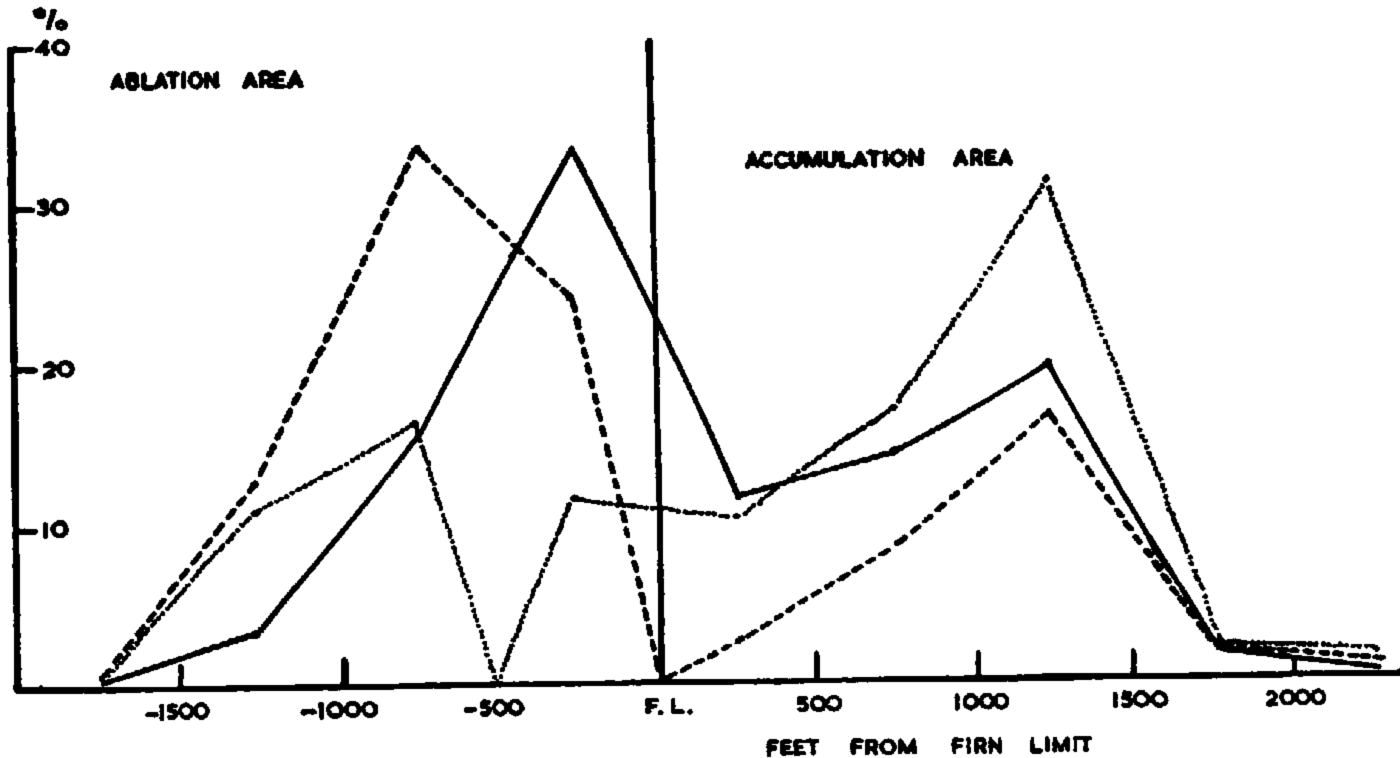
Fig. 2. The area distribution and turnover distribution of the Princeton Glacier. Mass Balance Index: 30, Mass Balance Index if firn limit fell 500 ft. (152 m.): 71. Percentage of total area _______. Percentage of total turnover — — — — —. Percentage of total turnover if firn limit fell 500 ft. (552 m.) ……
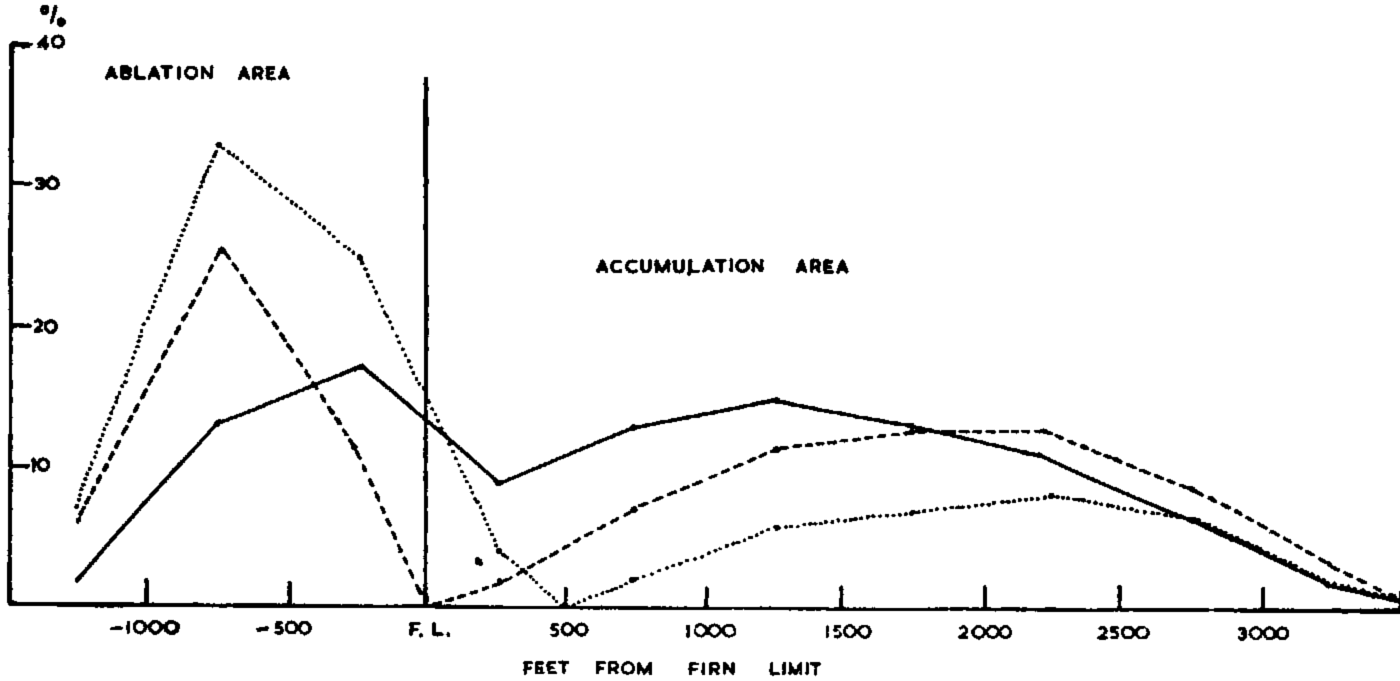
Fig. 3. The area distribution and turnover distribution of the Harriman Glacier. Mass Balance Index: 57, Mass Balance Index if fire limit rose 501 ft. (152 m.): 31. Percentage of total area _______. Percentage of total turnover — — — — — Percentage of total turnover if firn limit rose 500 ft. (152 m.)
The Application of the Formula in a Test Area
The region chosen to apply the theory was the Kenai Peninsula on the west side of Prince William Sound in Alaska (Fig. 4), for the following reasons:
-
a. There are large-scale contoured maps, and air photographs for determining firn limits.
-
b. Advancing, stable and receding glaciers are all present.
-
c. Maximum heights are probably below the zone of maximum snowfall.
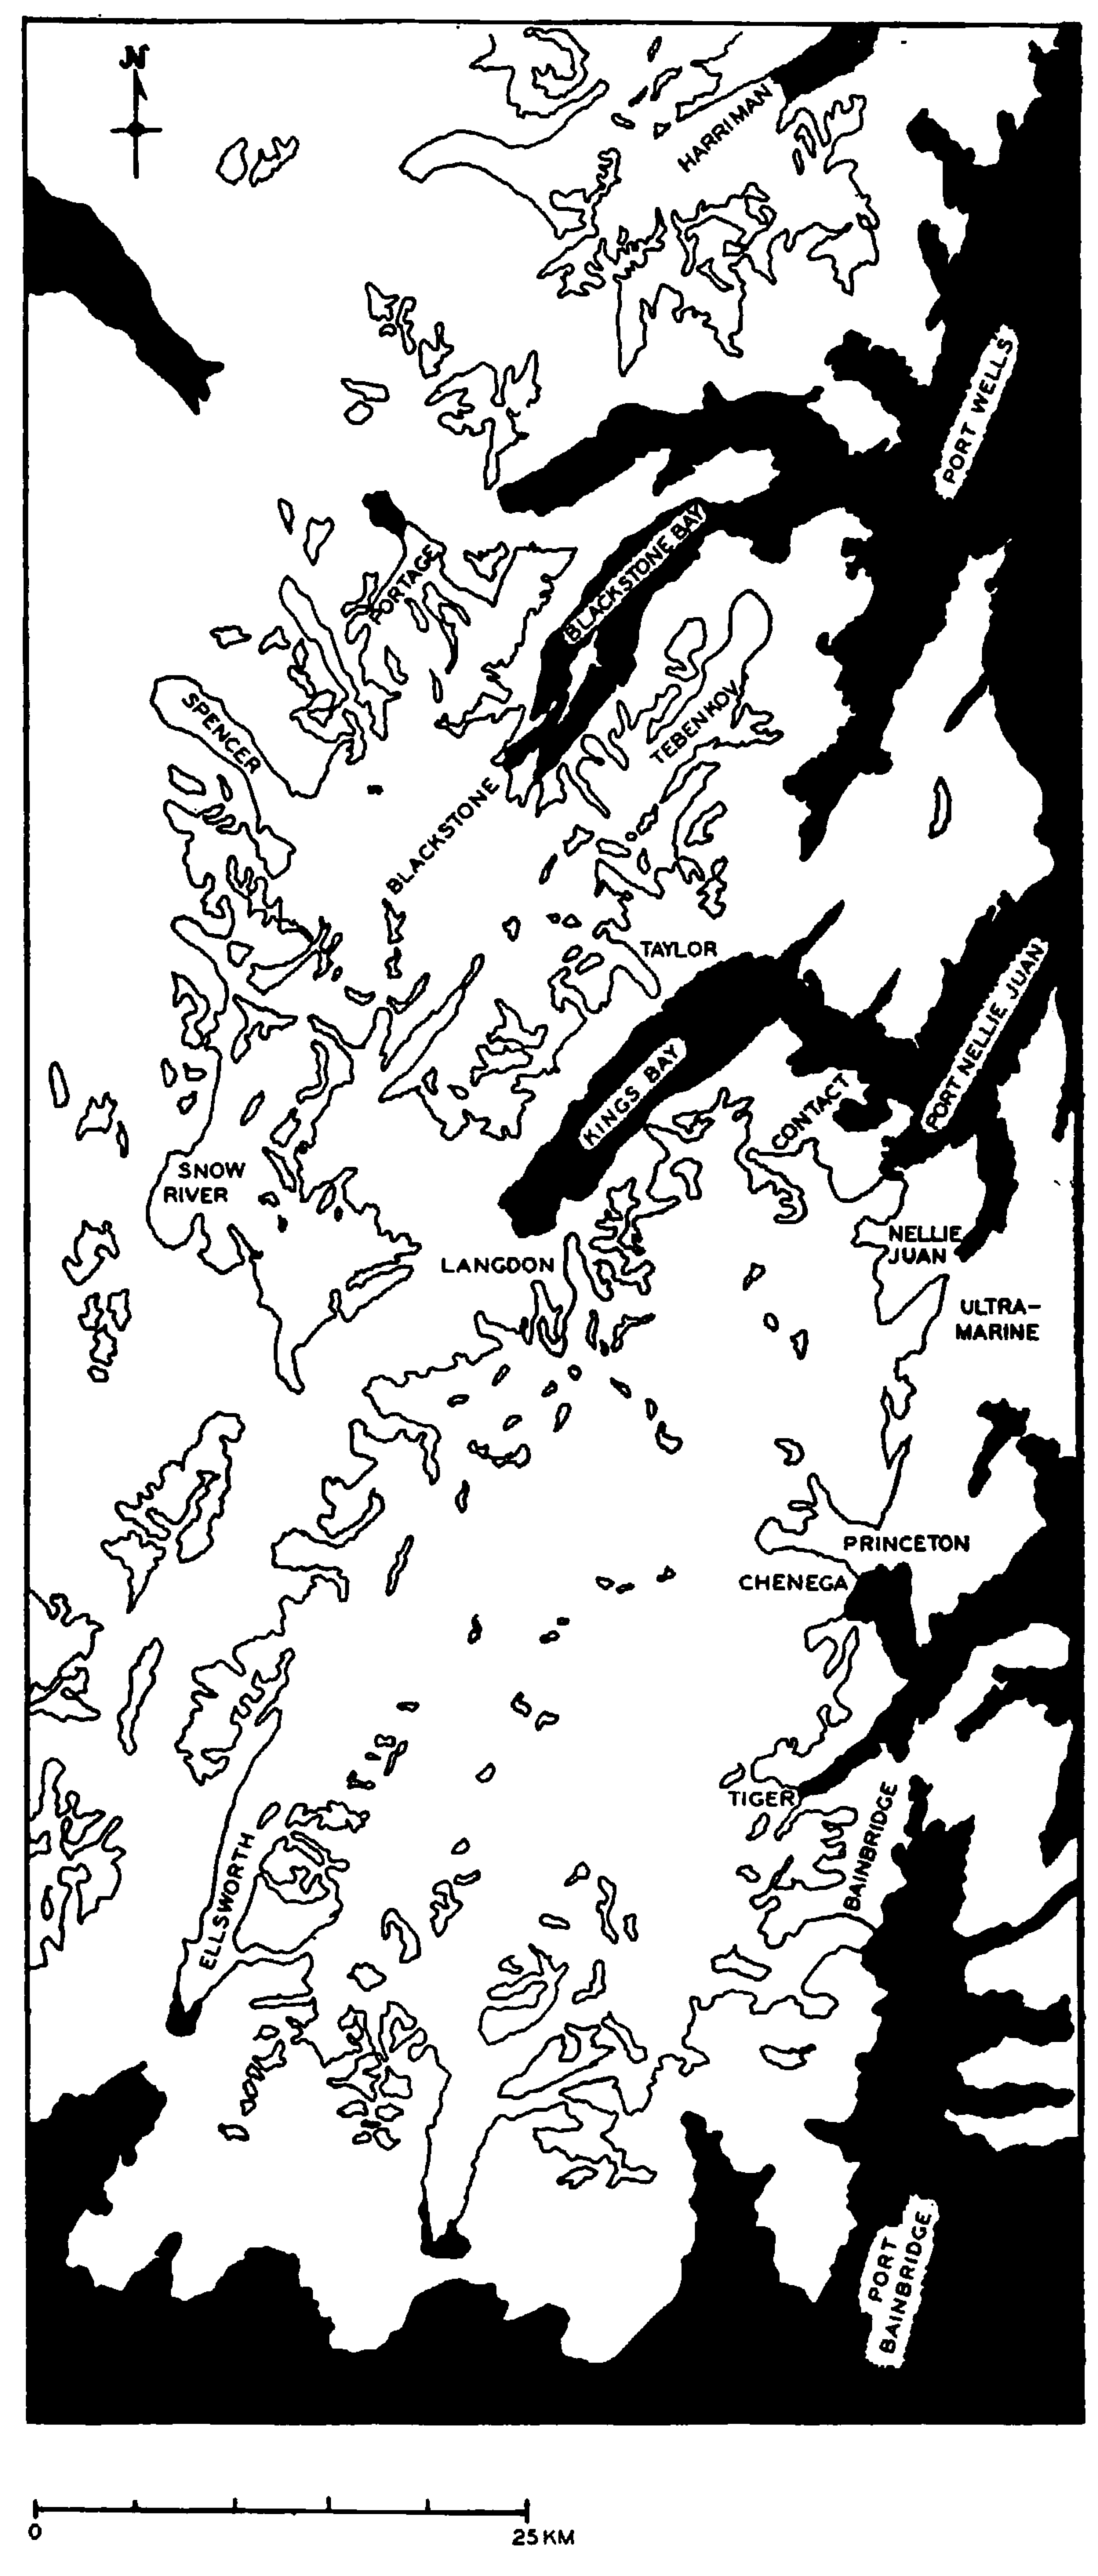
Fig. 4. Map of the Sargent and adjacent unnamed ice fields
Areas were measured in vertical intervals of 500 ft. (152 m.); the accuracy of the method does not merit smaller intervals. With glaciers thought to be approximately in equilibrium, a divisor of 6 was found to reduce the figures for the accumulation area to those of the ablation area. This implies, for instance, that the net ablation per unit area between 500 and 1,000 ft. (152 and 305 m.) below the firn limit is equal to the net accumulation between 3,750 and 4,250 ft. (1,14.3 and 1,295 m.) above.
Table I. Method of Calculation of the Mass Balance Index

Since air photographs are not usually taken with the prime object of showing the firn limit, they usually show only the temporary firn line. In a normal year the firn line reaches the firn limit about the beginning of September so that when photographs were taken earlier in the summer it is necessary to extrapolate. For example, the firn lines obtained from air photographs taken on 7 and 11 August 1950 on the west side of Prince William Sound give aII the glaciers—receding, stable and advancing—an excessively high Mass Balance Index. By setting the firn limit 250 ft. (76 m.) higher—reasonable for a further 3 to 4 weeks ablation —more reasonable figures are obtained.
Table II. Mass Balance Indices of Glaciers in the Test Area

Firn Iines on the adjacent glaciers Nellie Juan, Ultramarine and Contact obtained at the same time (12 August 1950) show firn limits of 1,100–1,500 ft. (335–457 m.), 1,200–1,500 ft. (366–457 m.) and 950 ft. (290 m.). By adding 250 ft. to the average values of these firn lines, the altitudes of the firn limits may be estimated as 1,550, 1,600 and 1,200 feet (472, 488 and 366 m.) respectively. These glaciers are extremely sensitive to small changes in the firn limit; their regimens are negative and on the verge of being very negative, as can be seen from Table III.
Table III. Effect of change of firn limit on mass balance index

The tidewater glaciers Chenega, Blackstone and Tiger have Mass Balance Indices of 94, 85 and 78 respectively if their calving losses are ignored. Since they are in fact known to be more or less in equilibrium it can be calculated that by calving and undermelting they lose the same as they would from sea-level ablation areas of 92, 17 and 6 km.2 respectively
The Application of the Formula Outside the Test Area
In favourable cases the former outlines and contours of the lower parts of glaciers may be reconstructed with considerable accuracy from air photographs and maps. For practical reasons it is assumed that in the upper parts of the glaciers above the tree line and where possible above the present firn limit, the surface contours are the same as formerly: this is, of course, not strictly true, but the changes are far less than in the lower parts.Reference Ahlmann 4 The Childs Glacier may be taken as an example; this is an expanded foot glacier with a firn limit of about 2,000 ft. (610 m.), and a Mass Balance Index of 46 implying very slow recession (as is the case). An outer moraine is not visible on the air photographs but according to Tarr and MartinReference Tarr and Martin 5 there were traces of one 1.5 miles (2.4 km.) beyond the ice margin at that time. Calculations show that the firn limit when the moraine was formed was at about 1,000 ft. (305 m.), that is, 1,000 ft. (305 m.) lower than today.
The old moraines of the adjacent Goodwin Glacier are clearly visible on the air photographs, and the corresponding firn limit also works out at about 1,000 ft. (305 m.). The glacier today has a very heavy moraine cover, and since calculations on such a glacier give very inaccurate results, it seems that at its maximum extent the glacier must have been comparatively clean.
Table IV shows glaciers on which calculations have been made arranged according to the rise in firn limit since the recent maximum. The Worthington, Saddlebag, Laughton and Gulkana Glaciers are shown in Figures 5–8.
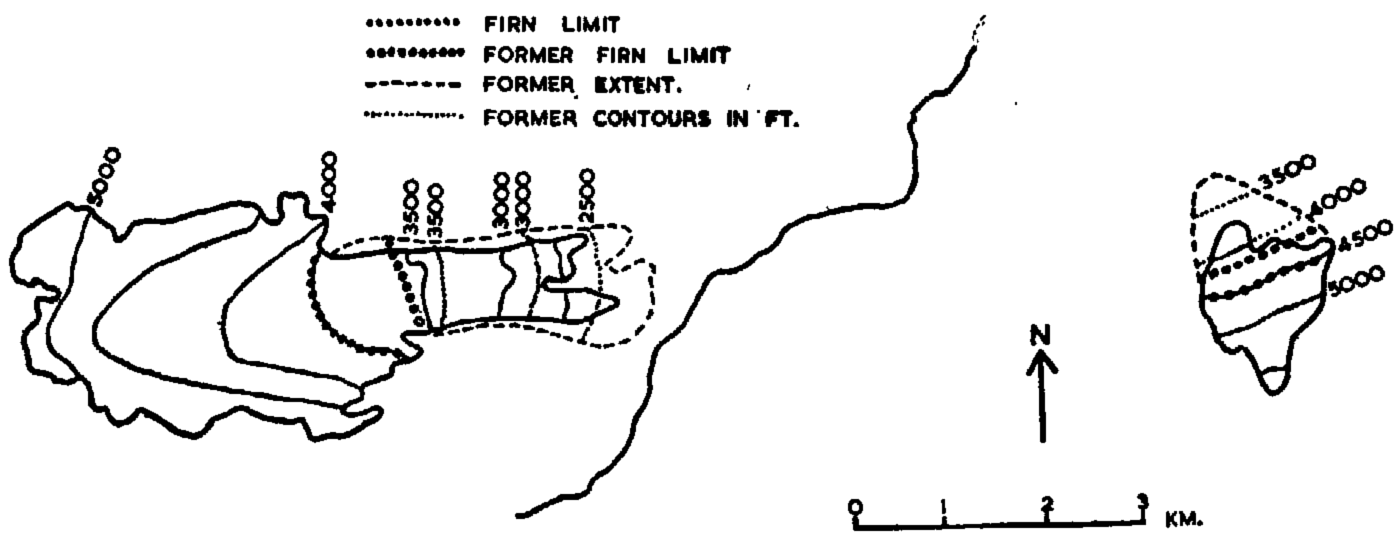
Fig. 5. Present and former extents and surface contours of the Worthington Glacier
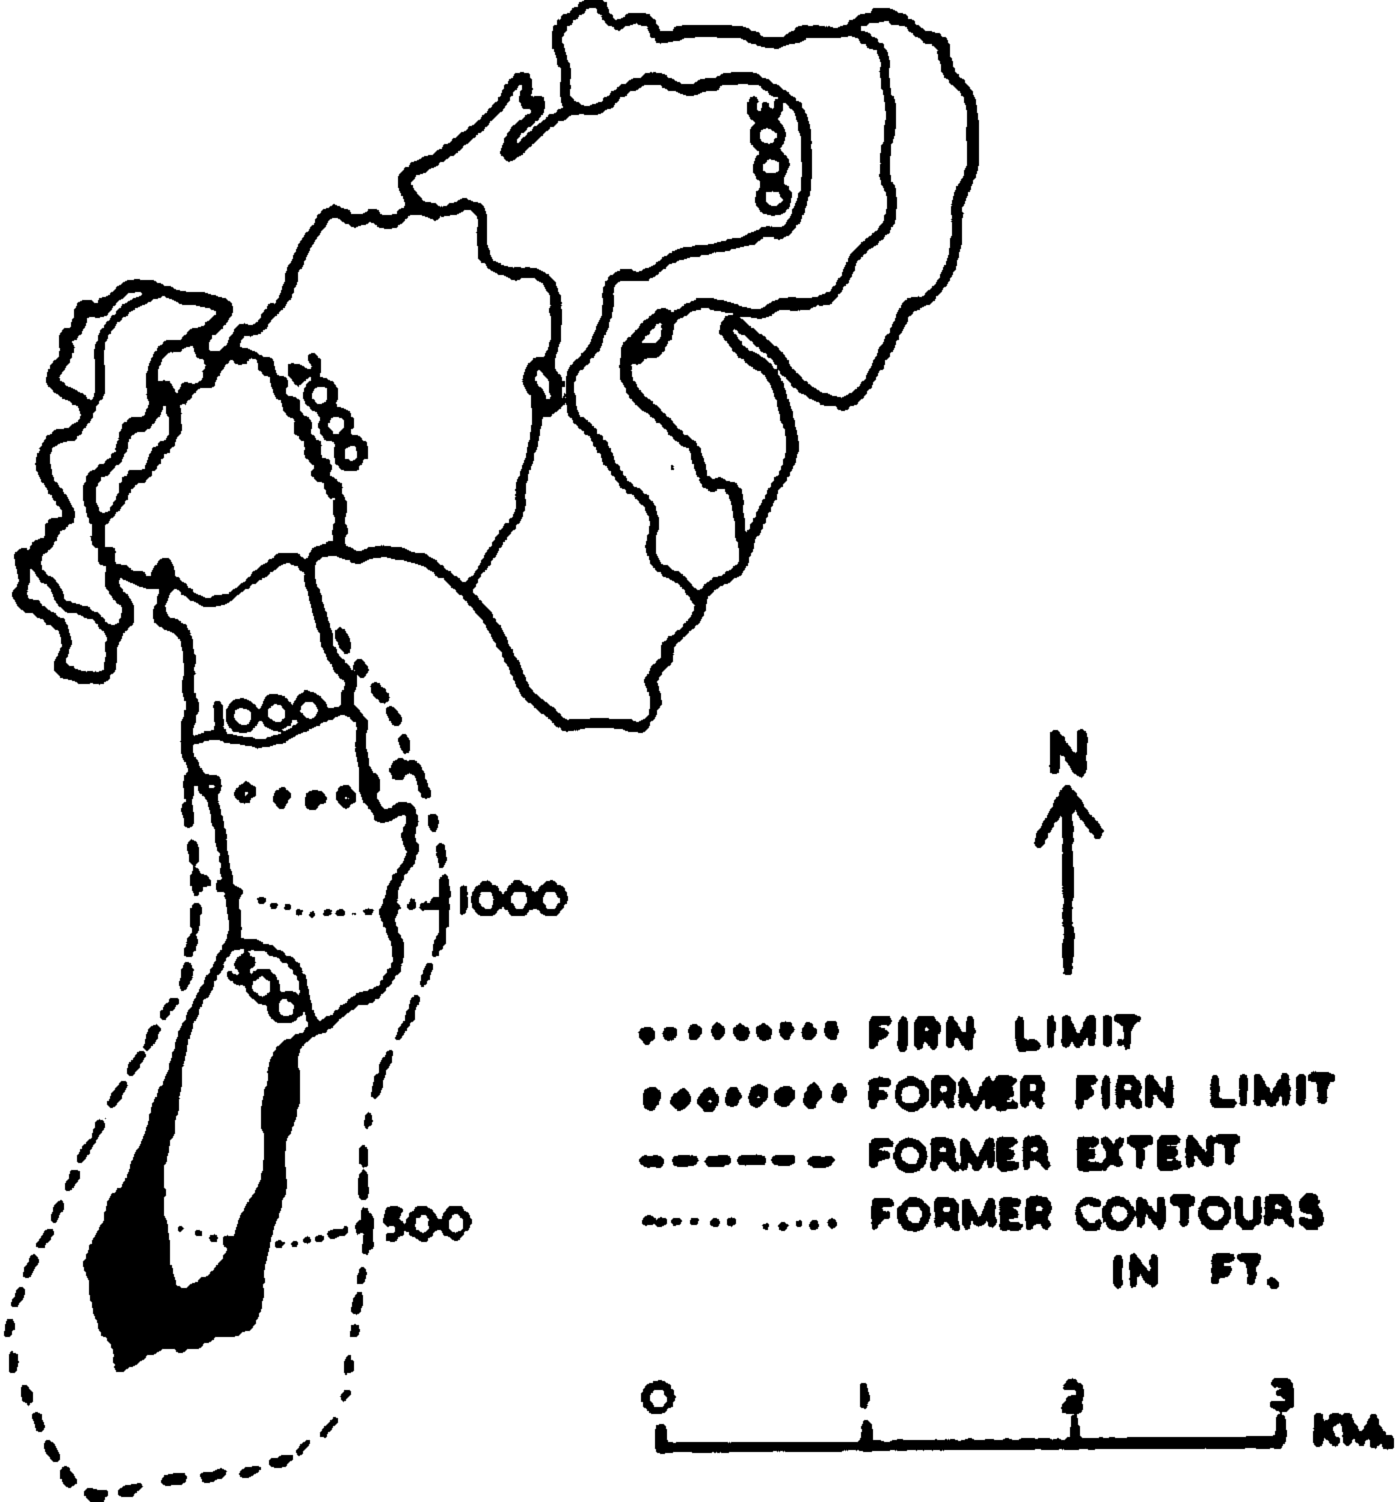
Fig. 6. Present and former extents and surface contours of the Saddlebag Glacier

Fig. 7. Present and former extents and surface contours of the Laughton Glacier
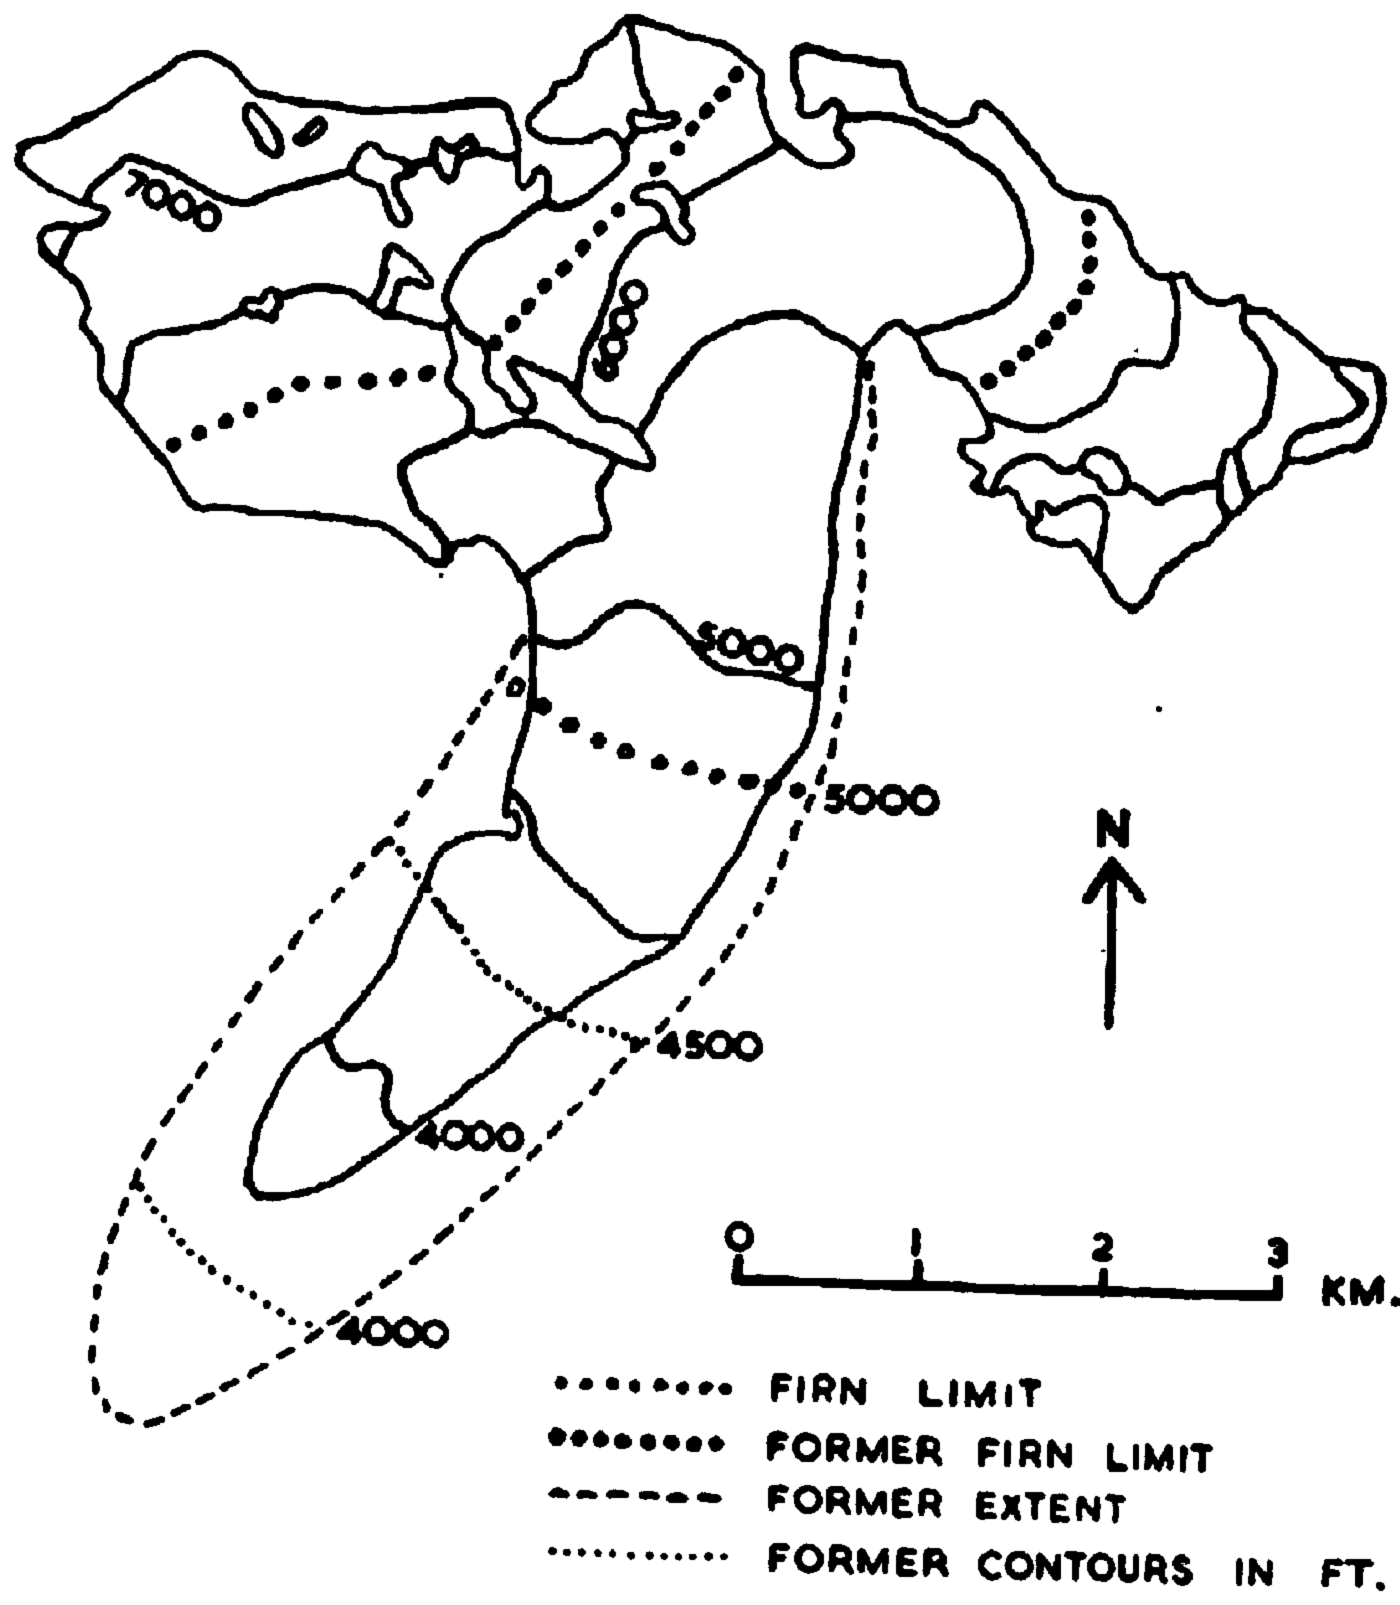
Fig. 8. Present and former extents and surface contours of the Gulkana Glacier
Table IV. Rise In Firn Limit Of Glaciers

Isolines of the rise in firn limit cannot be drawn with the comparatively few results available since differences between the windward and leeward sides of individual mountain ridges confuse the overall picture. The results show, however, that the smallest rise in the firn limit (250 ft., 76 m.) has taken place round Prince William Sound and the largest (1,250–1,500 ft., 380–460 m.) in the inland and southern coastal areas, though the rise of only 500 ft. (152 m.) in the Mt. McKinley area is anomalous. That the figures are of the right order of magnitude is suggested, for instance, by the observed rise of 984 ft. (300 m.) of the firn limit in the Caucasus.Reference Tsomaya 6
The maximum extents may have been reached at different times during the recent period of general advance; furthermore, there is also evidence for maximum stages of the ice, in Icy and Yakutat Bays for example, many centuries ago,Reference Plafker and Miller 7 and massive terminal moraines across the mouths of many fjords must be at least as old. The maximum extent considered in this paper, however, is represented by moraines not far from the present ice fronts and usually coinciding with a still visible vegetation trimline.
Recent Records of Climatic Variation in Alaska
Ten-year running means of ablation season temperature (May through September) and annual precipitation of some Alaskan stations since records began are shown in Figure 9. The temperature curves do not show the actual values since it is trends that are significant. The precipitation curves show the percentage deviations from “normal”; since “normal” values have been obtained from different periods of observations, the general trends at different stations are comparable, but not the steepness of the curves. The following facts emerge:
-
a. Higher temperatures have been accompanied by greater precipitation except at Ketchikan where the opposite has occurred.
-
b. All stations except Fairbanks show a pronounced cooling trend beginning between 1943 and 1945. In Sitka this had amounted to 1.1° C. (2° F.) by 1956.
-
c. The changes most favourable to glaciers have occurred at Ketchikan in the extreme south of Alaska, where the ablation season temperature has fallen 0.7° C. (1.2° F.) and the annual precipitation increased by 24 per cent since 1943.
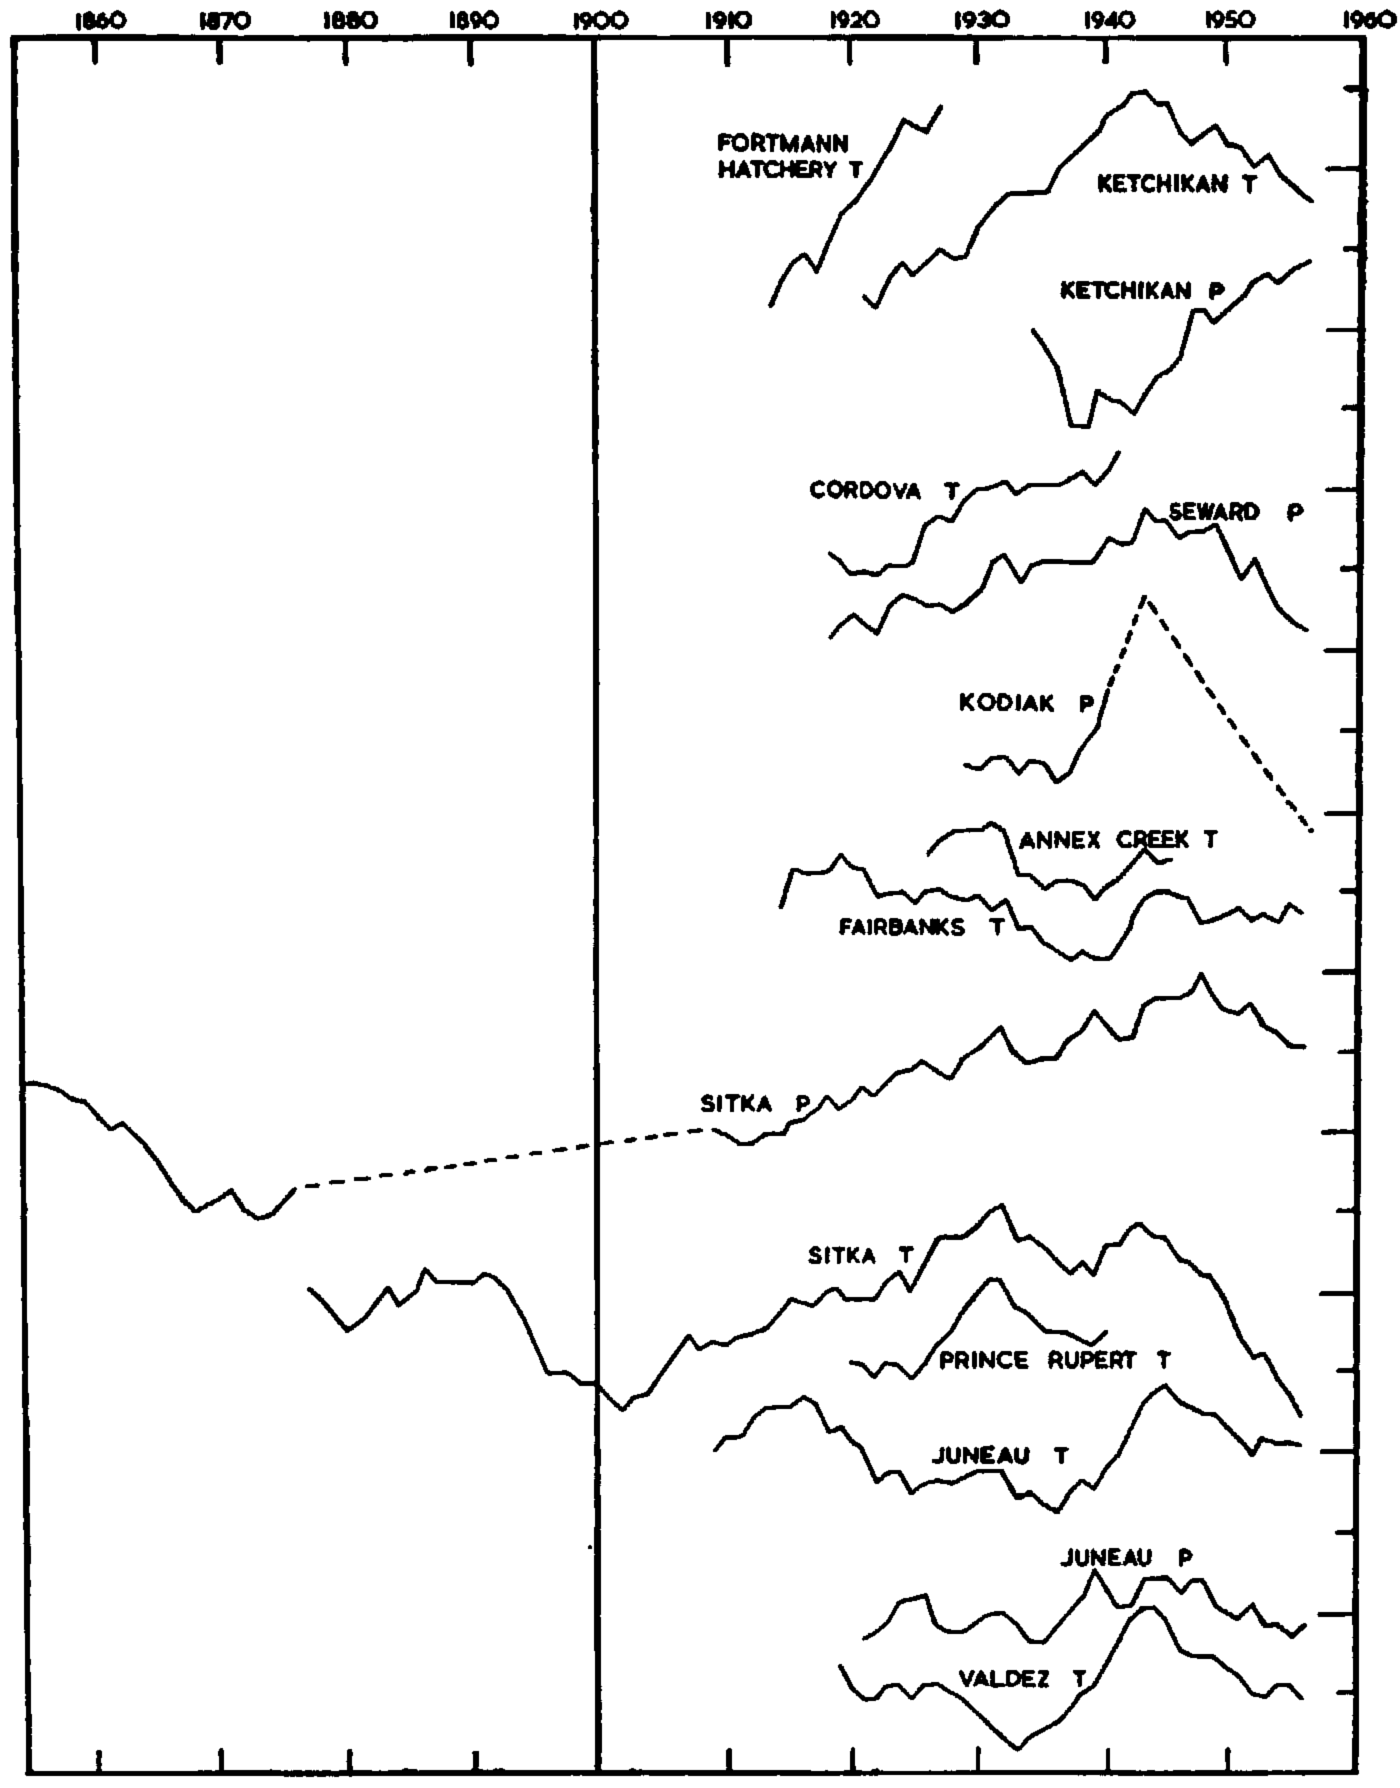
Fig. 9. Ten-year running means of ablation season temperature (April—October) and annual precipitation. Each division represents 0.5° C. or 12.5 per cent change in precipitation. The positions of the coran on the vertical scale are arbitrary


