


1. Introduction
As part of the US National Science Foundation’s (NSF’s) Freshwater Initiative, this paper describes meteorological measurements and the surface energy balance of McCall Glacier, Alaska, USA. The project aims to document changes in the fresh-water inputs in the Arctic hydrological system and how they relate to climate change. Glaciers can provide useful information about historical changes in climate by means of their length or volume changes or through ice-core analysis. McCall Glacier has the longest history of research in Arctic Alaska and was, for this reason, selected for continued long-term research into the glaciological component of the fresh-water cycle.
The first glacio-meteorological investigations on McCall Glacier took place between 1957 and 1958 as part of the International Geophysical Year (Reference OrvigOrvig, 1961). From 1969 to 1971, new glacio-meteorological experiments were carried out by Reference Wendler and WellerWendler and Weller (1974) and Reference Wendler and IshikawaWendler and Ishikawa (1974) as part of the International Hydrological Decade. Measurements of air temperature, ice temperature and ablation, including some temperature–precipitation mass-balance modeling, were also conducted during the 1990s (Reference Rabus and EchelmeyerRabus and Echelmeyer, 1998, Reference Rabus and Echelmeyer2002). Recently, as part of the Freshwater Initiative project, Reference Nolan, Arendt, Rabus and HinzmanNolan and others (in press) investigated the volume changes of McCall Glacier and Reference Pattyn, Nolan, Rabus and TakahashiPattyn and others (2005) examined its basal motion.
This paper presents new data on the climate and the surface energy balance of McCall Glacier. This information is needed to explain glacier retreat and its sensitivity to changing climate, as well as to support future work on spatially distributed mass-balance modeling and ice-core proxy interpretation. In 2003, several automatic weather stations (AWSs) were installed on the ice and in the vicinity of the glacier. In this paper, we mainly describe measurements from two AWSs: one located in the ablation area and the other on a mountain ridge several hundred meters above the glacier.
2. McCall Glacier
McCall Glacier is located at 69°18′ N 143°48′W, in the Romanzof Mountains of the eastern Brooks Range in northeast Alaska (Fig. 1). Like probably all glaciers in northeast Alaska, McCall Glacier has been losing mass over the past century and probably at a rate increasing with time since 1890 (Reference Nolan, Arendt, Rabus and HinzmanNolan and others, in press). Since 1890, McCall Glacier has retreated about 800 m. Its current length is 7.5 km and its area is about 6.5 km2. Total glacierized area in the Romanzof Mountains is about 310 km2 (NSIDC, 1999). Most of these glaciers are small, and McCall Glacier is one of the 14 largest glaciers in the region (whose areas range from 5 to 17 km2). The elevation of McCall ranges from about 1400 to 2400 m, and the equilibrium-line altitude ranges from 2000 to 2400 m.
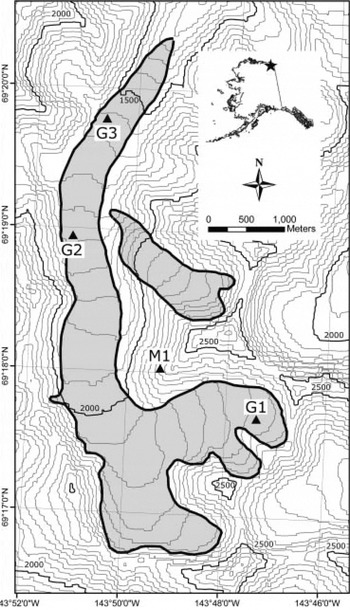
Fig. 1. Location and map of McCall Glacier. The map indicates the locations of the AWSs G1, G2, G3 and M1. The contour map was created from a digital elevation model based on the 1956 US Geological Survey map (Demarcation Point B-5) and the contour interval is 50 m.
The climate of McCall Glacier differs from that of the arctic coastal plain on the north slope of the Brooks Range and also from the continental climate of interior Alaska. It is better described as a mountain climate with higher precipitation than coastal and interior Alaska (Reference Wendler and WellerWendler and others, 1974). McCall Glacier receives about 500 mm precipitation per year, of which half is snow (Reference Wendler and WellerWendler and others, 1974). The dominant precipitation sources are the Bering Sea, about 700 km to the west, and the Arctic Ocean, about 100 km to the north. Wind directions are frequently from the southwest and mean monthly air temperatures at 2275 m a.s.l. have been reported from −30°C in winter to 0°C in summer (Reference Wendler and WellerWendler and others, 1974).
Compared to mid-latitude glaciers or maritime glaciers, McCall Glacier has a short ablation season (about 2.5 months, often less), a small ablation rate (about 1.5 m ice per year at the glacier tongue), and a small mass-balance gradient (about 0.12 m w.e. per 100 m altitude). The glacier is therefore characterized by a small mass turnover (Reference Wendler, Fahl and CorbinWendler and others, 1972; Reference Wendler and IshikawaWendler and Ishikawa, 1974; Reference Rabus and EchelmeyerRabus and Echelmeyer, 1998).
McCall Glacier is a polythermal glacier, which is common for glaciers in the Arctic. Internal accumulation and superimposed ice formation occur in the accumulation zone of McCall Glacier (Reference Wakahama, Kuroiwa, Hasemi and BensonWakahama and others, 1976; Reference Trabant and MayoTrabant and Mayo, 1985). Due to the refreezing of meltwater, the ice temperature of the accumulation area (−1°C) is higher than the annual mean surface temperature there (−11°C). For McCall Glacier’s accumulation area, internal accumulation can be as much as 64% of the annual accumulation (Reference Trabant and MayoTrabant and Mayo, 1985). One region of the mid-ablation area is strongly suspected to be temperate at the bed and with either sliding or warmice deformation accounting for as much as half of the surface motion (Reference Pattyn, Nolan, Rabus and TakahashiPattyn and others, 2005; Reference Nolan, Arendt, Rabus and HinzmanNolan and others, in press).
3. Weather Stations
For our analyses, we used data from four AWSs, which were installed in 2003 and 2004 by the University of Alaska Fairbanks. Here we refer to these stations as G1, G2 and G3, all located on the glacier surface, and M1 located on a mountain ridge (Fig. 1). In field nomenclature these are known as TC2.2, JJMC, P138 and AHAB, respectively.
G2 is a floating station such that the sensor heights remain constant with respect to the ground throughout the ablation season. That is, the station is not fixed rigidly beneath the ice surface, but rather its wide base rests on the surface and lowers with it as it melts. It is situated in the ablation area at 1715 m a.s.l., about 30 m west of and 30 m lower (due to ice melt) than where Reference Wendler and WellerWendler and Weller (1974) and Reference Wendler and IshikawaWendler and Ishikawa (1974) carried out their meteorological measurements. Air temperature and relative humidity (Vaisala HMP45AC in a Young radiation shield) are measured every minute at 1.09, 2.06 and 3.02 m above the surface. These sensors are not fan-aspirated. At the same heights, air temperature is also measured with a fine-wire thermocouple (Campbell Scientific FW3). A sonic height ranger (Campbell Scientific SR50) was attached to a separate structure fixed to the ice and continually measured surface elevation changes caused by ablation and snowfall. Several tens of meters away, two ablation stakes are used for spatial comparison and redundancy in case of instrument failure. Wind speed and direction (Met One 034B) are measured every 5s at 1.70 and 3.05 m. A Kipp and Zonen CNR1 sensor measures the four radiation components (incoming and reflected solar radiation, and incoming and outgoing longwave radiation) at 1.44 m above the surface. This sensor is installed parallel to the surface, within 4° accuracy. Finally, a thermistor string measures ice temperatures every 0.5 m to a depth of 13.5 m. A Campbell Scientific CR10x data logger stores 15 min averages of all the above variables.
By comparing the fine-wire thermocouple and the Vaisala sensor at 2.06 m for the period 27 May–20 August 2004, we concluded that the Vaisala measurement exceeded the thermocouple temperature on average by 0.16°C. The standard deviation is 0.58°C. The difference between the two sensors is explained by heating from solar radiation, which is lower for the thermocouple because it always recorded the lowest temperature. This radiation error increases when wind speeds are low and solar radiation is high, as expected. For situations with wind speeds <2.0 m s−1 and incoming solar radiation >500 Wm−2, mean difference and standard deviation between the Vaisala and thermocouple are 1.30 and 1.59°C, respectively. In the subsequent analyses, we therefore used the 2.06 m fine-wire thermocouple temperature instead of the Vaisala, unless stated otherwise. These differences in air-temperature measurements resulted in only minor changes (<1%) to the modeled ablation rate we calculate later, as the surface energy balance is found to be dominated by net radiation.
M1 (Fig. 1) is the AWS that is located on the mountain ridge above the glacier at 2415 m a.s.l. Here, air temperature and humidity (HMP45AC Vaisala) at 1.0 and 3.0 m, wind speed and direction (Met One 034B) at 3.0 m, and air pressure (Vaisala CS105) are measured. Hourly averages of these variables are stored.
In section 4.2, we will also describe air-temperature measurements at G1 and G3 (Fig. 1). G1 is located in the accumulation area at about 2145 m a.s.l., and G3 near the glacier snout (1509 m a.s.l.). At these locations, temperature (15 min averages) is measured at about 0.9 and 2 m above the surface, with an Onset Computer Corporation 12-bit Temperature Smart Sensor and an Onset H21 Micrologger.
The accuracy of the sensors installed at the various stations is given in Table 1. Between 27 May and 20 August 2004 (days number 148–233), all stations measured continuously, so average weather conditions, the energy balance and total ablation for this period are described in this paper.
Table 1. Specifications of sensors measuring at G1, G2, G3 and M1

4. Analysis of Meteorological Measurements
4.1. Average weather conditions
Weather conditions at McCall Glacier measured at G2 and M1 for 27 May–20 August 2004 are plotted in Figure 2. In Table 2, averages of daily mean, daily maximum and daily minimum temperature, wind speed and relative humidity at these AWSs are given. Daily mean temperature at M1 and G2 ranges between −8 and +12°C (Fig. 2). The average air temperature at G2 over the analyzed period is 5.3°C, and exceeds the average air temperature at M1 by only 1.2°C (Table 2). The average temperature gradient between M1 and G2 is therefore 0.2°C per 100 m altitude, which is much smaller than the standard free atmospheric lapse rate, assumed to be close to 0.6°C per 100 m. For 2004, we measured a mean annual temperature of −11.0°C for M1 and −6.5°C for G2 (both HMP45AC Vaisala). This results in a steeper temperature gradient, of 0.6°C per 100 m altitude. The reason for this increase in the temperature gradient is that during the melt season the air temperature at G2 is always kept near the freezing point by the influence of the glacier ice.
Table 2. Daily means, mean daily maximums and mean daily minimums for temperature, relative humidity and wind speed at G2 and M1, 27 May– 20 August 2004. Values are derived from hourly mean data

Fig. 2. (a) Daily mean air temperature, (b) relative humidity, (c) wind speed and (d) air pressure at M1 and G2 for the period 27 May–20 August 2004 (days 148–233).
Daily mean air temperature and relative humidity at G2 often show the same fluctuations as the measurements at M1 (Fig. 2). However, when hourly mean air temperature and relative humidity are considered, the relationship between M1 and G2 is not so strong. For hourly (daily) mean temperature, the correlation coefficient between M1 and G2 is 0.74 (0.86) and the regression coefficient 1.13 (1.23) over the period 27 May–20 August. For relative humidity, the correlation coefficient is 0.61 (0.79) and the regression coefficient 0.79 (1.10).
Two cold spells occurred during summer 2004: one between 6 and 10 July (days 188–192), and the other between 31 July and 2 August (days 213–216). These cold spells coincide with periods of low air pressure, high relative humidity and high wind speed (Fig. 2). During both periods, a low-pressure system was situated north of Alaska above the Arctic Ocean. This system caused a strong westerly flow at 500 hPa above the eastern Brooks Range and high wind speeds at the surface. Both brought cold, humid air and snow from the northwest to the McCall Glacier area.
However, wind speed measured at G2 did not peak during the second cold spell (especially 1 August, day 214), while daily mean wind speed at M1 shows a clear maximum. Since air temperatures at G2 were below zero at that time, wind sensors were probably frozen. Alternatively, the high wind speeds could have caused shaking of the weather station, loosening the connector or causing a temporary short circuit.
Mean and maximum wind speeds at M1 exceed those measured at G2 (Table 2). When hourly averages are compared, wind speeds measured at M1 and G2 hardly show a relationship, with a standard deviation of 3.1 ms−1 and a correlation coefficient of 0.11. The explanation for this low correlation is that wind at G2 is influenced by katabatic forcing and only partly by the large-scale wind, while wind at M1 is influenced mainly by the large-scale wind (and perhaps also by local effects such as valley winds on warm days).
4.2. Daily variation and glacier wind
In Figure 3 the mean daily variation in air temperature and wind speed is plotted for G2 and M1. The air temperature at M1 shows a clear daily fluctuation with a daily range of 5.3°C. In contrast, G2 hardly shows a daily cycle. (Note that the daily temperature cycle suggested by Table 2 does not show up in Figure 3a because of the method of averaging: Table 2 presents mean daily maxima, whereas Figure 3a shows means for each hour of the day.) The contrast between the daily temperature cycles at G2 and M1 is explained by the fact that air temperature at G2 is influenced by a surface temperature that is almost constantly at melting point. This cooling effect of the glacier is also illustrated in Figure 4, where air temperatures of four stations are plotted for four clear-sky days. Air temperature at M1 fluctuates with an amplitude of about 4°C, and a daily temperature fluctuation is still visible for G1 in the accumulation area (Fig. 1). However, the daily cycle is absent at G2 and G3. Figure 4 also demonstrates that the temperature gradient over the glacier is small. Mean temperature at the glacier snout (G3) over these 4 days exceeds the temperature at the glacier head (G1) by only 0.3°C (0.04°C per 100 m). It is clear that, in this situation, adiabatic heating of the air that travels down along the glacier is to a large extent compensated by cooling due to the exchange of sensible heat with the glacier surface (Reference Greuell and BöhmGreuell and Böhm, 1998).

Fig. 3. Mean daily fluctuation in (a) air temperature and (b) wind speed at M1 and G2 averaged over the period 27 May–20 August 2004.
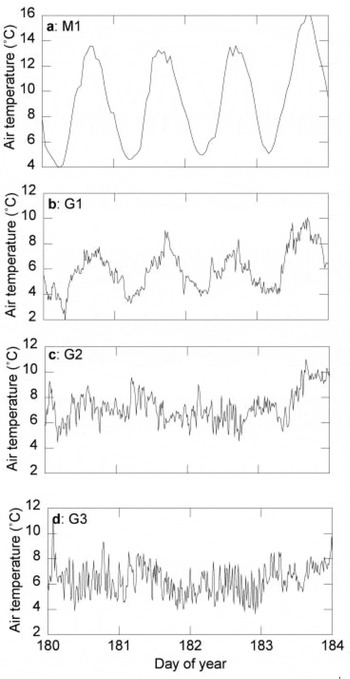
Fig. 4. Air temperature for four clear-sky days at (a) M1, (b) G1, (c) G2 and (d) G3. Measurements at M1 are hourly averages, and at the other stations 15 min averages.
Another marked result in the daily cycle of the meteorological variables is the absence of a wind-speed maximum in the afternoon at G2 (Fig. 3b). We notice that for G2 the mean daily variation in wind speed is small, with a minimum in the afternoon, as at M1. Normally, wind speeds on valley glaciers increase in the afternoon (e.g. Reference Van den BroekeVan den Broeke, 1997; Reference Greuell and SmeetsGreuell and Smeets, 2001) as a consequence of an increased glacier wind due to a stronger temperature deficit in the afternoon (temperature difference between the near-surface layer and the ambient atmosphere). If the temperature at M1 is regarded as a measure for the ambient atmosphere, the temperature deficit at McCall Glacier is largest at around 1500 h (Fig. 3a), which is not translated into a wind-speed maximum at G2 (Fig. 3b). However, the air temperature at M1 is possibly not a representative measure for the ambient temperature that overlies the glacier boundary layer, since it is influenced by warming and cooling of the rock-covered mountain slopes.
Reference Oerlemans and GrisogonoOerlemans and Grisogono (2002) showed the relationship between wind speed and air temperature by plotting measured wind speed against air temperature measured on three glaciers: Morteratschgletscher in Switzerland, Vatnajökull in Iceland and the ablation zone of the West Greenland ice sheet. To investigate the glacier wind at G2 in more detail, we did the same (Fig. 5). Figure 5a reveals a weak linear relationship between air temperatures above melting point and wind speed at G2. It demonstrates that calm periods do not occur at temperatures above the freezing point and that increasing wind speeds are associated with increasing near-surface temperatures, indicative of katabatic forcing. Wind direction measured at G2 also indicates there is a persistent glacier wind (180° (south) is down-glacier) since it hardly varies below wind speeds of 5 ms−1 (Fig. 5b). Above this, winds tend to come from the southeast, in the direction of a large hanging glacier. Further explanations for the fact that glacier wind at McCall Glacier does not peak in the afternoon are given in section 6.1.

Fig. 5. Wind speed at G2 as function of (a) air temperature and (b) wind direction for the period 27 May–20 August 2004 (15 min averages).
5. The Energy Balance and the Specific Mass Balance
5.1 Methods
The energy balance of the glacier surface is described by the sum of the radiative components and the turbulent heat fluxes. The radiative components (incoming and reflected solar radiation, incoming and outgoing longwave radiation) are directly measured by the AWS at G2. Since the radiation sensor was installed more or less parallel to the glacier surface, a correction for incoming solar radiation for tilt is not necessary. However, due to the poor cosine response of the CNR1 sensor and the fact that the solar zenith angle exceeded 80° during about 25% of the measurement period, we corrected incoming solar radiation using the method of ‘accumulated albedo’ (Reference Van den Broeke, van, Reijmer and van de WalVan den Broeke and others, 2004). This method calculates incoming solar radiation from measured reflected solar radiation divided by the daily surface albedo derived from incoming and reflected solar radiation measurements.
Although we measured wind speed, air temperature and humidity at different levels, we calculated the turbulent heat fluxes using the bulk method (e.g. Reference MunroMunro, 1989). A profile method is not suitable here, since the difference between the wind speed at the two levels at G2 (1.70 and 3.05 m) is too small. The 3.05 m wind speed is on average only 0.01 m s−1 higher than the 1.70 m wind speed, and only during 32% of the measurement period does wind speed at 3.05 m exceed the wind speed at 1.70 m by more than the accuracy of the sensor (Table 1). This suggests a shallow katabatic flow with a wind-speed maximum at only a few meters above the surface. Under these conditions, a profile method cannot be used (Reference Denby and GreuellDenby and Greuell, 2000).
As input for the bulk method, we used wind speed at 3.5 m, and the fine-wire thermocouple temperature and the HMP45AC relative humidity at 2.06 m. The surface temperature was derived from measured outgoing longwave radiation and the Stefan–Boltzmann law, assuming that snow and ice have unit emissivity in the longwave part of the spectrum. As is standard practice based on ice physics, we also assumed that the air just above the surface was saturated to calculate the surface vapor pressure from surface temperature. For this, we used air pressure measured at M1 and an exponential decay with height to derive air pressure at G2.
Estimating the sensible- and latent-heat fluxes from Monin–Obukhov similarity theory also requires knowledge of the surface roughness length for wind speed, temperature and humidity. Reference Wendler and WellerWendler and Weller (1974) estimated a surface roughness length of 2.4 mm from wind-profile measurements on McCall Glacier. We used this value and calculated the surface roughness length for temperature and humidity from the surface renewal model of Reference AndreasAndreas (1987). The degree of turbulence also depends on the stability of the atmosphere: turbulent heat fluxes are suppressed in stable atmospheric conditions and enhanced in unstable conditions. On melting glaciers, stable conditions predominate because positive air temperatures overlie the relatively cold ice (i.e. temperature inversions). Stability functions account for this effect of stability on turbulence. We applied the stability correction functions from Reference Holtslag and de BruinHoltslag and de Bruin (1988) for stable conditions. Reference AndreasAndreas (2002) recommends these functions for use over snow and ice because of their good properties in stable stratification. For unstable conditions, which only occurred 4% of the time, functions from Reference PaulsonPaulson (1970) were applied.
The subsurface heat flux, which is small at G2, was calculated from the temperature gradient between the surface temperature and the ice temperature measured closest to the ice surface by the thermistor string. Since the thermistor string slowly melted out during the ablation period, the depths over which the thermistor-string measurements apply changed. The depth of the thermistor closest to the surface was derived from the sonic height ranger data. The effective conductivity was calculated from Von Dusen’s equation (Reference Sturm, Holmgren, König and MorrisSturm and others, 1997), assuming a density of 300 kg m−3 for snow and 900 kg m−3 for glacier ice.
To calculate the specific mass balance, daily snowfall amounts were derived from changes in surface height measured by the sonic height ranger at G2. We used a snow density of 300 kgm−3 to translate snow depths into m w.e. Note that we have no direct estimates of snowfall during the period the sonic ranger was not operating (Fig. 8). For this period we estimated snowfall at G2 using data from sonic height rangers located elsewhere on the glacier (near G1, from a station not shown in Fig. 1). We calculated the amount of melt from the surface energy balance and the amount of sublimation and deposition from the latent-heat flux.

Fig. 8. Specific mass balance as measured by the sonic height ranger and the ablation stakes (squares), and modeled from the surface energy balance at G2. All records start at 15 June (day 165), and the modeled specific mass balance ends at 20 August 2004 (day 233). The error bars at 20 August indicate the accuracy of the modeled (thin error bar; section 6.2) and measured (thick error bar; section 5.3) specific mass balance.
5.2. Energy fluxes
Energy fluxes presented in this study are defined as positive when directed towards the surface and therefore tending to warm or melt ice. Figure 6a depicts daily net solar radiation, net longwave radiation and the turbulent heat fluxes, calculated for the period 27 May–20 August 2004. The largest flux over this period is outgoing longwave radiation, with a daily average of −313 Wm−2. It is nearly constant during the entire period since the surface was at melting temperature. The second largest energy flux is incoming longwave radiation (daily average is 284 W m−2). Incoming daily-average solar radiation shows the largest day-to-day fluctuations (from 32 to 284 W m−2), and its average over the period 27 May–20 August is 181 W m−2. Average reflected solar radiation is −71 W m−2, implying an average albedo of 0.39. The average sensible- and latent-heat fluxes are 27 and 5 W m−2, respectively. The subsurface heat flux is −5 W m−2. Net solar radiation is clearly the largest flux contributing to the surface energy balance. Except for a few days, net longwave radiation is negative.

Fig. 6. (a) Daily means of the net solar radiation (S net), net longwave radiation (L net) and the sensible- (Q H) and latent- (Q L) heat fluxes. (b) Daily surface melt and snowfall. (c) Daily mean albedo at G2. The period is 27 May–20 August 2004 (days 148–233).
The mean daily cycle in the energy fluxes is presented in Figure 7. Only solar radiation (incoming and reflected) reveals a strong daily fluctuation. Longwave radiation and the turbulent fluxes are nearly constant throughout the day, being a consequence of the small daily variations in air temperature and wind speed (Fig. 3).

Fig. 7. Mean daily cycle in incoming (S in) and reflected (S out) solar radiation, incoming (L in) and outgoing (L out) longwave radiation and the sensible- (Q H) and latent- (QL) heat fluxes at G2. The daily fluctuations are averages over the period 27 May–20 August 2004.
Daily mean albedo is shown in Figure 6c. The measurements indicate that during both cold spells (section 4.1) the glacier surface was covered by fresh snow. During days that ice was exposed, the albedo was around 0.19, which is a measure for the ice albedo at G2. The measured minimum daily albedo is 0.17. This rather low value is discussed in section 6.3.
5.3. Sonic height ranger and ablation-stake measurements
Estimating the specific mass balance from the sonic height ranger and the ablation stakes for comparison to the modeled specific mass balance is not a straightforward exercise in this case. Because the pole of the sonic height ranger melted out during the ablation period and was not reset for several weeks, the measurement record contains a data gap (Fig. 8). We therefore correlated the sonic height ranger data to the ablation-stake data to reconstruct the measurement time series. From the sonic height ranger we derived the onset and termination of ice melt and from the ablation stakes the total amount of ice melt.
The distance between the sonic height ranger and the ice surface was 0.48 m when it was installed in spring 2004. All snow must thus have disappeared when the sonic ranger measured this distance (15 June). Next, we determined from the sonic height ranger that ice melt stopped around 23 August because the surface height remains constant after this date. The period of ice melt thus lasted >2 months. Ice melt between 15 June and 9 August was 1.79 m, according to the average of the two ablation stakes, and was 0.39 m between 9 and 23 August. Hence total ice melt between 15 June and 23 August was 2.18 m. The expected accuracy of this estimate is ±0.1 m due to uncertainties in measuring the ablation stakes and spatial variation. A snow density of 300 kg m−3 and an ice density of 900 kg m−3 was used to translate the surface height changes measured by the sonic height ranger into water equivalent thicknesses.
5.4. Glacier melt, snowfall and the specific mass balance
Figure 6b shows daily melt rates calculated from the surface energy balance and snowfall as measured by the sonic ranger. The daily melt rate peaks in late June and early July, at the solar maximum, and declines throughout the summer. Variations in the surface albedo (Fig. 6c) also impact the modeled melt rate: high albedos coincide with low melt rates, as the high albedo caused by snowfall significantly decreases net solar radiation.
We calculated the specific mass balance over the period 15 June–20 August (days 167–233), since over this period the specific mass balance is known from the sonic height ranger and energy-balance measurements are available. The sonic height ranger together with the ablation-stake data measured a specific mass balance of −1.94 ± 0.09 m w.e. over this period (Fig. 8). The modeled specific mass balance calculated from the energy-balance measurements is −2.06 m w.e. for this period (Fig. 8), which is an overestimation of 0.12 m w.e. or 6% compared to the sonic height ranger data. The modeled specific mass balance is the sum of 0.12 m w.e of snowfall, 0.003 m w.e. of deposition and −2.18 m w.e of melt. The largest discrepancy between the two time series begins during the last major snowfall, when the sonic ranger tipped over. Therefore, we are probably underestimating the amount of snowfall.
In Figure 9, modeled daily specific mass balance is compared to specific mass balance derived from the sonic height ranger. The mean difference between the modeled and measured values is 1 mm w.e. and the standard deviation is 9 mm w.e. The latter value equals the accuracy of the sonic height ranger (Table 1).

Fig. 9. Modeled daily specific mass balance (smb) (derived from the surface energy balance) vs measured (derived from sonic height ranger and ablation-stake data) daily specific mass balance at G2.
Table 3 lists the mean surface energy fluxes over the period that the specific mass balance was calculated. The radiation balance contributes most to the energy available for melting (74%).
Table 3. Average daily energy fluxes (W m−2) in the ablation area measured over the ablation period: incoming (S in), reflected (S out) and net (S net) solar radiation (α); incoming (L in), outgoing (Lout) and net (L net) longwave radiation; net radiation (R net); sensible- (Q H) and latent- (Q l) heat fluxes; subsurface heat flux (G) and the energy involved in glacier melt (Q M). McCall 2004 are results of this study, and McCall 1970 and 1971 from Reference Wendler and WellerWendler and Weller (1974) and Reference Wendler and IshikawaWendler and Ishikawa (1974), respectively. Data of Pasterzenkees, Austria, are from Reference Greuell and SmeetsGreuell and Smeets (2001) and of Morteratschgletscher from Reference Klok and OerlemansKlok and Oerlemans (2002)

6. Discussion
6.1. Glacier wind and afternoon maximum
The results in section 4.2 demonstrate that at G2 the glacier wind does not peak in the afternoon, not even on clear-sky days with high solar radiation and high air temperatures. Afternoon wind-speed maxima are normally found on glaciers at lower latitudes, due to melt processes keeping the near-surface temperature cooler than the ambient atmosphere. Following the reasoning of Reference Streten, Ishikawa and WendlerStreten and others (1974), who carried out wind observations on McCall Glacier, there is probably insufficient contrast between the temperature of the ambient atmosphere and the glacier surface to produce a wind maximum during the day, since McCall is at a high elevation and latitude. During the night, however, the temperature inversion reaches a maximum because of radiative cooling of the surface (Reference Streten, Ishikawa and WendlerStreten and others, 1974). This leads to a nocturnal wind-speed maximum. This maximum is also indicated by our measurements (Fig. 3).
A further factor that explains the absence of the afternoon wind-speed maximumat McCall is the up-glacier valley wind that probably retards the glacier wind during the afternoon (Reference Streten, Ishikawa and WendlerStreten and others, 1974). Such gentle winds that cause an up-glacier flow certainly occur now and then, since we often observed fog coming in during the afternoon from lower elevations. This fog typically creeps up the glacier to just above G2. The significance of this fog on spatial and temporal variations in mass balance has not yet been evaluated.
6.2. Sensitivity and accuracy of the calculations
To test the sensitivity in the calculated energy balance and the specific mass balance, we changed some input parameters and parameterizations. The resulting changes in the radiation balance, the turbulent heat fluxes and the specific mass balance over the period 15 June–20 August 2004 are listed in Table 4.
Table 4. Change in mean net radiation, the turbulent heat fluxes and the specific mass balance over the period 15 June–20 August 2004 with regard to the reference situation (where R net is 93 W m−2, Q H + Q L is 37 W m−2 and the specific mass balance is −2.06 m w.e.) for varying parameters and parameterizations

It is shown in Table 4 that a correction for the stability of the atmosphere is very important. Applying no stability correction functions to calculate the turbulent fluxes for the analyzed period, in which stable conditions predominate, increases the turbulent heat fluxes by 43%. The stability correction is large and has a strong impact on the calculated turbulent fluxes because the relatively low wind speeds at G2 favor stable stratification.
The turbulent heat fluxes increase by 8 W m−2 when the 1.70 m instead of the 3.05 m wind speed is used as input for the calculations. Since wind speed at these two levels does not differ much (section 5.1), using wind speed from a lower level implies a change in the wind profile and an increase in the wind-speed gradient, which leads to larger turbulent fluxes.
Table 4 also shows the importance of changes in the meteorological input variables air temperature, relative humidity, wind speed and net radiation. A positive change in the first three variables leads to an increase in the transport of sensible and latent heat towards the glacier surface, which causes an increase in ice melt at G2 of about 0.1–0.2 m w.e. Increasing net radiation by 10 Wm−2 causes a similar change in the melt rate at G2. When the solar radiation sensor was placed with a 4° tilt to the east relative to the surface, net radiation increased by 5 Wm−2.
If ±5 W m−2 and ±9 W m−2 represent the accuracy of the radiation balance and the turbulent fluxes, respectively (Table 4), and we assume an accuracy of ±3 W m−2 for the subsurface heat flux, the standard error in the energy available for melting (125 Wm−2; Table 3) results in ±11 Wm−2. This value (±9%) represents the uncertainty in the calculated specific mass balance at G2 over the period 15 June–20 August 2004, which then becomes −2.06 ± 0.18 m w.e. The uncertainty is indicated by an error bar in Figure 8 and overlaps with the range within which the measured specific mass balance is estimated.
6.3. Comparison to previous research and other glaciers
The mean air temperature at G2 measured over the analyzed period (5.3°C; Table 2) is larger than the mean temperature of the warmest month measured in 1971 (July), which was 3.2°C (Reference Wendler and IshikawaWendler and Ishikawa, 1974). It is also larger than the mean 1970 July temperature, which was 3.8°C (Reference Wendler and WellerWendler and Weller, 1974). 2004 was an exceptionally warm year in Alaska. For example, Barrow recorded the second warmest summer in about 100 years (personal communication from G. Wendler, 2004).
The measured minimum daily albedo in 2004 was 0.17 (section 5.2). This is smaller than the minimum albedos of 0.28 found by Reference Wendler and WellerWendler and Weller (1974) and 0.20 found by Reference Wendler and IshikawaWendler and Ishikawa (1974) for the same location in 1970 and 1971, respectively. Since 2004 was a year with numerous forest fires in Alaska, the observed increases in soot and dust concentrations on the glacier surface are likely to explain part of the difference.
The individual energy fluxes measured over the time that glacier ice was exposed are similar to those of Reference Wendler and WellerWendler and Weller (1974) and Reference Wendler and IshikawaWendler and Ishikawa (1974) (Table 3). They measured at the same location but for different summer periods. Nonetheless, the energy available for melting was higher in 2004 than in 1970 or 1971. This is due to the large positive sum of net radiation and the large sensible- and latent-heat fluxes caused by the exceptionally warm summer of 2004. The value of 1.94 m w.e. of ice melt measured at G2 for summer 2004 (section 5.4) is around double the values reported by Reference Wendler, Fahl and CorbinWendler and others (1972), who measured about 1.20 and 0.78 m w.e. ice melt for 1969 and 1970, respectively. The most negative previously published specific mass balance at this location was −1.60 m w.e. (annual balance, minimum summer-surface stratigraphic method; Reference Rabus and EchelmeyerRabus and Echelmeyer, 1998). In comparison, the 2003/04 annual balance at this location was −2.42 m w.e. (minimum summer-surface stratigraphic method; Nolan, unpublished data). Discussion of the long-term trends in mass balance and their implications is beyond the scope of this paper, but it may be worth noting that the least negative glacier-wide mass balance year on record was 2002/03 (Nolan, unpublished data), so conclusions on climate change are difficult to draw without a more complete analysis.
Reference Wendler and WellerWendler and Weller (1974) and Reference Wendler and IshikawaWendler and Ishikawa (1974) have already concluded that net radiation is the most important energy source for melting at McCall Glacier. Their measurements, collected in 1970 and 1971, showed that 87% and 60%, respectively, of the melting energy was supplied by net radiation during the period that glacier ice was exposed (Table 3). The present study indicates a value of 74% (section 5.4). These values compare well with similar measurements carried out in the ablation areas of other valley glaciers (Table 3): 65% for Morteratschgletscher (Reference Klok and OerlemansKlok and Oerlemans, 2002), 66% for Storgläciaren, Sweden (Reference Hock and HolmgrenHock and Holmgren, 1996), and 76% for Pasterzenkees, Austria (Reference Greuell and SmeetsGreuell and Smeets, 2001). Nevertheless, net radiation and turbulent heat fluxes are often smaller on McCall Glacier than on glaciers at lower latitudes, due to lower temperatures and less incoming solar radiation. For instance, Table 3 shows that incoming solar and longwave radiation as well as the turbulent heat fluxes are higher on Morteratschgletscher and Pasterzenkees than on McCall Glacier. Consequently, the results support the notion that partitioning of net radiation in the energy available for melting is the same for McCall Glacier and some lower-latitude glaciers. However, the energy fluxes on McCall Glacier are smaller.
7. Conclusions
From the close correspondence between modeled and measured specific mass balance and our sensitivity analyses, it is clear that our instrumentation and methods are reliable enough to make robust conclusions regarding the surface energy balance. The warm summer of 2004 led to high melt rates on McCall Glacier, and a specific mass balance at the glacier tongue of −1.94 ± 0.09 m w.e. between 15 June and 20 August, estimated from sonic height ranger and ablationstake data. The specific mass balance calculated from the surface energy balance for this period is −2.06 ± 0.18 m w.e. This agrees well with the measurements. The largest deviation between the modeled and measured specific mass balance begins at the time the sonic ranger failed, and our model has poor input in regard to snowfall. Comparison of modeled with measured daily specific mass balance indicates a mean difference of 1 mm w.e. Our calculations showed that 74% of the melt energy is supplied by net radiation, which corresponds well both with prior measurements on McCall Glacier and with values found for glaciers at lower latitudes. However, the turbulent heat fluxes and net radiation are often smaller at McCall Glacier than at lower-latitude glaciers due to colder temperatures and less incoming solar radiation.
Compared with energy-balance and ablation measurements in 1970 and 1971 at the same location by Reference Wendler and WellerWendler and Weller (1974) and Reference Wendler and IshikawaWendler and Ishikawa (1974), summer ablation in 2004 was large. This melt is explained by the combination of relatively low albedo, high net radiation and relatively large turbulent heat fluxes in 2004. A total of 74% of the melt energy was supplied by net radiation in 2004 (cf. 87% in 1970 and 60% in 1971), but net radiation was about 45% higher than previous measurements. The low ice albedo in 2004 (0.19) is possibly due to the influence of soot and dust from forest fires that covered a large portion of Alaska. It is clear from these comparisons that there is a complicated interplay between the variables of the surface energy balance, and none of them can be isolated as having significantly changed between the time periods from this analysis, other than perhaps the temporarily low albedo.
This study raises questions about the competition between valley and glacier winds that require further research to resolve. Analysis of meteorological data from the station at the glacier tongue and at a mountain ridge above the glacier reveals that the mean temperature gradient between the two sites is very small in summer (−0.2°C per 100 m altitude) because both stations measure in a different boundary layer. The air temperature at the mountain site shows a clear daily fluctuation that is likely to be due to local heating and cooling of nearby rock slopes. The stations on the glacier tongue show a weakening daily cycle in the down-glacier direction because their temperatures are influenced by the cooling effect of the glacier. Wind-direction measurements and the fact that wind speed shows a weak linear relationship with air temperature lead us to believe that a glacier wind is often present at McCall Glacier. However, wind speed in the glacier’s ablation area does not show a maximum in the afternoon, as is normally observed on glaciers at lower latitudes (Reference Streten, Ishikawa and WendlerStreten and others, 1974). This may be explained by a valley wind that retards the glacier wind during the afternoon or by McCall Glacier’s high elevation and latitude, which lead to a small temperature contrast between the ambient atmosphere and the glacier surface (Reference Streten, Ishikawa and WendlerStreten and others, 1974), but as yet this remains unverified by measurements.
These findings are of interest for modeling the spatial distribution of the energy and mass balance for McCall Glacier. Modeling the spatial distribution requires, first of all, knowledge about the spatial variation in air temperature and wind speed over the glacier. Often, this also requires information about the relationship of air temperatures and wind speeds on the glacier with those outside the glacier boundary system when, for instance, meteorological reanalysis datasets are used as climate input. The results of this study will also inform future process studies that will facilitate a better understanding of the history of the glacier’s dynamics and the changes in fresh-water inputs to the Arctic Ocean in response to recent climate change.
Acknowledgements
We thank W. Greuell and G. Wendler for commenting on the results. We also thank E. Pettit, K. Scott Nolan and B. Rabus for helping to establish and maintain the weather stations; K. Irving for maintaining the telemetry system; and L. Hinzman and the US Fish and Wildlife Service for supporting the project. This work was funded by the NSF’s Arctic System Science Program’s Freshwater Initiative (grant No. 0229705); any opinions, findings and conclusions or recommendations expressed in this material are those of the authors and do not necessarily reflect the views of the NSF. We also thank two anonymous reviewers and the scientific editor, J. Jacka, for comments on the manuscript.


