


1. Introduction
In numerous environmental systems, settling particles often encounter density interfaces that can substantially alter both their vertical descent and horizontal dispersion. In the oceans, for example, when traversing sharp density gradients, microorganisms such as plankton or marine snow demonstrate a marked delay in their settling rates and often accumulate at these density interfaces (Prairie et al. Reference Prairie, Ziervogel, Camassa, McLaughlin, White, Dewald and Arnosti2015). Analogously, density stratification plays a pivotal role in influencing the dispersion patterns of atmospheric pollutants (Chemel & Burns Reference Chemel and Burns2015), dust (Horton et al. Reference Horton, Miura, Onishchenko, Couedel, Arnas, Escarguel, Benkadda and Fedun2016) and volcanic ash (Carazzo & Jellinek Reference Carazzo and Jellinek2013).
Particle settling across density interfaces has attracted attention across diverse scientific fields, predominantly focusing on the observed delay in settling rates. As particles move through a density transition, they experience an increase in drag, which arises when the settling particle entrains the comparatively lighter fluid into a denser lower layer. Such a mechanism gives rise to an additional buoyancy force linked to the concept of drift volume – the volume of fluid displaced by a body in motion. Pioneering work by Darwin (Reference Darwin1953) explored the drift volume of solid bodies in homogeneous fluids, and proposed a connection between the volume spanning the position of the particle and its associated added mass. This concept has subsequently been extensively explored, especially in the stratification of miscible fluids.
For two miscible fluids with a sharp density interface, Srdic-Mitrovic, Mohamed & Fernando (Reference Srdic-Mitrovic, Mohamed and Fernando1999) demonstrated experimentally the significant effects of a density interface on settling of a spherical particle in the range of particle Reynolds number,  $Re \in [1.5, 15]$, showing that minimum velocity occurred in the density interface, and was 10 % lower than the local terminal velocity in the lower fluid layer. Outside of this range, the fluid entrained by the particle was negligible due to flow separation at higher $Re$ and slower motion of the particle at lower $Re$, with drag on the settling particle in the density stratified fluid being similar to that in the homogeneous counterpart. Camassa et al. (Reference Camassa, Falcon, Lin, McLaughlin and Myckins2010) also experimentally and theoretically demonstrated that the entrained buoyant fluid slows down the settling particle beyond its terminal velocity in the lower medium. They noted a non-monotonic connection between the terminal velocities in each fluid layer, and that the minimum velocity occurred shortly after the particle entered the lower layer. This minimum velocity decreased as the density gradient increased and as the initial position of the particle was farther from the density interface. In the experimental studies of Abaid et al. (Reference Abaid, Adalsteinsson, Agyapong and McLaughlin2004), a levitation phenomenon was observed for a falling spherical particle with strong density stratification; the particle sometimes reversed its direction of motion from falling to rising, and to falling again, as it passed through the density interface.
For continuously stratified miscible fluids, the Froude number  $Fr=wN/a$ represents an extent of stratification and plays an important role in characterizing the motion of settling particles; here, $w$ is the particle settling velocity, $N$ is the Brunt–Väisälä frequency and $a$ is the particle radius. Torres et al. (Reference Torres, Hanazaki, Ochoa, Castillo and Van Woert2000) investigated numerically the case of a spherical particle settling in continuously stratified fluid at $Re \in [25, 100]$ and $Fr \in [0.2, 200]$, finding an increasing drag coefficient $C_d$ with $Fr^{-1}$ for $Fr<20$. Compared with the two-layer scenario, it was noted that, even after flow separation at high $Re$, the fluid entrained by the particle was significant enough to increase the drag at sufficiently high density stratification. Yick et al. (Reference Yick, Torres, Peakcock and Stocker2009) experimentally and theoretically studied a similar case with salt-water stratification at $Re \in [0.01, 1.57]$ and $Fr \in [0.09, 6.75]$, and showed a monotonic increase in drag coefficient with $Fr^{-1}$, indicating that stronger stratification causes a larger increase in drag.
Compared with the scenario of a settling particle in miscible fluids, few studies have considered two immiscible fluid layers. The motion of single and multiple particles passing from a higher to lower viscosity fluid was investigated experimentally by Manga & Stone (Reference Manga and Stone1995). They showed that the fluid entrained by the particle eventually detached from the particle and rose through the lower fluid, merging with the upper fluid. Multiple particles tended to slow down, accumulate and cluster near the interface. Pierson & Magnaudet (Reference Pierson and Magnaudet2018a,Reference Pierson and Magnaudetb) experimentally and numerically investigated the dynamics of settling particles, the fluid that they entrained and the influence of the viscosity and density ratios between two fluids. They found that both a viscosity and density jump contributed to the slowdown of the settling rate of the particles when the viscosity of the lower fluid was larger than that of the upper fluid.
While numerous studies have focused on sedimentation processes involving a density interface, our understanding of multi-particle settling remains limited. From a practical standpoint, characterizing the collective behaviour of particles and identifying specific patterns in their movement is crucial for the optimization and control of various industrial processes. In the present study, we investigate particles as they fall through two immiscible fluid layers, paying particular attention to the influence of the upper layer thickness and the spacing between the particles.
2. Experimental set-up
Experiments were conducted in a polycarbonate tank of 600 mm height,  $250\,{\rm mm} \times 250\,{\rm mm}$ cross-section, and 6 mm wall thickness containing a quiescent two-layer fluid medium consisting of ethanol of density $\rho _1 = 0.36\rho _s$ as the top layer, and oil of density $\rho _2 = 0.42\rho _s$ as the bottom layer (figure 1). Spherical glass particles of $d = 4\, {\rm mm}$ diameter and density of $\rho _s = 2200\,{\rm kg}\,{\rm m}^{-3}$ were released in the vicinity of the free surface at the tank centre at varying frequencies. The selected particle size is particularly relevant in industrial and natural flows. The Galileo number, $Ga = \nu ^{-1} (\lvert \rho _s/\rho _f-1 \rvert gd^3)^{0.5}$, where $\nu$ and $\rho _f$ are the local kinematic viscosity and fluid density and $g$ is the gravitational acceleration, was $Ga = 976$ for the upper fluid layer, and $Ga = 16$ for the lower fluid layer. Note that the Galileo number can be linked to the particle Reynolds number through the drag coefficient as follows, $C_d(Re) = 4Ga^2/[3Re^2]$ (Jenny, Dusek & Bouchet Reference Jenny, Dusek and Bouchet2004).

Figure 1. (a) Basic schematic of experimental set-up highlighting the general arrangement of the imaging system and media, (b) details of the customized particle-release mechanism.
A custom-built apparatus dispensed particles consistently at adjustable, constant frequencies. The device has a particle holder, a circular path in cross-section to confine their positions and a 1 mm thick bar connected to a linear actuator. The particle path initiates from a vertical line, attaches to a short bent line and finishes with another short vertical line; see details in figure 1(b). Initially, particles are vertically aligned, moving individually through the remaining path and descending through the reservoir once they are propelled by the bar. The curved path prevents the particles from sliding off without being pushed, enabling them to drop one after the other at a constant frequency matching that of the linear actuator; see additional details in Kang et al. (Reference Kang, Hong, Cheng, Best and Chamorro2023). We investigated particle-release frequencies of  $f_p = 4$, 6 and 8 Hz with the height of the upper layer $H_1/d=10$, 20, 30 and 40. Adjusting $f_p$ allows us to examine how particle proximity affects the settling dynamics and collective motion or interaction effects that can modify particle path stability and rates. Varying $H_1$ also helps us understand how different conditions with two different fluids influence settling due to altered drag and buoyancy force. The particles were released at the centre of the tank and 1 mm above the free surface in order to avoid any disruptions caused by the particle-release mechanism. A thin plate was placed at the fluid surface to minimize minor free surface fluctuations.
The motion of the particles was tracked using two synchronized, high-speed 2.3 MP cameras, positioned perpendicular to each other and operating at a sampling frequency of 150 Hz (figure 1a). Each camera was aligned with the interface between the two fluids, and the region of interest covered the entire part of the upper fluid layer and the lower fluid layer up to 240 mm below the density interface. Accordingly, the spatial resolution ranged from 0.23 to 0.3 mm pixel $^{-1}$, depending on the lateral positions of the particles. A feature-finding and linking approach was used for accurate particle tracking. Features of particles detected in a given frame were connected with corresponding features in the previous frame. In cases where a feature in the last frame could not be linked due to the overlap of two particles, we computed the length and direction of the major and minor axes of the feature, which allowed robust linking. Through this method, we could track the particles comprehensively without missing any. To ensure tracking accuracy, we captured calibration board images at five planes parallel to the field of view for each camera. These calibration images served as a reference for determining the spatial coordinates of tracked particles.
3. Results
3.1. Basic features of the particle trajectories
Figure 2 shows around 800 superimposed particle trajectories, with the  $z$-axis pointing downwards, as they settle through different two-layer medium scenarios at a particle release frequency $f_p = 4\, {\rm Hz}$. The paths of the particles diverge considerably between the two fluid layers. In the upper fluid layer, the trajectories are oblique, indicative of path instability. This behaviour can be attributed to the substantial Galileo number, $Ga= 976$ (Horowitz & Willizmson Reference Horowitz and Willizmson2010). In contrast, the lower fluid layer had relatively straight trajectories, a result of the comparatively smaller $Ga = 16$ (Jenny et al. Reference Jenny, Dusek and Bouchet2004).

Figure 2. Superimposed particle trajectories for various upper fluid layer heights  $H_1/d =$ (a) 10, (b) 20, (c) 30 and (d) 40, all at a particle release frequency of 4 Hz.
The ensemble-averaged lateral particle displacement from the vertical axis of the release location,  $L(z) = [{\sum }_{i=1}^{N} (x_i(z)-x_0)^2+(y_i(z)-y_0)^2 ]/N$, is shown in figure 3. Here, $x_i(z)$ and $y_i(z)$ are the horizontal coordinates of the particles, obtained every 1 mm vertically, $x_0$ and $y_0$ denote the release position and $N$ is the total number of particles. Generally, the lateral displacement increased monotonically in the upper fluid layer and the lower layer to $8d$ below the interface (figure 3a–c). The lateral motion of the particles in the lower layer near the interface demonstrates the span dictated by the influence of viscosity in order to suppress the inertial component. As particles settle further from the interface, the lateral distance remains nearly constant, reflecting the low $Ga$ of the lower fluid medium. The asymptotic lateral distance, $L_f$ (figure 3d), depicts the dependency of this quantity on the thickness of the upper layer, $H_1$, and the release frequency. The value of $L_f$ increased with $H_1$, owing to a longer residence time in the upper fluid layer, where particles encounter significant path instability. In general, $L_f$ decreased as $f_p$ increased, suggesting that the lateral motions of particles were more restrained when particle separations were smaller.

Figure 3. Mean particle lateral displacement from the release position at (a)  $f_p = 4\, {\rm Hz}$, (b) $f_p = 6\, {\rm Hz}$ and (c) $f_p =$ 8 Hz. The grey area includes the region between $z/d=0$ and $z/d=8.$ (d) Ensemble average of the asymptotic lateral distance, $L_f$.
The ensemble average of the particles lateral velocities,  $v_L = (u^2+v^2)^{1/2}$, where $u$ and $v$ are the velocity components in the horizontal $x$- and $y$- directions, is illustrated in figure 4 for the various scenarios. The release of particles near the free surface marks the early stage of particle motion, as shown by the grey shaded areas in figures 4 and 5. The analysis focuses primarily on particle behaviour after this initial stage. The value of $v_L$ exhibits a significant dependence on the particle-release frequency before reaching the interface. Note that $v_L$ was lowest at the highest particle-release frequency. Once past the density interface, $v_L$ decreased substantially, with only a minimal dependence on release frequency and with some slight variation near the density interface.

Figure 4. Mean particle lateral velocity,  $v_L$, for $H_1/d =$ (a) 10, (b) 20, (c) 30 and (d) 40 at various particle-release frequencies. Grey regions indicate the early stage partially affected by air entrainment, and black dashed lines denote the density interface between the two fluids.

Figure 5. Mean particle vertical velocity,  $w$, for $H_1/d =$ (a) 10, (b) 20, (c) 30 and (d) 40 at various particle-release frequencies. Minimum values are indicated with circles.
The aggregate vertical particle velocity,  $w$, depicted in figure 5, exhibited a consistent increase in the upper fluid layer following the initial transient phase, with the exception noted in the $H_1/d = 10$ case, which presented the minimal thickness of the first layer, as shown in figure 5(a). In this case, the initial adjustment encompassed most of the upper layer. As particles approached the interface, their vertical velocity decreased and exhibited a minimum in the lower fluid medium (highlighted by circles in figure 5). Beyond that point, the vertical velocity increased at a very slow rate. Drawing from prior studies (Srdic-Mitrovic et al. Reference Srdic-Mitrovic, Mohamed and Fernando1999; Camassa et al. Reference Camassa, Falcon, Lin, McLaughlin and Myckins2010; Pierson & Magnaudet Reference Pierson and Magnaudet2018b), this behaviour can be attributed to the fluid entrained from the upper layer. The settling velocity is minimized when the volume of the entrained upper fluid is at its peak. As the entrained fluid detaches from the particle, the drag starts to counterbalance the net weight of the particle, resulting in a settling velocity similar to the terminal velocity in a homogeneous medium.
In our experimental analysis, we discerned the presence of the upper fluid trailing in the wake of the particles as they traversed past the density interface (figure 6a). The influence of the thickness of the upper layer on the vertical velocity of the particles is illustrated in figure 6(b,c). To assess the potential interplay of particle interactions, we initially compared the results with the terminal velocity of a single particle in the oil medium,  $w_{T_0} = [(729+3Ga^2)^{0.5}-27]\nu /d$ (Goossens Reference Goossens2020). As shown in figure 6(b), there was a reduction in the local minimum velocity as the thickness of the upper layer increased. This trend suggests that, as particles fall through an increasingly extended upper fluid layer, they are capable of entraining a larger volume of fluid from that layer, thereby enhancing buoyancy.

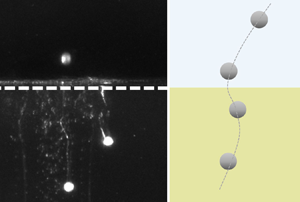
Figure 6. (a) Particles passing through the density interface indicated by the white, dashed line for the  $H_1/d = 10$ case at $f_p = 8\,{\rm Hz}$. (b) Minimum vertical velocity, (c) $H_1$-dependent drag coefficient in the lower fluid medium.
Within the lower fluid medium, the drag coefficient,  $C_d$, was determined using vertical velocities at $z/d = 50$. Figure 6(c) displays these values, normalized by the drag coefficient for an isolated particle in a uniform oil medium, $C_{d_0}$. In the two-layer set-ups, the interplay of particle interactions and entrained fluid produced opposing effects on the drag coefficient. When multiple particles settled concurrently, the trail created by leading particles could potentially influence the others, often resulting in reduced drag. Such a phenomenon has been noted in previous studies regarding multiple particle settling (Fortes, Joseph & Lundgren Reference Fortes, Joseph and Lundgren1987; Uhlmann & Doychev Reference Uhlmann and Doychev2014; Ghosh & Stockie Reference Ghosh and Stockie2015). Concurrently, the entrained fluid can increase drag by inducing supplementary buoyancy prior to its complete detachment from the particle. Figure 6(c) reveals that the normalized drag coefficients predominantly exceed unity. This implies that, even in the presence of inter-particle influences, the aggregate drag coefficient either parallels or surpasses that of a single particle. Thus, even at positions as deep as $50d$ below the interface, the impact of the entrained fluid remained significant in our experimental set-up. The drag coefficient displayed an upward trend with expansion in the thickness of the upper layer, reaching a maximum when $H_1/d=40$. This tendency was less evident at the highest release frequency, where particle interactions had the most pronounced impact.
Figure 7(a) presents a selection of particle trajectories viewed from above, illustrating that the particles underwent abrupt alterations in their drift directions. In figure 7(b), we introduce the pivotal vertical position,  $z^*$, at which this drift reorientation occurs, and define the drift vectors preceding and succeeding this point as $\boldsymbol {L_1}$ and $\boldsymbol {L_2}$. The magnitude of the drift is quantified by the angle between these vectors, given by $\theta = \arccos (({\boldsymbol {L_1} {\cdot } \boldsymbol {L_2}})/({|\boldsymbol {L_1}| \ |\boldsymbol {L_2}|})$. Figure 7(c) shows the mean values of $z^*$ and $\theta$ across all examined scenarios. Note that this alteration in drift direction is manifested not at the density interface, but approximately $8d$ to $9d$ beneath it, concurring with the onset of lateral velocity stabilization in the denser medium, as depicted in figure 4. The drift redirection was pronounced, averaging close to 90 degrees, albeit with some variability across different conditions. This phenomenon arises from the interplay between varying buoyant force across the density gradient, viscosity contrasts between layers, particle inertia and localized flow structures such as vortices at the density interface. As particles move from a less dense to a more dense fluid, they encounter a shift in buoyancy, which coupled with the increased drag from higher viscosity in the lower layer, triggers a reorientation of their drift path. Moreover, particles carry momentum that leads to a temporary change in drift direction until a new equilibrium is found. The presence of flow structures, especially at the interface, further influences this behaviour by altering trajectories based on the particle position relative to these structures and their magnitude. Upon navigating the density interface and descending within the denser fluid, particles shed the inertia previously imparted by the diminishing flow vorticity, a phenomenon reminiscent of the history-related force contribution, as discussed by Boussinesq (Reference Boussinesq1885) and Basset (Reference Basset1888).

Figure 7. (a) Particle trajectories from top view for  $H_1/d = 20$ at $f_p = 8\,{\rm Hz}$, and (b) a closer view of one trajectory. (c) Average value of the pivotal vertical position $z^*$, at which the direction of particle drift changed, with the inset figure showing the average value of change in angle in particle drift direction.
3.2. On the acceleration of particles in proximity to the density interface
The averaged particle acceleration across all release frequencies normalized with respect to gravitational acceleration,  $g$, is depicted for the lateral and vertical components in figure 8, highlighting the variations near the density interface.

Figure 8. Average particle acceleration across all release frequencies near the density interface in (a) lateral and (b) vertical directions for varying thicknesses of the upper fluid layer. The shaded areas illustrate the variation in acceleration among cases with different release frequencies.
The case with  $H_1/d = 10$ showcases a unique trend in particle acceleration, distinct from other scenarios. Here, the density interface acts as a barrier, constraining particle motions in the lateral and vertical directions, as is evident from the negative particle acceleration near the interface. Lateral acceleration $a^*_L$ in figure 8(a) shows reduced deceleration with increasing $H_1$ due to the lower particle velocity in the upper fluid layer near the density interface, resulting in smaller changes before and after the interface (see figure 4). The deceleration in the lateral direction persisted up to approximately $8d$ below the density interface.
Trends in vertical acceleration  $a^*_z$ (figure 8b) reveal a decrease in particle velocity prior to crossing the density interface, a phenomenon also noted by Camassa et al. (Reference Camassa, Falcon, Lin, McLaughlin and Myckins2010), where the interface was likened to a rigid barrier slowing the settling velocity. Peak deceleration occurred at the interface ( $z/d = 0$), indicating significant resistance to the vertical motion of the particles, with the magnitude increasing with larger $H_1$. This deceleration extended into the lower medium, persisting up to roughly $10d$ below the interface, a location indicating the observed minimum in vertical velocity (figure 5).
The spatial distribution of particle acceleration uncovers distinctive patterns. Specifically, figure 9(a) displays the distribution of vertical particle acceleration at three vertical positions: above the interface ( $z/d = -5$), at the interface ( $z/d = 0$) and below the interface ( $z/d = 15$), for a set-up with $H_1/d = 40$ and a release frequency of $f_p = 4\, {\rm Hz}$. At each location, the distributions appear approximately normal, with the greatest variance observed at the density interface. The standard deviation of particle acceleration normalized by $g$ (
$g$ ( $\sigma ^*_{a_L}$ and $\sigma ^*_{a_z}$), as depicted in figures 9(b) and 9(c), consistently reaches a maximum at the density interface. This variance gradually diminishes and approaches a negligible level in the lower medium, approximately $15d$ from the interface.

Figure 9. (a) Histogram of vertical particle acceleration at varying positions relative to the interface: above ( $z/d=-5$), at ( $z/d=0$) and below ( $z/d=15$) for a case with $H_1/d = 40$ and $f_p = 4\, {\rm Hz}$. (b) Standard deviation of lateral particle acceleration, and (c) corresponding vertical particle acceleration. Colours in (b,c) indicate particle-release frequencies: $f_p = 4\, {\rm Hz}$ (black), 6 Hz (blue) and 8 Hz (red). Symbols represent the thickness of the first layer: $H_1/d = 20$ ( $\circ$), 30 ( $\times$) and 40 ( $\triangle$).
3.3. Particle pair dispersion and the role of the interface
The particle pair dispersion,  $R^2 = \langle (r(t)-r_0)^2 \rangle$, was characterized for various initial separations, $r_0$, in all two-layer fluid configurations (figures 11 and 12). Here, $\langle \cdots \rangle$ denotes the averaging operator, and $r(t)$ represents the distance between two particles over time. Within the two-layer fluid environment, the initial separations allow us to classify particle pairs into two categories. The first category, where $r_0$ is less than $H_1$, encompasses pairs where both particles begin in the upper fluid layer. Conversely, in the second category, where $r_0$ exceeds $H_1$, one particle is in the upper fluid layer and the other is in the lower layer. For pairs in the first category, we noted three distinct stages of motion. In the initial stage, both particles are located within the upper fluid layer. The subsequent stage witnesses the leading particle transitioning into the lower fluid layer, while the trailing particle remains in the upper fluid. In the third stage, both particles reside within the lower fluid layer. However, in the second category particle pairs experience only the latter two stages.
In figure 10, the lateral pair dispersion,  $R^2_{L}$, exhibited unique patterns depending on the initial separation and corresponding stages. For particle pairs where $r_0< H_1$ (represented by black ‘+’ symbols in figure 10c,d), the dispersion in the initial stage followed a ballistic scaling $R^2_{L} \sim t^2$. As the lead particle crossed the density interface, there was a noticeable deceleration in the dispersion rate, transitioning to a Taylor scaling $R^2_{L} \sim t$. Once both particles were sufficiently distant from the density interface, the trend in dispersion rate flattened, suggesting a minimal relative velocity between the particle pair.

Figure 10. Lateral pair dispersion,  $R^2_{L}$, for various initial separations, $r_0$ for (a) $H_1 = 10d$, (b) $H_1 = 20d$, (c) $H_1 = 30d$ and (d) $H_1 = 40d$ at a particle-release frequency of $f_p = 4\, {\rm Hz}$.
The pair dispersion behaviour and magnitude were reasonably consistent, irrespective of the initial separations for  $r_0>H_1$ (as depicted by every symbol in figure 10(a,b) and any symbol other than the black ‘+’ in figure 10c,d). Initially, $R^2_{L}$ exhibited a ballistic scaling at a magnitude distinctly lower than the dispersion for $r_0< H_1$. Following this phase, as the trailing particle transitioned through the density interface, the dispersion rate increased to a Richardson scaling $R^2_{L} \sim t^3$. As both particles continued their descent away from the density interface, $R^2_{L}$ plateaued.
Figure 11 examines the impact of the thickness of the upper fluid layer on lateral pair dispersion. These plots show  $R^2_{L}$ across all two-layer experiments, focusing on the smallest initial separation where the particles were in separate fluid layers, essentially the minimum $r_0>H_1$. Across all particle-release frequencies, $R^2_{L}$ tended towards a higher value with a larger upper fluid layer. The different cases plotted in figure 11 highlight that the critical time, $t^*$, at which the dispersion converged, increased with greater $H_1$. This indicates that the trailing particle could disperse more from the leading particle as it settled through the longer upper fluid layer, where it showed considerable lateral movement.

Figure 11. Lateral pair dispersion,  $R^2_{L}$, for the minimum initial separation greater than the first layer thickness $H_1$ at the particle-release frequencies of (a) $f_p = 4\,{\rm Hz}$, (b) $f_p = 6\,{\rm Hz}$ and (c) $f_p = 8\,{\rm Hz}$. (d) Critical time $t^*$ indicating $R^2_{L}$ convergence.
The vertical pair dispersion,  $R^2_{z}$, also showed dependencies on the initial separations and various stages of particle motion. As indicated in figure 12, when $r_0< H_1$, $R^2_{z}$ showed a ballistic regime (black ‘+’ symbols in figure 12c,d). After this phase, as the particles transitioned into the lower fluid layer, the dispersion rate increased significantly, exhibiting a $R^2_{z} \sim t^{5.5}$ scaling. This relationship shows a distinct or super-diffusive dispersion regime, diverging from the classical $t^3$ Richardson scaling known for turbulent pair dispersion. This observation indicates the presence of strong dynamic interactions, or enhanced inertial effects, within the stratified medium. When both particles were sufficiently far away from the density interface, $R^2_{z}$ plateaued similar to the behaviour of $R^2_{L}$. For $r_0>H_1$, $R^2_{z}$ showed a ballistic regime and then converged to a constant value (every symbol in figure 12(a,b) and any symbol other than black ‘+’ symbols in figure 12c,d). In contrast to $R^2_{L}$, the value of $R^2_{z}$ for $r_0> H_1$ was larger than that for $r_0 < H_1$. Figure 13 illustrates $R^2_{z}$ for the minimum initial separation of the particle pair residing in different fluid layers. Similar to the patterns observed in $R^2_{L}$ (figure 11), the final value of $R^2_{z}$ and the critical time $t^*$ increased with increasing $H_1$, indicating that particles can disperse more from each other with larger upper layer thickness in two-layer fluid scenarios.

Figure 12. Vertical pair dispersion  $R^2_{z}$ for various initial separations, $r_0$, indicated in different symbols for (a) $H_1 = 10d$, (b) $H_1 = 20d$, (c) $H_1 = 30d$ and (d) $H_1 = 40d$ at a particle-release frequency of $f_p = 4\, {\rm Hz}$.

Figure 13. Vertical pair dispersion  $R^2_{z}$ for the minimum initial separation greater than the first layer thickness $H_1$ at the particle-release frequencies of (a) $f_p = 4\,{\rm Hz}$, (b) $f_p = 6\,{\rm Hz}$ and (c) $f_p = 8\,{\rm Hz}$. (d) Critical time $t^*$ indicating $R^2_{z}$ convergence.
4. Discussion
The interplay of the particle dynamics within two-layer fluid systems is critical to our understanding complex processes in natural and engineered environments. Our experimental observations underscore the nature of this dynamics and its potential to inform predictions of critical phenomena, such as nutrient transport, microplastic distribution and carbon sequestration rates within marine systems. The Earth's oceans, characterized by diverse stratification due to salinity, temperature, sediment and thus density gradients, manifest complex particle behaviours under external forces similar to those we have explored herein.
In the context of the hydrocarbons and groundwater industries, the interactions between distinct fluid layers, such as oil–water and saline–non-saline water interfaces in porous subsurface reservoirs, can be pivotal in determining extraction efficiency (e.g. Hartley et al. Reference Hartley, Grieser, Mulvaney and Stevens1999; Karolytė et al. Reference Karolytė, Barry, Hunt, Kulongoski, Tyne, Davis, Wright, McMahon and Ballentine2021). The migration of elements, sediments or pollutants through these stratified layers can affect, not only the quality of the extracted fluids, but also the operational lifespan of the reservoir. Insights into particle dispersion in stratified environments are thus critical for optimizing extraction techniques. In addition, the relationship between fluid layer thickness,  $H_1$, and particle dispersion presents distinct prospects for microfluidic applications. By tuning the thickness of fluid layers, it is possible to exert control over particle pathways, offering advantages for precision tasks such as cell sorting or targeted therapeutics delivery.
Fundamentally, the observed transition between the dispersion regimes underscores the interplay between stochastic diffusion and coherent structures within turbulent flows. Taylor dispersion, characterized by a diffusive, random walk of particles, contrasts with Richardson dispersion, where coherent structures dominate particle motion. The dominance of one regime over the other is shaped by external conditions, such as fluid interfaces, which can significantly alter the intrinsic behaviour of turbulence, leading to varying dispersion laws.
The settling patterns of aligned particles within our study have been shown to be modulated by several parameters, namely, particle diameter,  $d$, velocity, $v$, fluid density, $\rho$, kinematic viscosity, $\nu$, gravitational acceleration, $g$, thickness of the upper fluid layer, $H_1$, and particle-release frequency, $f_p$. Governing these patterns are dimensionless quantities such as the particle Reynolds number, $Re$, which is indicative of the flow regime and dispersion dynamics, and the Galileo number, $Ga$, which is instrumental in characterizing the instabilities affecting particle paths and $R^2$. In addition, the stratification parameter, $Sp = H_1/d$, emerges as a fundamental metric to evaluate how variations in fluid layer thickness influence particle dispersion, underscoring the complexity of such dynamical systems and the breadth of their potential applications.
5. Conclusions
Our study of inertial particles settling in line through a quiescent, two-layer medium reveals the significant effect of the thickness of the upper fluid layer  $H_1$ and the particle release frequency $f_p$. In the upper fluid layer (ethanol), the Galileo number was large enough to generate path instability ( $Ga = 976$), and particles dispersed significantly in the lateral direction. While in the lower fluid layer (oil), particles showed nearly straight trajectories with $Ga = 16$, except in the region in the vicinity of the density interface. In this region, up to around eight particle diameters below the density interface, particles moved horizontally even with low $Ga$, indicating that a large viscous effect could not suppress the inertial effects.
As the fluid layer thickness,  $H_1$, increased, we observed a local minimum in the vertical velocity of particles after they traversed the density interface, followed by a subsequent increase. This phenomenon can be attributed to the entrainment of the lighter ethanol from the upper layer into the denser oil layer, which results in augmented buoyancy forces. This entrainment is more pronounced with an increased thickness of the upper ethanol layer, leading to a more noticeable reduction in vertical velocity – the velocity dips become more substantial. This entrainment effect also extends to the particle acceleration dynamics. Near the density interface, we identified a distinct deceleration of particles, underscoring the significant influence of entrainment of the lighter fluid on particle behaviour at this critical juncture. Buoyancy enhancement due to fluid mixing is responsible for this observed deceleration.
Interestingly, when analysing the drag experienced by particles, we noted that the drag coefficient tended to rise with greater values of  $H_1$, suggesting that the increased entrainment, and resultant buoyancy, likely contribute to higher drag forces. However, this correlation did not hold consistently at a particle-release frequency of $f_p = 8\, {\rm Hz}$. At this higher frequency, the trend of increasing drag with thicker fluid layers was less evident. This finding implies that at higher frequencies, particle interactions – potentially resulting from the reduced spacing between particles – begin to dominate the dynamics, overshadowing the effects of entrainment and buoyancy that are more apparent at lower frequencies.
Lateral pair dispersion  $R^2_{L}$ transitioned from an initial ballistic regime to Taylor scaling for $r_0 < H_1$ and Richardson scaling for $r_0 > H_1$. The vertical pair dispersion $R^2_{z}$ initially exhibited ballistic scaling, followed by a rapid growth ( $R^2_{z} \sim t^{5.5}$) for $r_0 < H_1$, while for $r_0 > H_1$, it displayed only a ballistic pattern before stabilizing. In all scenarios, dispersions stabilized when particles became more distant from the density interface, suggesting a negligible relative velocity between particles. The onset of this stabilization was delayed with increasing $H_1$, resulting in enhanced dispersion.
Funding
This research was funded by National Science Foundation grant no. PDM-2207026. We are grateful to S.W. Kieffer for discussions concerning the environmental relevance of the study and providing support from C.R. Walgreen Jr. endowed funds to UIUC.
Declaration of interests
The authors report no conflict of interest.


 Open access