


1. Introduction
Ni et al. (Reference Ni, Zhai, Wang and Hughes2020, henceforth NZWH) point out that mesoscale eddies account for the majority of the ocean's kinetic energy, noting further that dipolar eddies are perhaps the simplest dynamically consistent and potentially ubiquitous features in the ocean. NZWH observe from satellite altimetry and Argo float data that these dipoles have a relatively uniform, surface-intensified, three-structure and propose a composite dipole structure (NZWH, figure 5), reproduced in figure 1 here. From their analysis they note that dipoles promote the vertical motions vital for supplying nutrients to the euphotic zone to support primary production and for sequestering carbon to the deep ocean.

Figure 1. The composite dipole of Ni et al. (Reference Ni, Zhai, Wang and Hughes2020). (a) Composite average of surface pressure anomalies in dipole coordinates. (b) Cross-sections along  $y=0$ of the surface pressure normalised by its magnitude. (c) A vertical cross-section along $y=0$ of the composite dipole. (d) The vertical pressure variation (normalised by its surface value) inside the composite dipole.
The goal of the present study is to show that these observations can be closely modelled by dipole modes of the surface quasi-geostrophic equations derived from a linear reformulation of a model presented by Muraki & Snyder (Reference Muraki and Snyder2007, henceforth MS) and solved there by approximation of a transform function that decays slowly over an infinite interval, integration against a slowly decaying kernel function and then a nonlinear iterative search for a root. The model differs from that of Lahaye, Zeitlin & Dubos (Reference Lahaye, Zeitlin and Dubos2020), who consider dipoles in the thermal quasi-geostrophic equations, where, as they note, fluid moves as vertical columns and so the motion is either barotropic, stretching from ocean surface to floor, or confined to the upper layer of a  $1\tfrac {1}{2}$-layer flow (Warneford & Dellar Reference Warneford and Dellar2013), making extraction of vertical velocity fields more difficult.
This paper is organised as follows. Section 2 summarises the MS derivation of the governing dual integral equations and then demonstrates how the problem can be expressed as the solution of a linear algebraic eigenvalue problem with simple explicit coefficients. Numerical integrations of the nonlinear time-dependent governing equations show that the lowest mode dipole is long-lived and the mode-two dipole breaks up after propagating a distance of the order of three or four radii. Section 3 argues that the composite dipole of NZWH might be a combination of mode-one and mode-two observations and shows that the observations are accurately reproduced by an 80/20 mode-one/mode-two composite model dipole. In particular, the horizontal and vertical structures of the vertical velocity field of the composite model dipole reproduce the reported observations.
2. The governing equations and dipole solutions
The observed dipoles are of limited latitudinal extent, and their radii and velocities are sufficiently small that the Rossby number  $\epsilon =U/fL$ of the flow (for $U$ the dipole propagation speed, $L$ a typical eddy width and $f$ the constant Coriolis parameter) can be taken to be small. Take the ocean to be of depth $H$ and let the stably stratified background density profile have buoyancy frequency $N_0 N(z)$, where $N(z)$ has a maximum of unity. In Cartesian coordinates $Oxyz$, with velocity components $(u,v,w)$, the leading order (in $\epsilon$) non-dimensional inviscid momentum equations are the geostrophic and hydrostatic equations
 \begin{equation} u={-}p_y, \quad v=p_x, \quad \sigma=p_z, \end{equation}
where  $(x,y)$ are scaled on $L$,
$L$,  $z$ on $fL/N_0$, $(u,v)$ on $U$ and $p$ on $\rho _0fUL$ for some representative density $\rho _0$, and $\sigma$ is the buoyancy acceleration scaled on $UN_0$. The equation for the conservation of density in the absence of diffusion is
 \begin{equation} {\rm D}_t\sigma + N^2w = 0, \end{equation}
with  ${\rm D}_t=\partial _t + u\partial _x+v\partial _y$, for time $t$ scaled on $L/U$. This balance between horizontal advection of disturbance density and vertical advection of background density gives the scale of $w$ as $U^2/N_0L=\epsilon U f/N_0$. The system is closed by the continuity equation for incompressible flow, giving to leading order (Johnson Reference Johnson1978)
 $$\begin{gather} {\rm D}_t[p_{xx}+p_{yy} + (N^{{-}2}p_z)_z] =0, \end{gather}$$
 $$\begin{gather}{\rm D}_t[p_z]=0, \quad z=0, -B, \end{gather}$$
where  $B=N_0H/fL$. The boundary conditions (2.3b) come from (2.2) and requiring that $w=0$ on the top and bottom boundaries, with the vanishing of $w$ on the upper boundary following by noting that the horizontal extent of the motion is sufficiently small compared to the external Rossby radius of deformation, $(gH)^{1/2}/f (\approx 2000$ km in the open ocean) that the ocean surface can be taken as rigid. Equation (2.3a) describes the advection of interior potential vorticity (iPV) and (2.3b) states that surface potential vorticity (sPV), and thus buoyancy acceleration, is advected along the upper and lower boundaries. The pressure field, and thus the velocity, are obtained at each instant from the iPV and the sPV through an appropriate Dirichlet–Neumann operator. Various forms of this operator are given in Johnson (Reference Johnson1978), where they are used to construct steady nonlinear eddies in the neighbourhood of seamounts. The temporal evolution of these surface geostrophic equations has subsequently been discussed by Held et al. (Reference Held, Pierrehumbert, Garner and Swanson1995).
The dipoles described by NZWH decay monotonically away from a thin surface layer and appear to be uninfluenced by the ocean floor. It is thus sufficient initially to consider infinitely deep flows ( $B\to \infty$) where the iPV vanishes, as it does for all flows started from rest, with the maximum principle enforcing the monotonic interior decay. The horizontal orientation of the dipole in NZWH is arbitrary, and so for ease of comparison with MS we rotate the axes by ${\rm \pi} /2$ anticlockwise and consider a dipole advancing steadily in the positive $x$ direction at a constant scaled speed of unity into a region of undisturbed fluid. Then, in a frame moving with the dipole, the flow is steady with uniform velocity $-\hat {{\boldsymbol {x}}}$ at large distances. System (2.3) then becomes, for zero iPV,
 $$\begin{gather} p_{xx}+p_{yy} + (N^{{-}2}p_z)_z =0, \end{gather}$$
 $$\begin{gather}\partial(y+p,p_z) =0, \quad z=0, \end{gather}$$
 $$\begin{gather}p_z \to 0, \quad z\to -\infty, \end{gather}$$
where  $\partial ({{\cdot }},{{\cdot }})$ denotes the Jacobian.
Simple fully nonlinear solutions of (2.4) follow by considering solutions where the sPV vanishes outside the modon and looking for a Lamb–Chaplygin-like (Meleshko & van Heijst Reference Meleshko and van Heijst1994) solution where the sPV inside the modon is a linear function of the total streamfunction  $y+p$. Nonlinear sPV–streamfunction relations can be considered only numerically, as in the iterative solutions for vortices on coastal shelves in Crowe & Johnson (Reference Crowe and Johnson2021), and have been observed in simulations of barotropic modon collisions (McWilliams & Zabusky Reference McWilliams and Zabusky1982). The observed dipoles appear to show an exponential decay with depth and so attention is restricted to uniform stratification with $N(z)\equiv 1$. (The form of the solution for finite depth and non-uniform stratification is noted briefly in Appendix A.) Consider circular dipoles of radius unity so
 \begin{equation} p_z= \begin{cases} K(p + y), & x^2+y^2<1, \\ 0, & x^2+y^2>1, \end{cases} \end{equation}
where  $K$ is a constant wavenumber, determined as part of the solution. For steady solutions, the boundary of the non-zero sPV is a streamline,
 \begin{equation} p + y = 0 \quad\text{on } x^2+y^2=1,\ z=0. \end{equation}
 To solve the system of equations (2.4a), (2.5) and (2.6), follow MS, introducing polar coordinates  $(x,y)=(r\cos \phi,r\sin \phi )$ and look for solutions of the form
 \begin{equation} p(r,\phi,z) = \sin\phi\int_0^\infty \hat{p}(\xi){\rm J}_1(\xi r)\exp(\xi z)\xi \,{\rm d}\xi, \end{equation}
where  ${\rm J}_n$ is the Bessel function of the first kind of order n, so $\hat {p}$ is the Hankel transform of $p(r,{\rm \pi} /2,0)$. This form satisfies the governing interior equation. MS derive an integral equation for $\hat {p}$ and, by discretising at 512 points, obtain an algebraically decaying representation of $\hat {p}$, evaluating the infinite integrals numerically and using a nonlinear root-finding method to obtain $K$. The method here gives an economical series solution representation of the solution, with the coefficients and the wavenumber $K$ determined simultaneously as the solution of an explicit standard linear algebraic eigenvalue problem with known rational coefficients, by following Tranter's method (Tranter Reference Tranter1971, p. 111) as in Hocking, Moore & Walton (Reference Hocking, Moore and Walton1979) and achieves the same accuracy as MS using only 12 terms with the smallest neglected coefficient of order 10 $^{-6}$.
Substituting (2.7) in (2.5) gives the dual integral equations
 $$\begin{gather} \int_0^\infty A(\xi){\rm J}_1(\xi r)\,{\rm d}\xi-K\int_0^\infty \xi^{{-}1}A(\xi){\rm J}_1(\xi r)\,{\rm d}\xi = K r, \quad 0\leq r\leq1, \end{gather}$$
 $$\begin{gather}\int_0^\infty A(\xi){\rm J}_1(\xi r)\,{\rm d}\xi = 0, \quad r\geq1, \end{gather}$$
where  $A(\xi )=\xi ^2\hat {p}(\xi )$. Tranter's method consists of looking for a solution for $A(\xi )$ as a sum of terms of the form $\xi ^{1-k}{\rm J}_{2n+1+k}(\xi )$, since terms of this form satisfy (2.8b) identically. Choosing $k=1$ ensures that $p_z$ vanishes at $r=0$ and is bounded at $r=1^-$. Thus, look for a solution of the form
 \begin{equation} A(\xi) = \sum_{n=0}^\infty a_n {\rm J}_{2n+2}(\xi), \end{equation}
where the coefficients  $a_n$ are to be determined. Now
 \begin{equation} \int_0^\infty {\rm J}_{2n+2}(\xi){\rm J}_1(\xi r) \,{\rm d}\xi = \begin{cases} {\rm R}_n(r), & r<1,\\ 0, & r>1, \end{cases} \end{equation}
where  ${\rm R}_n(r)$ is the Zernike radial function $(-1)^n\mathcal {R}^1_{2n+1}(r)$ from the diffraction theory of aberration (Born & Wolf Reference Born and Wolf2019, chapter 9), a polynomial of degree $2n+1$, given by the shifted Jacobi polynomial,
 \begin{equation} \mathcal{R}^1_{2n+1}(r)= r{\rm P}^{(0,1)}_n(2r^2-1) = \sum_{k=0}^n\frac{({-}1)^k(2n+1-k)!}{k!(n+1-k)!(n-k)!}r^{2n+1-k}. \end{equation}
 Equation (2.8b) is satisfied identically, as expected, and the problem reduces to obtaining the eigenvalue  $K$ and coefficients $a_n$ so that (2.9) satisfies (2.8a). Substituting (2.9) in (2.8a) gives
 \begin{align} \sum_{n=0}^\infty a_n \left[\int_0^\infty {\rm J}_{2n+2}(\xi) {\rm J}_1(\xi r)\,{\rm d}\xi-K\int_0^\infty \xi^{{-}1}{\rm J}_{2n+2}(\xi) {\rm J}_1(\xi r)\,{\rm d}\xi \right] = K r, \quad 0\leq r\leq1. \end{align}
Equation (2.10) provides the Hankel transform of  ${\rm J}_{2n+2}(\xi )/\xi$, so that inverting (2.10) gives
 \begin{equation} {\rm J}_{2n+2}(\xi)/\xi = \int_0^1 r{\rm R}_{n}(r){\rm J}_1(\xi r)\,{\rm d} r. \end{equation}
The functions  ${\rm R}_n$ are orthogonal over $0\leq r\leq 1$ with weight $r$ and so multiplying (2.12) by $4(m+1)r{\rm R}_{m}(r)$ and integrating from 0 to 1 gives the linear equation
 \begin{equation} ({\boldsymbol{\mathsf{B}}} - K {\boldsymbol{\mathsf{C}}}) {\boldsymbol{a}} = K{\boldsymbol{c}}, \end{equation}
where  ${\boldsymbol{\mathsf{B}}}$ and ${\boldsymbol{\mathsf{C}}}$ are the matrices and ${\boldsymbol {c}}$ the vector with components
 \begin{align} {\boldsymbol{b}}_{mn} & =4(m+1)\int_0^\infty \xi^{{-}1}{\rm J}_{2m+2}(\xi){\rm J}_{2n+2}(\xi)\,{\rm d}\xi = \delta_{mn}, \end{align}
 \begin{align} {\boldsymbol{c}}_{mn} & = 4(m+1)\int_0^\infty \xi^{{-}2}{\rm J}_{2m+2}(\xi){\rm J}_{2n+2}(\xi)\,{\rm d}\xi \end{align}
 \begin{align} &=\frac{16(m+1)({-}1)^{m-n+1}}{[(2m-2n-1)(2m-2n+1)(2m+2n+3)(2m+2n+5){\rm \pi}]}, \end{align}
 \begin{align} c_m &=4(m+1)\int_0^1 r^2{\rm R}_{m}(r)\,{\rm d} r = \delta_{m0}, \end{align}
where  $\delta _{mn}$ is the Kronecker delta. Thus (2.14) becomes
 \begin{equation} [{\boldsymbol{\mathsf{C}}} - K^{{-}1}{\boldsymbol{\mathsf{I}}}] {\boldsymbol{a}} ={-}{\boldsymbol{c}}, \end{equation}
where  ${\boldsymbol{\mathsf{I}}}$ is the identity matrix. The solution to (2.19) is made unique by the requirement that $p_z$ is continuous across $r=1$, i.e. from (2.8b) and (2.9),
 \begin{equation} \sum_{n=0}^\infty a_n \int_0^\infty {\rm J}_{2n+2}(\xi){\rm J}_1(\xi ) \,{\rm d}\xi = \sum_{n=0}^\infty ({-}1)^n a_n = 0, \quad\text{i.e.}\quad a_0 = \sum_{n=1}^\infty ({-}1)^{n-1} a_n. \end{equation}
 In general, solving inhomogeneous eigenvalue problems like (2.19) and (2.20) is not straightforward and the theory is undeveloped. However, the inhomogeneity is confined here to the first row of (2.19) and so can be treated separately. Relation (2.20) allows  $a_0$ to be replaced in rows below the first in (2.19) to give a linear homogeneous eigenvalue problem for $\hat{\boldsymbol{a}} =\{a_n\}_{n\geq 1}$, with coefficient matrix with elements
 \begin{equation} \hat{\boldsymbol{c}}_{mn}= {\boldsymbol{c}}_{mn} +({-}1)^n {\boldsymbol{c}}_{m0} \quad (m\geq1, n\geq1). \end{equation}
Truncating the sum (2.9) at  $n=N=12$ and solving by any standard method gives a smallest eigenvalue of $K=4.1213$, as obtained by nonlinear root-finding in MS. Higher eigenvalues correspond to modon solutions with interior circular nodal lines. The vector ${\boldsymbol{a}}$ is thus determined to within a multiplicative constant whose value follows from satisfying the first row of (2.19),
 \begin{equation} ({\boldsymbol{c}}_{00}-K^{{-}1})a_0 + \sum_{n=1}^\infty {\boldsymbol{c}}_{0n} a_n = 1. \end{equation}
 This completes the solution, giving the surface buoyancy as a sum of Zernike polynomials in  $x$ and $y$,
$y$,
 \begin{equation} p_z(x,y,0) = \begin{cases} \sin\phi\displaystyle\sum_{n=0}^\infty a_n {\rm R}_n(r) , & r\leq a,\\ 0, & r\geq a. \end{cases} \end{equation}
Appendix B shows that the sum (2.23) can be evaluated directly from a simple three-term recurrence relation without computation of the Zernike polynomials.
The surface pressure can be expressed similarly as a sum of hypergeometric functions, but for computational purposes it more straightforward to obtain  $p(x,y,0)$ from (2.23) by Fourier-transforming in $x$ and $y$, to obtain $\hat {p}_z(k,l)$, for horizontal wavenumber $(k,l)$, obtaining the transform of $p(x,y,0)$ as
 \begin{equation} \hat{p} = \hat{p}_z/\sqrt{k^2+l^2}, \end{equation}
and inverting for  $p$.
$p$.
Figure 2 shows  $p$,
$p$,  $p_z$ and $K(p+r)$ and the corresponding surface pressure field for the lowest and second modes. The graphs of $p_z$ and $K(p+r)$ coincide for $r\leq 1$, verifying that the solution indeed satisfies (2.5).

Figure 2. (a,b) Plots of  $p$,
$p$,  $p_z$ and $K(p+r)$ along $x=0$ for (a) mode one ( $K=4.1213$) and (b) mode two ( $K=7.3421$). (c,d) The corresponding surface pressure fields.
The stability of these steadily propagating solutions can be investigated numerically using the Dedalus package (Burns et al. Reference Burns, Vasil, Oishi, Lecoanet and Brown2020) to solve system (2.3) for infinite depth and zero iPV, i.e. the unsteady version of system (2.4), on the plane  $z=0$ with $p$ obtained from $p_z$ at any instant through the Dirichlet–Neumann operator (2.24), and initial conditions for $p$ and $p_z$ set by (2.23). We take a doubly periodic grid with $(x,y) \in [-25.6,25.6)\times [-25.6,25.6)$ using 2048 grid points in each direction. The domain size is chosen so that there is no significant influence on the vortex from the periodicity. Solutions are integrated for times $0\leq t\leq 50$ using a $(3-\epsilon )$-order three-stage Runge–Kutta scheme. A small hyperdiffusion term with hyperdiffusivity of $3.9\times 10^{-10}$ is included for numerical stability. Long-time integrations for mode one show no tendency to break up. The evolution for a mode-two vortex in figure 3 shows that the vortex is unstable and breaks down in approximately $3.5$ time units, corresponding to the time taken to travel $3.5$ radii. This breakdown time varies weakly with grid resolution and hyperdiffusivity, and solutions may break down faster in a full three-dimensional simulation. The mode-two solutions here are unstable exact solutions of the equations of motion and so survive longer than the ‘coated’ dipole solutions of Couder & Basdevant (Reference Couder and Basdevant1986), which do not satisfy the steady equations and immediately evolve away from their initial state. It is thus possible that mode-two solutions may survive sufficiently long to be observed transiently in the ocean.

Figure 3. The evolution of the surface buoyancy,  $p_z$, of a mode-two modon at times (left to right) $t=2$, 3, 3.5 and 4.
Multiplying the governing equation by  $y$ and integrating over the domain shows that the fluid impulse is conserved during the motion:
 \begin{equation} \mu ={-}\int y p_z r {\rm d}r\, {\rm d}\phi ={-}{\rm \pi} \int_0^1 \sum_{n=0}^\infty a_n {\rm R}_n(r)r^2\,{\rm d} r ={-}\tfrac{1}{4}{\rm \pi} a_0. \end{equation}
For mode one this gives  $\mu \approx 4.8744$ and for mode two $\mu \approx 4.0257$. Similarly, multiplying the governing equation by $p$ and integrating over the domain shows that the fluid energy is conserved during the motion:
 \begin{align} E &= \frac{1}{2}\int p p_z r {\rm d}r\, {\rm d}\phi = \frac{\rm \pi}{2K} \int p_z^2 r \,{\rm d} r +\frac{1}{2}\mu = \frac{\rm \pi}{2K} \int \widehat{p_z}^2 \xi \,{\rm d} \xi +\frac{1}{2}\mu \end{align}
 \begin{align} &= \frac{\rm \pi}{8K} \sum_{n=0}^\infty \frac{a_n^2}{n+1} + \frac{1}{2}\mu, \end{align}
by (2.15). For mode one this gives  $E\approx 9.7488$ and for mode two $E\approx 8.0513$.
3. Modelling the observations
It is possible that the composite dipole of NZWH might combine instantaneous observations of both mode-one and mode-two vortices. Figure 4(a) shows a comparison between the NZWH composite dipole, reproduced in figure 1(b,d) here, and a model composite formed from 80 % mode-one and 20 % mode-two of § 2. Following NZWH, we have rescaled both modons so the first maximum occurs at  $y = 1$ and the maximum pressure is unity. The model composite dipole is then determined by fitting an arbitrary linear combination of the two modes to the profiles in figure 1 to give the optimum 80/20 composite used in figure 4(a) and subsequently. Note that this model composite vortex is not put forward as a solution of the equations of motion. It is simply suggested that approximately 80 % of the observed modons could be mode one while approximately 20 % are the less stable mode two, with the averaging giving the observed composite dipole.

Figure 4. Profiles of normalised pressure for the model (solid black lines) and observed (dashed black lines) composite dipoles. The model composite dipole consists of 80 % mode-one and 20 % mode-two modons. (a) Horizontal, scaled on distance to the first vorticity maximum. (b) Vertical, in metres, including also the decay of the first (red) and second (blue) modes individually.
Figure 4(b) gives a comparison between the vertical structure of the model composite dipole and the reported vertical structure in NZWH, where the vertical decay scale for the model dipole is determined by fitting the model solution to the vertical profile from NZWH. The small discrepancies near the surface are probably due to the presence of a surface mixed layer in the observations. Figure 4(b) includes also the vertical profiles for modes one and two individually, showing that each separately captures the observed behaviour, with mode one differing little from the composite modon.
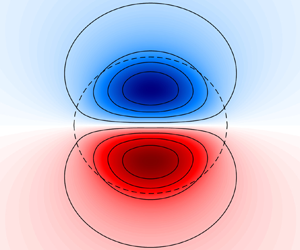
Figure 5 shows the full surface and vertical structure of the model composite. Results have been scaled to match the maximum values and the vertical decay scale of NZWH, reproduced in figure 1(a,c) here.

Figure 5. Profiles of normalised pressure for the model composite dipole. (a) The surface pressure scaled on distance to the first vorticity maximum. (b) A vertical section along  $x=0$ of the pressure, with depth in metres.
Figure 6 shows the vertical velocity at a non-dimensional depth of  $z = -0.185$ corresponding to a dimensional depth of $-680~\text {m}$, calculated from the density equation (2.2), which becomes here
 \begin{equation} w = \partial(p_z,p+y), \end{equation}
giving  $w$ vanishing on the top surface ( $z=0$) from (2.4b) by construction, and showing, as noted in § 2, that in this model the vertical velocity is determined by the balance between horizontal advection of disturbance density and vertical advection of background density. Figure 6 agrees closely with figure 8 in NZWH, suggesting that this frontogenetic vertical velocity is well captured by surface quasi-geostrophic dynamics. The maximum value of $w$ varies with the vortex speed and radius, so we have taken a value here which corresponds to the value in figure 8 in NZWH.

Figure 6. The frontogenetic vertical velocity (m day $^{-1}$ ) inside the model composite dipole. (a) The horizontal pattern of $w$ at 680 m depth. (b) A vertical section along $x=-0.7$.
4. Discussion
We have presented a fast and simple linear explicit method to solve the nonlinear problem for a surface geostrophic dipole posed by MS. The method gives higher-order dipoles directly and we show that a composite model dipole formed from a combination of mode-one and mode-two dipoles fits well the composite dipole put forward from observations by NZWH. Vertical velocities in the model composite dipole arise from the balance between horizontal advection of disturbance density and vertical advection of background density and appear to fit well the observed frontogenetic velocities.
Acknowledgement
The authors are indebted to Professor C. Hughes for comments on a previous draft of this work.
Funding
This work was funded by the UK Natural Environment Research Council under grant number NE/S009922/1.
Declaration of interests
The authors report no conflict of interest.
Appendix A. Finite depth and exponential stratification
Observed profiles of buoyancy frequency vary significantly with depth. In terms of the present variables, the profile proposed by Garrett & Munk (Reference Garrett and Munk1972) for  $N$ below the mixed layer can be written as
 \begin{equation} N ( z ) = N_0 \exp (\mu z), \end{equation}
where  $N_0$ = $\hat {N}\exp ( - H / H_N )$ and $\mu = f L/N_0H_N$, for stratification scale height $H_N$. Garrett & Munk (Reference Garrett and Munk1972) give typical values as $\hat {N}= 3$ cycles per hour and $H_N = 1.3$ km. For finite $B$ and density profile (A1), equations (2.7) and (2.8a) become
 \begin{equation} p(r,\phi,z) = \sin\phi\int_0^\infty \hat{p}(\xi){\rm J}_1(\xi r)k(\xi,z;\mu,B)\xi \,{\rm d}\xi \end{equation}
and
 \begin{equation} \int_0^\infty A(\xi){\rm J}_1(\xi r)\,{\rm d}\xi-K\int_0^\infty \frac{k(\xi,0;\mu,B)}{k_z(\xi,0;\mu,B)} A(\xi){\rm J}_1(\xi r)\,{\rm d}\xi = K r, \end{equation}
for the kernel function (Johnson Reference Johnson1978)
 \begin{equation} k(\xi,z;\mu,B)
= {\rm e}^{\mu z} \frac{{\rm K}_0(\xi
{\rm e}^{-\mu B}/\mu ) {\rm I}_1(\xi {\rm e}^{\mu z}/\mu) +
{\rm I}_0(\xi {\rm e}^{-\mu B}/\mu ) {\rm K}_1(\xi {\rm e}^{\mu
z}/\mu)} {{\rm K}_0(\xi {\rm e}^{-\mu B}/\mu
) {\rm I}_1(\xi /\mu) + {\rm I}_0(\xi {\rm e}^{-\mu
B}/\mu ) {\rm K}_1(\xi/\mu)},
\end{equation}
\begin{equation} k(\xi,z;\mu,B)
= {\rm e}^{\mu z} \frac{{\rm K}_0(\xi
{\rm e}^{-\mu B}/\mu ) {\rm I}_1(\xi {\rm e}^{\mu z}/\mu) +
{\rm I}_0(\xi {\rm e}^{-\mu B}/\mu ) {\rm K}_1(\xi {\rm e}^{\mu
z}/\mu)} {{\rm K}_0(\xi {\rm e}^{-\mu B}/\mu
) {\rm I}_1(\xi /\mu) + {\rm I}_0(\xi {\rm e}^{-\mu
B}/\mu ) {\rm K}_1(\xi/\mu)},
\end{equation}
where  ${\rm I}_n$ and ${\rm K}_n$ are the modified Bessel functions of order n of the first and second kinds. The integrals corresponding to (2.15)–(2.18) must now be evaluated numerically, but the remainder of the analysis is unaltered, and the economy of the expansion and solution remains.
For weakly stratified flows, where  $B\ll 1$ with $z/B$ fixed, $k(\xi,0;\mu,B)/k_z(\xi,0;\mu,B)\to \xi ^{-2}$, the inverse Laplace operator. The exact solution of (A2), (A3) and (2.8b) follows as the depth-independent Lamb–Chaplygin vortex, as demonstrated numerically by MS.
Appendix B. Evaluation of the series (2.23)
The recurrence relation for the radial polynomials gives the three-term recurrence relation
 \begin{equation} {\rm R}_n(r) = \alpha_n(r){\rm R}_{n-1}(r) + \gamma_n{\rm R}_{n-2}(r), \end{equation}
where
 \begin{equation} \alpha_n(r)=\frac{4n^2-(8n^2-2)r^2}{(2n-1)(n+1)}, \quad \gamma_n={-}\frac{(2n+1)(n-1)}{(2n-1)(n+1)}. \end{equation}
The Clenshaw algorithm (Press et al. Reference Press, Teukolsky, Vetterling and Flannery2007, § 5.4.2) then gives, at fixed r, the recurrence relation for the numbers  $S_k$:
 \begin{gather} S_{N+2} =0, \quad S_{N+1} =0, \end{gather}
 \begin{gather} S_k = \alpha_{k+1}(r)S_{k+1} + \gamma_{k+2} S_{k+2} +a_k, \quad k=N,N-1,\ldots,1, \end{gather}
 \begin{gather} \sum_{n=0}^N a_n {\rm R}_n(r) = (2r-3r^3)S_1+(a_0-5S_2/9)r. \end{gather}
This gives the sPV as a polynomial in  $(x,y)$,
 \begin{equation} p_z(x,y) = \sin\phi \sum_{n=0}^N a_n {\rm R}_n(r) = y [(2-3r^2)S_1+(a_0-5S_2/9)]. \end{equation}


 Open access