


1. Introduction
Viscous films flowing along the inside or outside of a tube occur in many biological and engineering contexts; see, for example, Oron, Davis & Bankoff (Reference Oron, Davis and Bankoff1997) and Craster & Matar (Reference Craster and Matar2009) for a review of the varied applications in which these flows arise. Due to both their presence in applications and the rich variety of dynamics possible in these flows, there have been numerous experimental, theoretical and computational studies conducted in recent years. These studies have combined to shed light on the primary mechanisms of instability growth and saturation in a variety of contexts.
The free surface in these flows is often unstable, particularly to long-wave disturbances, and many linear stability studies have carefully outlined the parameter regimes in which the free surface is unstable for falling films, air-driven films, core–annular flows, stratified flows and many others (see e.g. Goren Reference Goren1962; Yih Reference Yih1967; Hickox Reference Hickox1971; Joseph et al. Reference Joseph, Bai, Chen and Renardy1997). For these flows, instability growth can be due to the Kapitza instability, which also arises in flows along inclined planes and is driven by inertial effects; Benjamin (Reference Benjamin1957) and Yih (Reference Yih1963) were among the pioneers in theoretical studies of the critical Reynolds number above which free-surface waves may be observed in falling films. A second instability, the Plateau–Rayleigh instability that occurs in liquid jets, may also arise due to the cylindrical geometry of the tube. The focus here will be on situations where the Plateau–Rayleigh instability is the dominant one.
The long-wave disturbances that grow often saturate well outside the linear regime, which has motivated the development of strongly nonlinear asymptotic models for the evolution of the free surface. For films flowing along the interior of a tube, such models have effectively captured a variety of observed dynamical outcomes in experiments, including axisymmetric wave trains, plug formation, chaotic dynamics and non-axisymmetric disturbances.
These models, based on lubrication theory, may be classified into one of several categories, such as thin-film, long-wave and integral boundary layer models. Thin-film models capture the primary features of these flows and are most amenable to analysis owing to the relatively simple form of the nonlinear terms; examples of such models include those developed by Benney (Reference Benney1966), Frenkel (Reference Frenkel1992) and Kerchman (Reference Kerchman1995). Long-wave models contain more complicated nonlinear terms, arising from the cylindrical geometry of the tube, that can improve the quantitative (and in some cases qualitative) agreement between model and experiments; examples of such models for flow along the interior or exterior of a cylinder include those of Lin & Liu (Reference Lin and Liu1975), Craster & Matar (Reference Craster and Matar2006) and Camassa et al. (Reference Camassa, Forest, Lee, Ogrosky and Olander2012). Integral boundary layer models are able to successfully model flows at moderate Reynolds numbers; see, for example, Dietze & Ruyer-Quil (Reference Dietze and Ruyer-Quil2015) and Dietze, Lavalle & Ruyer-Quil (Reference Dietze, Lavalle and Ruyer-Quil2020) for models of flow inside a tube. The current study is focused on the flow of highly viscous films and is primarily concerned with long-wave models, with discussion of a thin-film counterpart model as well. A brief, and admittedly incomplete, review of these asymptotic models is given next.
The free surface of an axisymmetric film falling along a vertical tube was modelled by Frenkel (Reference Frenkel1992). Kerchman & Frenkel (Reference Kerchman and Frenkel1994) explored numerical simulations of this thin-film model with particular attention paid to the collision of two free-surface waves and the ensuing dynamics, including elastic rebounds or wave mergers. Kalliadasis & Chang (Reference Kalliadasis and Chang1994) used self-similar solutions of Frenkel's model to identify a critical thickness,  $h_c$. For film thicknesses smaller than
  $h_c$, solitary wave solutions were found, with the wave amplitude tending towards infinity as the film thickness increased to some value
  $h_c$ from below; once the thickness of the film exceeded this critical value, no such solutions were found, and the transient model solutions exhibited growth bounded only by the availability of fluid in the domain. This growth is indicative of the formation of large droplets for films on the exterior of a tube, and plug formation for films on the interior. More recently, this work was revisited by Yu & Hinch (Reference Yu and Hinch2013) who obtained higher-order corrections, improving the approximation of the dependence of wave speed on the dimensionless control parameter used. In experiments, Quéré (Reference Quéré1990, Reference Quéré1999) demonstrated that this critical film thickness for drop formation scaled with the cube of the fibre radius, and was independent of fluid viscosity.
Several long-wave models have provided further insight into droplet or plug formation. Craster & Matar (Reference Craster and Matar2006) developed a long-wave model for a falling film on a fibre; this model is very similar to the somewhat ad hoc model of Kliakhandler, Davis & Bankoff (Reference Kliakhandler, Davis and Bankoff2001). Craster and Matar identified three distinct film flow regimes in their model, and found good agreement with experiments they conducted. Linear stability analysis from a spatiotemporal viewpoint was conducted for this model by Duprat et al. (Reference Duprat, Ruyer-Quil, Kalliadasis and Giorgiutti-Dauphine2007), who showed that instabilities could be classified as convective or absolute in good agreement with experiments. A similar model was developed by Camassa, Ogrosky & Olander (Reference Camassa, Ogrosky and Olander2014) and Camassa et al. (Reference Camassa, Marzuola, Ogrosky and Vaughn2016) (also see Lin & Liu Reference Lin and Liu1975) for falling films inside tubes and was shown to accurately capture whether plugs could be expected to form in experiments. Numerical solutions of the model indicated plug formation through the free surface approaching the centre of the tube in finite time, as had been observed in previous models (e.g. Gauglitz & Radke Reference Gauglitz and Radke1988; Johnson et al. Reference Johnson, Kamm, Ho, Ascher and Pedley1991; Halpern & Grotberg Reference Halpern and Grotberg1992; Otis et al. Reference Otis, Johnson, Pedley and Kamm1993). Additionally, travelling wave solutions could be used to predict plug formation; solutions were only found for parameter values that did not result in plugs, with a turnaround point in families of travelling wave solutions indicative of the critical film thickness  $h_c$. This method for predicting plug formation has been successfully applied in other models (see e.g. Ding et al. Reference Ding, Liu, Liu and Yang2019; Dietze et al. Reference Dietze, Lavalle and Ruyer-Quil2020; Ogrosky Reference Ogrosky2021a,Reference Ogroskyb).
The presence of countercurrent gas flow in the core region of a tube can slow or reverse the motion of a film falling down the tube wall. Kerchman (Reference Kerchman1995) developed a thin-film model and conducted an extensive numerical study of both transient and travelling wave solutions. A long-wave model derived by Camassa et al. (Reference Camassa, Forest, Lee, Ogrosky and Olander2012) was shown to provide qualitative agreement with experiments they conducted; this qualitative agreement was improved in a subsequent study by Camassa, Ogrosky & Olander (Reference Camassa, Ogrosky and Olander2017) in which the slope of the free surface is accounted for when estimating the stress exerted by the core flow on the free surface. Integral boundary layer models were derived for co- or countercurrent gas flow inside a channel or tube by Dietze & Ruyer-Quil (Reference Dietze and Ruyer-Quil2013, Reference Dietze and Ruyer-Quil2015), and turning points in the model's travelling wave solution families were successfully used to predict plug formation (Dietze et al. Reference Dietze, Lavalle and Ruyer-Quil2020). A novel method was used for selecting the appropriate wavelength to use when identifying the turning point, and plug formation was categorized as certain, possible or not possible for a variety of Reynolds numbers.
All of the models discussed above were derived using no-slip boundary conditions. Recent asymptotic modelling studies have also provided insight into the role that slip at the wall may play in enhancing free-surface instability. Samanta, Ruyer-Quil & Goyeau (Reference Samanta, Ruyer-Quil and Goyeau2011) studied the impact of slip on films falling down slippery inclined planes. The impact of slip was found to be non-trivial as it destabilized waves near the onset of an instability, but at higher Reynolds numbers, slip at the wall had a stabilizing effect. Samanta, Goyeau & Ruyer-Quil (Reference Samanta, Goyeau and Ruyer-Quil2013) extended this work by allowing for non-negligible porous layer flow and studying the impacts of the porous layer on the film's stability. Hossain & Behera (Reference Hossain and Behera2022) included the impact of shear stress at the film's free surface and studied the impact of slip and shear stress on the stability of a film along an inclined plane. Haefner et al. (Reference Haefner, Benzaquen, Bäumchen, Salez, Peters, McGraw, Jacobs, Raphaël and Dalnoki-Veress2015) used a model to explore the impact of slip on the Plateau–Rayleigh instability for a film along a fibre; both the model and experiments that they conducted demonstrated that wall slip increased the growth rate of instabilities. Ding & Liu (Reference Ding and Liu2011) derived a thin-film equation for the free surface of a film falling down the exterior of a porous vertical cylinder. They showed that in this setting, with effects of gravity included, porosity increased the growth rate of instabilities as well. This work was extended by Ding et al. (Reference Ding, Wong, Liu and Liu2013) who used an integral boundary layer model to study moderate-Reynolds-number flow. Halpern & Wei (Reference Halpern and Wei2017) determined that for films coating a fibre, slip at the wall resulted in larger drops; their results suggested a possible explanation for slight discrepancies between no-slip models and the experiments of Quéré (Reference Quéré1990). For a falling film inside a tube, Liu & Ding (Reference Liu and Ding2017) extended the long-wave model of Camassa et al. (Reference Camassa, Ogrosky and Olander2014) to account for slip due to a porous wall. Their numerical simulations and classification of instabilities as absolute or convective demonstrated that slip promotes plug formation. Chao, Ding & Liu (Reference Chao, Ding and Liu2018) considered a film flowing down a uniformly heated or cooled cylinder wall. The effect of a precursor layer was considered by Ma et al. (Reference Ma, Liu, Shao, Li, Li and Xue2020), who studied a film flowing down the outside of a tube with slip. They found that with a precursor layer, slip decreased the amplitude of the wave front flowing down the tube; without this precursor layer, the model and results confirm those found by Liu & Ding (Reference Liu and Ding2017).
The aim of this paper is to develop an asymptotic model for the flow of a highly viscous film inside a vertical tube with slip at the wall, and to study the impact of wall slip on the characteristics of the flow, including instability growth rates and speed, plug formation and streamline topology. As the model is derived with applications in mind in which the Plateau–Rayleigh instability is dominant over the Kapitza instability, the derivation makes use of assumed small liquid Reynolds number. This model is a long-wave type of model, with gravity, surface tension and countercurrent airflow all included in the derivation; in the limit of no slip the model reduces to that of Camassa et al. (Reference Camassa, Forest, Lee, Ogrosky and Olander2012). To our knowledge, this is the first long-wave model that has simultaneously incorporated all of these effects. The impact of the core flow on the film is estimated in the model using the ‘locally Poiseuille’ approach of Camassa et al. (Reference Camassa, Forest, Lee, Ogrosky and Olander2012); this approach makes use of an assumed laminar profile in the core, though it has also been applied to experiments with turbulent airflow through use of a modified effective viscosity. The case of a passive air core is considered first, in which case the model is identical to that considered by Liu & Ding (Reference Liu and Ding2017) where it was shown that slip promotes plug formation. We explore this further using turning points in travelling wave solution families. This different approach allows a simple formula for the dependence of critical film thickness on slip length, valid for small slip length, to be derived. Countercurrent airflow is considered next, and the impact of slip on streamline topology is examined.
The remainder of this paper is organized as follows. In § 2, a long-wave asymptotic model for the flow of a film with slip lining the interior of a tube is derived; a thin-film counterpart model is also derived. In § 3, linear stability analysis is conducted, and nonlinear solutions are presented in § 4. Conclusions are given in § 5.
2. Model
In this paper we consider an axisymmetric viscous film that lines the interior of a vertical tube. The core region of the tube contains a second, less viscous fluid, taken here to be air. In the model developed below, two cases for the air will be considered: (i) a passive air core (and hence falling film) and (ii) air forced to flow up the tube due to an imposed pressure gradient.
2.1. Governing equations
The flow of the film is governed by the incompressible, axisymmetric Navier–Stokes equations:
 \begin{gather} \bar{\rho}(\bar{u}_{\bar{t}}+\bar{u}\bar{u}_{\bar{r}}+\bar{w}\bar{u}_{\bar{z}})={-}\bar{p}_{\bar{r}}+\bar{\mu}\left[\frac{1}{\bar{r}}\partial_{\bar{r}}(\bar{r}\bar{u}_{\bar{r}})+\bar{u}_{\bar{z}\bar{z}}-\frac{\bar{u}}{\bar{r}^2}\right], \end{gather}
 \begin{gather}\bar{\rho}(\bar{w}_{\bar{t}}+\bar{u}\bar{w}_{\bar{r}}+\bar{w}\bar{w}_{\bar{z}})={-}\bar{p}_{\bar{z}}+\bar{\mu}\left[\frac{1}{\bar{r}}\partial_{\bar{r}}(\bar{r}\bar{w}_{\bar{r}})+\bar{w}_{\overline{zz}}\right]-\bar{\rho}\bar{g}, \end{gather}
 \begin{gather}\frac{1}{\bar{r}}\partial_{\bar{r}}(\bar{r}\bar{u})+\bar{w}_{\bar{z}}=0, \end{gather}
where  $(\bar {u},\bar {w})$ denote velocity in the radial,
  $\bar {r}$, and axial,
  $\bar {z}$, directions respectively, with
  $\bar {z}$ increasing in the upward direction along the tube. Other variables and parameters include pressure
  $\bar {p}$, density
  $\bar {\rho }$, viscosity
  $\bar {\mu }$ and acceleration due to gravity
  $\bar {g}$. Figure 1 shows a schematic of the tube and the variables; additional variables include
  $\bar {R}_0$ denoting the average distance from the tube centre
  $\bar {r}=0$ to the film's free surface, and
  $\bar {R}(\bar {z},\bar {t})$ denoting the distance from the tube centre to the free surface. The radius of the tube is given by
  $\bar {a}$ and
  $\bar {\kappa }$ is a typical length scale in the axial direction, such as a wavelength of a typical disturbance. Quantities with dimensions are denoted with an overbar, and subscripts denote partial derivatives.

Figure 1. Schematic diagram of the rigid tube set-up and definition of variables.
Typically a no-slip boundary condition is applied at the tube wall  $\bar {r}=\bar {a}$. Here, we investigate the effects of slip on the film flow with a Navier slip boundary condition with slip length
  $\bar {\varLambda }$:
 \begin{gather} \bar{w}={-}\bar{\varLambda}\, \bar{w}_{\bar{r}}, \end{gather}
 \begin{gather}\bar{u}=0. \end{gather}
We note that boundary condition (2.2a) also arises in the study of flow of a film along a porous tube wall since, under certain simplifying assumptions, the flow of the film decouples from the flow within the pores. Briefly, the axial velocity in the porous medium, governed by Darcy's law, is given by  $\bar {w}^{(m)}=-\bar {K}(\bar {p}_{\bar {z}}-\bar {\rho } \bar {g})/\bar {\mu }$, where
  $\bar {K}$ is the permeability. Permeability values for natural materials vary widely. Typical values for soils are between
  $10^{-9}$ and
  $10^{-10}$ whereas for clean gravel they are between
  $10^{-7}$ and
  $10^{-9}$. At the fluid–porous wall interface, the Beavers–Joseph boundary condition
  $\bar {w}_{\bar {r}}=-\bar {\alpha }(\bar {w}-\bar {w}^{(m)})/\sqrt {\bar {K}}$ may be used for the axial velocity (Beavers & Joseph Reference Beavers and Joseph1967), where
  $\alpha$ is a parameter with value determined by the properties of the porous medium. If the pore velocity
  $\bar {w}^{(m)}$ is much smaller than the film velocity
  $\bar {w}$, a condition that holds if
  $\bar {K}/\bar {h}_0^2\ll 1$, where
  $\bar {h}_0$ is the mean film thickness, then this boundary condition may be approximated by (2.2a); see, for example, Pascal (Reference Pascal1999) and Liu & Ding (Reference Liu and Ding2017) and references therein for further discussion.
At the free surface  $\bar {r}=\bar {R}(\bar {z},\bar {t})$ we require continuity of tangential stress:
 \begin{equation} (\bar{w}_{\bar{r}}+\bar{u}_{\bar{z}})(1-\bar{R}^2_{\bar{z}})+2(\bar{u}_{\bar{r}}-\bar{w}_{\bar{z}})\bar{R}_{\bar{z}}=\bar{\tau}^{(g)}, \end{equation}
with  $\bar {\tau }^{(g)}$ denoting the tangential stress exerted by the gas flow on the film's free surface; a jump in normal stress (according to the Young–Laplace law):
 \begin{align} &2\bar{\mu}(\bar{u}_{\bar{r}}+\bar{w}_{\bar{z}}\bar{R}^2_{\bar{z}})+\bar{\mu}\bar{R}_{\bar{z}}(\bar{w}_{\bar{r}}+\bar{u}_{\bar{z}})-2\bar{\mu}^{(g)}(\bar{u}_{\bar{r}}^{(g)}+\bar{w}_{\bar{z}}^{(g)}\bar{R}^2_{\bar{z}})-\bar{\mu}^{(g)}\bar{R}_{\bar{z}}(\bar{w}^{(g)}_{\bar{r}}+\bar{u}^{(g)}_{\bar{z}}) \nonumber\\ &\quad = (\bar{p}-\bar{p}^{(g)})(1+\bar{R}_{\bar{z}}^2)+\bar{\sigma}(1+\bar{R}^2_{\bar{z}}) \left(\frac{1}{\bar{R}(1+\bar{R}^2_{\bar{z}})^{1/2}}-\frac{\bar{R}_{\overline{zz}}}{(1+\bar{R}^2_{\bar{z}})^{3/2}}\right), \end{align}
with  $\bar {\sigma }$ the surface tension and superscripts of
  $(g)$ denoting variables in the core gas flow; and the kinematic condition
 \begin{equation} \bar{u}=\bar{R}_{\bar{t}}+\bar{w}\bar{R}_{\bar{z}}. \end{equation}
 There is a steady ‘flat-film’ solution to (2.1)–(2.5) with  $\bar {w}=\bar {w}(\bar {r})$,
  $\bar {p}=\bar {p}(\bar {z})$,
  $\bar {u}=0$ and with free surface
  $\bar {R}=\bar {R}_0$:
 \begin{align} \bar{w}=\frac{1}{4}\left(\frac{\bar{p}_{\bar{z}}^{(g)}+\bar{\rho}\bar{g}}{\bar{\mu}}\right)\left(\bar{r}^2-\bar{a}^2-2\bar{R}_0^2\ln\frac{\bar{r}}{\bar{a}}-\frac{2\bar{\varLambda}}{\bar{a}}(\bar{a}^2-\bar{R}_0^2)\right)+\bar{R}_0\bar{\tau}^{(g)}\left(\ln\frac{\bar{r}}{\bar{a}}-\frac{\bar{\varLambda}}{\bar{a}}\right). \end{align}
In the no-slip limit, i.e.  $\bar {\varLambda }=0$, the velocity profile takes on the form seen in, for example, Camassa & Ogrosky (Reference Camassa and Ogrosky2015). As this solution is unstable to long-wave disturbances, long-wave asymptotics will be used to derive a model for the evolution of the free surface next.
2.2. Model derivation
Equations (2.1)–(2.5) may be made dimensionless using the following reference scales:
 \begin{align} r=\frac{\bar{r}}{\bar{R}_0}, \quad z=\frac{\bar{z}}{\bar{\kappa}}, \quad u=\frac{\bar{u}}{\bar{U}_0}, \quad w=\frac{\bar{w}}{\bar{W}_0}, \quad t=\frac{\bar{t}\bar{W}_0}{\bar{\kappa}}, \quad p=\frac{\epsilon\bar{p}{\bar{R}_0}}{\bar{\mu}\bar{W}_0}, \quad \tau=\frac{\bar{\tau}\bar{R}_0}{\bar{\mu}\bar{W}_0}, \end{align}
where  $\bar {U}_0$ and
  $\bar {W}_0$ are reference velocity scales. Since we will be considering airflow moving up the tube at a constant volume flux due to an imposed pressure gradient, here we use the mean centreline velocity of the air for the axial velocity scale:
 \begin{equation} \bar{W}_0=\frac{2\bar{Q}^{(g)}}{{\rm \pi} \bar{R}_0^2}, \end{equation}
where  $\bar {Q}^{(g)}$ is the (constant) volume flux of air. This choice of scales is similar to that used by Camassa et al. (Reference Camassa, Forest, Lee, Ogrosky and Olander2012). In the following model derivation, the ‘long-wave’ assumption,
 \begin{equation} \epsilon=\frac{\bar{R}_0}{\bar{\kappa}}\ll 1, \end{equation}
is made. Using the relation (2.9), we also obtain that  $\bar {U}_0=\epsilon \bar {W}_0$ due to the continuity equation (2.1c). The exact value of the length scale
  $\bar {\kappa }$, which denotes a typical free-surface wavelength, need not necessarily be specified when deriving the model (though this value could be taken to be one of several reasonable choices, including (i) the most unstable wavelength,
  $2\sqrt {2}{\rm \pi} \bar {R}_0$, arising due to the Plateau–Rayleigh instability as found in § 3, or (ii) the typical wavelength of a travelling wave seen in simulations). Note that while other length-scale ratios could be employed in the asymptotic expansion, the ratio of
  $\bar {R}_0/\bar {\kappa }$ is a natural one to use due to the dependence of the most unstable free-surface wavelength on the mean free-surface radius
  $\bar {R}_0$.
Substituting (2.7a–g) into (2.1)–(2.5) results in
 \begin{gather} \epsilon^3 Re(u_t+uu_r+wu_z)={-}p_r+\epsilon^2\left[\frac{1}{r}\partial_r(ru_r)+\epsilon^2 u_{zz}+\frac{u}{r^2}\right], \end{gather}
 \begin{gather}\epsilon Re(w_t+uw_r+ww_z)={-}p_z+\left(\frac{1}{r}\partial_r(rw_r)+\epsilon^2w_{zz}\right)-\frac{Re}{Fr^2}, \end{gather}
 \begin{gather}\frac{1}{r}\partial_r(ru)+w_z=0, \end{gather}
where  $Re=\bar {\rho }\bar {W}_0\bar {R}_0/\bar {\mu }$ and
  $Fr=\bar {W}_0/\sqrt {\bar {g}\bar {R}_0}$ are the Reynolds and Froude numbers, respectively.
The boundary conditions at the wall  $r=a$ are
 \begin{equation} w={-}\varLambda w_r,\quad u=0.\end{equation}
The boundary conditions at the free surface  $r=R(z,t)$ are given by
 \begin{equation} (w_r+\epsilon^2u_z)(1+\epsilon^2R_z^2)+2\epsilon^2(u_r+w_z)R_z=\tau^{(g)},\\ \end{equation}
 \begin{align} &2\epsilon(u_r+\epsilon^2w_z R_z^2)+\epsilon R_z(w_r+\epsilon^2 u_z)-2\epsilon(u_r^{(g)}+\epsilon^2w_z^{(g)} R_z^2)-\epsilon R_z(w_r^{(g)}+\epsilon^2 u_z^{(g)})\nonumber\\ &\quad=(1+\epsilon^2R_z^2)\left[\frac{p-p^{(g)}}{\epsilon} +\frac{1}{C}\left(\frac{1}{R(1+\epsilon^2 R_z^2)^{1/2}}-\frac{\epsilon^2 R_{zz}}{ (1+\epsilon^2 R_z^2)^{3/2}}\right)\right], \end{align}
 \begin{equation} u=R_t+wR_z, \end{equation}
where  ${C}=\bar {\mu }\bar {W}_0/\bar {\sigma }$ is the capillary number.
In the limit  $\epsilon \to 0$, the governing equations become
 \begin{gather} 0=p_r, \end{gather}
 \begin{gather}\frac{1}{r}(\partial_r(rw_r))=p_z+\frac{Re}{Fr^2}, \end{gather}
 \begin{gather}\frac{1}{r}\partial_r(ru)+w_z=0, \end{gather}
while the boundary conditions at the free surface  $r=R(z,t)$ are
 \begin{gather} w_r=\tau^{(g)}, \end{gather}
 \begin{gather}-p={-}p^{(g)}+\frac{\epsilon}{C}\left(\frac{1}{R}-\epsilon^2R_{zz}\right), \end{gather}
 \begin{gather}u=R_t+wR_z. \end{gather}
While the surface tension terms in (2.14b) do not appear strictly at leading order, they are retained as in numerous other modelling studies of such film flows. These terms have been shown in previous studies to accurately capture the upper bound on unstable wavenumbers, and the second term has been demonstrated to be the lowest-order one that prevents shock formation. For flows down an inclined plane with high surface tension and low volume flux, Gjevik (Reference Gjevik1970) explored the role of these terms in the saturation of instability growth and identified their impact on the phase speed and amplitude of free-surface waves of finite amplitude.
Our model equation for the evolution of the film's free surface may be found by integrating (2.13c) across the fluid layer to obtain
 \begin{equation} R_t-\frac{1}{R}\frac{\partial}{\partial z}\int_R^a wr\,{\rm d}r=0. \end{equation}
 In order to produce a closed model, an approximate expression is needed for  $w$. This may be found by solving (2.13b) for
  $w$ by integrating twice and making use of the boundary conditions (2.11a,b) and (2.14a) to get
 \begin{equation} w=\frac{1}{4}\left(p_z+\frac{Re}{Fr^2}\right)(r^2-a^2-2\tilde{\varLambda} a^2)+\left(R\tau^{(g)}- \frac{R^2}{2}\left(p_z+\frac{Re}{Fr^2}\right)\right)\left(\ln \left(\frac{r}{a}\right)- \tilde{\varLambda}\right),\end{equation}
where  $\tilde {\varLambda }=\varLambda /a$ is a rescaled slip length.
Next, estimates for the stresses  $\tau ^{(g)}$ and
  $p_z^{(g)}$ imparted by the air at the free surface are needed. There are many options for estimating these stresses; here, we use the ‘locally Poiseuille’ approach of Camassa et al. (Reference Camassa, Forest, Lee, Ogrosky and Olander2012) in which a laminar profile for the core flow is assumed. This approach has the advantage of providing an extremely simple estimate of the stresses with the drawback that these estimates have been shown to be underestimates in some experiments with turbulent airflow (though a modified effective viscosity can mitigate these issues; see e.g. Camassa et al. (Reference Camassa, Forest, Lee, Ogrosky and Olander2012) for details). Other options which may be more appropriate for turbulent airflow include those of Trifonov (Reference Trifonov2010), Tseluiko & Kalliadasis (Reference Tseluiko and Kalliadasis2011) and Camassa et al. (Reference Camassa, Ogrosky and Olander2017); incorporating these closures into this model with slip is left for future work.
In this ‘locally Poiseuille’ approach, the free-surface variations are assumed to be slowly varying in the axial direction, consistent with the long-wave derivation used above. The core flow is modelled with the simple laminar profile of Poiseuille flow through a pipe, with the free surface, slowly varying in  $z$, serving as the air's ‘tube wall’ here. A brief derivation is now given. The air is assumed to flow at a constant volume flux
  $\bar {Q}^{(g)}$:
 \begin{equation} \bar{Q}^{(g)}=\int_0^{\bar{R}} 2{\rm \pi} \bar{r}\bar{w}^{(g)}\,{\rm d}\bar{r}.\end{equation}
The velocity profile  $\bar {w}^{(g)}(\bar {r})$ for
  $0<\bar {r}<\bar {R}(\bar {z},\bar {t})$ is estimated by a slowly varying Poiseuille flow profile with zero velocity at the free surface
  $\bar {r}=\bar {R}(\bar {z},\bar {t})$:
 \begin{equation} \bar{w}^{(g)}=\frac{\bar{p}_{\bar{z}}^{(g)}}{4\bar{\mu}^{(g)}}(\bar{r}^2-\bar{R}^2).\end{equation}
Substituting (2.18) into (2.17), integrating and solving for  $\bar {p}_{\bar {z}}^{(g)}$ gives an estimate of the gas pressure gradient:
 \begin{equation} \bar{p}_{\bar{z}}^{(g)}={-}\frac{8\bar{\mu}^{(g)}\bar{Q}^{(g)}}{{\rm \pi} \bar{R}^4}. \end{equation}
Similarly, the tangential stress applied by the core flow on the free surface may be estimated by evaluating  $\bar {\mu }^{(g)}\bar {w}_{\bar {r}}$ at the free surface
  $\bar {r}=\bar {R}(\bar {z},\bar {t})$:
 \begin{equation} \bar{\tau}^{(g)}=\frac{4\bar{Q}^{(g)}}{{\rm \pi}\bar{R}^3}.\end{equation}
In dimensionless form, and after substituting (2.19) and (2.20) into (2.14a) and (2.14b), respectively, we get the estimates needed to close the model:
 \begin{equation} p_z={-}\frac{4}{mR^4}+\frac{\varepsilon}{\mathrm{C}R^2}(R_z+\varepsilon^2 R^2R_{zzz}) \quad \text{and} \quad \tau^g ={-}\frac{2}{mR^3}, \end{equation}
where  $m=\bar {\mu }/\bar {\mu }^{(g)}$. Plugging these stresses into the velocity results in the final model equation:
 \begin{equation} {R_t+[S_1\,f_1(R,a)+S_2\,f_2(R,a)]R_z+\frac{S_3}{R}[f_3(R,a)(R_z+R^2R_{zzz})]_z}=0,\end{equation}
where
 \begin{equation} S_1=\frac{1}{m}, \quad S_2=\frac{Re}{2Fr^2}, \quad S_3=\frac{1}{16{C}}, \end{equation}
and where
 \begin{gather} {f_1(R,a)}=\frac{a^2}{R^4}\left[\frac{a^2}{R^2}-1+2\tilde{\varLambda}\left(\frac{2a^2}{R^2}-1\right)\right], \end{gather}
 \begin{gather}{f_2(R;a)}=R^2-a^2+2R^2\ln\left(\frac{a}{R}\right)-2\tilde{\varLambda}(a^2-R^2), \end{gather}
 \begin{gather}{f_3(R,a)}=\frac{a^4}{R^2}+3R^2-4a^2+4R^2\ln\left(\frac{a}{R}\right)+\frac{4\tilde{\varLambda}}{R^2}(a^2-R^2)^2. \end{gather}
 The notation adopted here is similar to that used by Camassa et al. (Reference Camassa, Forest, Lee, Ogrosky and Olander2012) to provide ease of comparison. The  $S_1$ term represents the effects of core flow acting through the free-surface stresses, while the
  $S_2$ term contains the effect of gravity acting on the film. The
  $S_3$ terms contain the effects of surface tension acting at the free surface. Equation (2.22), a conservation law for
  $R^2$, conserves fluid volume. As in Camassa et al. (Reference Camassa, Forest, Lee, Ogrosky and Olander2012), here
  $z$ and
  $t$ are rescaled by
  $\epsilon$ in order to return to the original aspect ratio. As a result,
  $\epsilon$ is scaled out of (2.22), but the validity of the derivation still relies on the assumption
  $\epsilon \ll 1$.
If  $S_1=0$, the model is identical to the one derived by Liu & Ding (Reference Liu and Ding2017) for film flow over a porous wall. In the no-slip limit, i.e.
  $\tilde {\varLambda }=0$, the model of Camassa et al. (Reference Camassa, Forest, Lee, Ogrosky and Olander2012) is recovered; furthermore, if
  $\tilde {\varLambda }=0$ and
  $S_1=0$ the no-slip falling-film model of Camassa et al. (Reference Camassa, Ogrosky and Olander2014) is recovered. (There is a slight difference in the definition of
  $S_2$ here and in Camassa et al. (Reference Camassa, Ogrosky and Olander2014) due to having neglected the density of the core fluid – taken here to be air – in the current derivation.) Note that for a falling film, time may be rescaled by
  $S_2$ and the dynamics is governed by the single parameter ratio
  $S_3/S_2$. Finally, if
  $\tilde {\varLambda }=0$,
  $S_2=0$ and
  $S_1\ne 0$, the no-slip model of Camassa & Ogrosky (Reference Camassa and Ogrosky2015) is recovered; in this case, time may be rescaled by
  $S_1$ with the dynamics governed by
  $S_3/S_1$.
We note that for the falling-film case with passive core ( $S_1=0, S_2>0$) it would be appropriate to derive the model equation using a different velocity scale (e.g. the Nusselt velocity
  $\bar {W}_N=\bar {\rho } \bar {g} \bar {h}_0^2/\bar {\mu }$) from the core flow scale of (2.8), as done in Camassa et al. (Reference Camassa, Ogrosky and Olander2014) and Liu & Ding (Reference Liu and Ding2017) for the no-slip and slip cases, respectively. As the resulting model equation, however, is identical in form to those of (2.22), a separate derivation is omitted here.
2.3. Thin-film limit
If the film thickness is assumed to be small relative to the tube radius, the model may be simplified. Defining a rescaled film thickness
 \begin{equation} \eta=\frac{a-R}{a-1}, \end{equation}
so that  $\eta =0$ at the wall and
  $\eta =1$ at the undisturbed free surface
  $r=R_0$, substituting
  $R=a-\beta \eta$, where
  $\beta =a-1$, into (2.22) and expanding about
  $\beta =0$ results in
 \begin{align} &\eta_t+2\beta S_1\left[(\eta+\varLambda^*)+\beta\left(\frac{11}{2}\eta^2+8\varLambda^*\right)\right]\eta_z-2\beta^2S_2(\eta^2+2\varLambda^*\eta)\eta_z \nonumber\\ &\quad +\frac{16\beta^3S_3}{3}[(\eta^3+3\varLambda^*\eta^2)(\eta_z+\eta_{zzz})]_z=0. \end{align}
Here  $\varLambda ^*=\varLambda /\beta$ is a rescaled slip length, and terms up to
  $O(\beta ^2)$ have been retained in both the
  $S_1$ and
  $S_2$ terms, while terms of
  $O(\beta ^3)$ have been retained in the
  $S_3$ terms. Several models previously reported in the literature can be recovered in various limits. In the no-slip limit with
  $\varLambda ^*=0$, the thin-film model of Camassa & Ogrosky (Reference Camassa and Ogrosky2015) is recovered; if, in addition,
  $S_1=0$, the model of Frenkel (Reference Frenkel1992) is recovered while if
  $S_2=0$, the model of Kerchman (Reference Kerchman1995) is recovered. In the absence of any base flow, i.e.
  $S_1=S_2=0$ and
  $\tilde {\varLambda }=0$, then the model of Hammond (Reference Hammond1983) is recovered. In the case of slip where
  $\varLambda ^*>0$, if
  $S_1=0$, the model reduces to that derived by Halpern & Wei (Reference Halpern and Wei2017) for flow down a fibre.
Note that the  $S_1$ term appears at
  $O(\beta )$ while the
  $S_2$ term appears at
  $O(\beta ^2)$. We also note that (2.26) is a conservation law for film thickness
  $h$ while (2.22) is a conservation law for fluid volume. Note that in the thin-film limit
  $h/a\rightarrow 0$, conserving
  $h$ and conserving
  $R^2$ are identical; for moderately thick films, however, approximating fluid volume conservation can lead to distinct behaviour in model solutions (e.g. Camassa & Ogrosky Reference Camassa and Ogrosky2015).
2.4. Parameter values
Before finding model solutions, we briefly discuss parameter values that are relevant for experiments from the literature. First, it should be emphasized that terms of  $O(\epsilon Re)$ have been assumed small in the derivation here. This model is thus only applicable in situations where the Plateau–Rayleigh instability may be expected to dominate the Kapitza instability. For higher-Reynolds-number flows, one might opt to retain the inertial terms in the derivation, or use an integral boundary layer modelling approach, which has been shown to have success matching experiments with moderate to high liquid Reynolds number.
Second, relevant values of slip length parameter  $\varLambda$ are discussed. For liquid flows over rough surfaces without any superhydrophobic properties, slip lengths are typically of the order of hundreds of nanometres. These slip lengths may be larger for flows involving polymeric liquids like silicone oil; such liquids have been shown to produce an apparent wall slip length of
  $1\unicode{x2013}10\ \mathrm {\mu }{\rm m}$ (Brochard-Wyart et al. Reference Brochard-Wyart, de Gennes, Hervert and Redon1994). Thus, for example, for films inside tubes with mean free surface
  $\bar {R}_0$ of the order of 1 mm (
 $10\ \mathrm {\mu }{\rm m}$), one may have
  $\varLambda \approx 0.001$ (0.1). Slip lengths within this range may be expected in some of the falling-film experiments conducted by Camassa et al. (Reference Camassa, Ogrosky and Olander2014) using silicone oil inside tubes of radius
  $\bar {a}=0.5$, 0.295 and 0.17 cm; the smallest tube had films with mean free surface
  $\bar {R}_0 = 0.5$–1.2 mm, resulting in
  $\varLambda$ taking on values as large as 0.01. The experiments of Camassa et al. (Reference Camassa, Forest, Lee, Ogrosky and Olander2012) consider a silicone oil film driven up a tube by airflow with
  $\bar {R}_0\approx 0.4$ cm, resulting in
  $\varLambda$ taking on values of the order of 0.001. For flow over hydrophobic surfaces or over a porous medium, larger values of slip length may be appropriate, as discussed in related studies; for example, Liu & Ding (Reference Liu and Ding2017) consider a falling film with dimensionless slip lengths that, in the scaling used here, correspond to
  $\varLambda \approx 0.1$. For film flows outside of a tube, Halpern & Wei (Reference Halpern and Wei2017) have shown that inclusion of slip in a falling-film model can account for discrepancies between no-slip models and the experiments of Quéré (Reference Quéré1990) on falling films and droplets along fibres; in these experiments, the film thickness was as small as
  $20\ \mathrm {\mu }{\rm m}$. With these applications in mind, we present results for values of
  $\tilde {\varLambda }$ primarily covering a range of values from a few thousandths to a tenth. In a few instances results are also presented for larger values of
  $\tilde {\varLambda }$ in order to explore the mathematics of the model at larger slip lengths.
Third, the values of  $S_1$,
  $S_2$ and
  $S_3$ used here were chosen to be compatible with previous experiments. In the falling-film experiments of Camassa et al. (Reference Camassa, Ogrosky and Olander2014), the silicone oil used had viscosity
  $\bar {\mu }=129$ P, density
  $\rho =0.97\ {\rm g}\ {\rm cm}^{-3}$ and surface tension
  $\gamma =21.5\ {\rm dyn}\ {\rm cm}^{-1}$, corresponding to a Kapitza number
  $Ka=3.3\times 10^{-3}$. For experiments with
  $\bar {a}=0.295$ cm, this results in the ratio
  $S_3/S_2$ taking on values in the range 0.05–0.8; for
  $\bar {a}=0.17$ cm, the ratio
  $S_3/S_2$ takes on values in the range 0.2–1.1. Results are presented below for
  $S_3/S_2=0.35$ which fall within both of these ranges. The value of
  $a$ in these smaller-radius experiments took on a wide range of values, from 1.28 to 6. In the air-driven experiments of Camassa et al. (Reference Camassa, Forest, Lee, Ogrosky and Olander2012), which used silicone oil with the same density, viscosity and surface tension as those of Camassa et al. (Reference Camassa, Ogrosky and Olander2014),
  $\bar {a}=0.5$ cm, the volume flux of air
  $Q^{(g)}$ ranged from 330 to
  $1170\ {\rm cm}^3\ {\rm s}^{-1}$ and
  $\bar {R}_0$ took on values from 0.35 to 0.45 cm. The value of
  $a=\bar {a}/\bar {R}_0$ ranged from 1.1 to 1.45. The ratio
  $S_2/S_1$ used in the no-slip model to compare with these experiments covered a range of values from 1 to near 100, with this range partly dependent on whether a modified effective viscosity is used as a model for the effects of airflow turbulence; while admittedly crude, this approach was shown to qualitatively capture features of the experiments. The ratio
  $S_3/S_1$, which may be expected to govern the dynamics for strong airflow, took on values of 0.01–1.
Here, results are presented with  $S_2/S_1=8$ which with
  $a=2$ corresponds to
  $Re^{(g)}=3700$ and
  $Re^{(l)}=\bar {\rho }\bar {W}_N\bar {R}_0/\bar {\mu }=8.7\times 10^{-4}$. These values could be realized, for example, in the experiments of Camassa et al. (Reference Camassa, Forest, Lee, Ogrosky and Olander2012) with tube radius
  $\bar {a}=0.5$ cm, air volume flux
  $\bar {Q}^{(g)}=670\ {\rm cm}^3\ {\rm s}^{-1}$, an effective viscosity
  $\bar {\mu }^{(g)}=5.4\times 10^{-4}\ {\rm g}\ {\rm cm}^{-3}$ and mean free-surface radius
  $\bar {R}_0=0.25$ cm, resulting in
  $S_3/S_1=0.36$. For falling films, results are presented with
  $S_3/S_2=0.35$, which with
  $a=1.9$ corresponds to
  $Re^{(l)}=2.8\times 10^{-5}$. These values correspond to the smallest-tube-radius experiments of Camassa et al. (Reference Camassa, Ogrosky and Olander2014) with
  $\bar {a}=0.17$ cm and
  $\bar {R}_0=0.09$ cm.
3. Linear stability analysis
Before a detailed linear stability analysis, we emphasize the impact of slip on the liquid volume flux. For a film with constant free surface  $R=1$, the dimensionless volume flux
  $Q_0$ of the film is
 \begin{align} Q_0&=2{\rm \pi}\int_1^ar\,w_0(r)\,{\rm d}r\nonumber\\ &=\frac{{\rm \pi} S_1}{2}[(a^2-1)^2+4\tilde{\varLambda}(a^4-a^2)]-\frac{{\rm \pi} S_2}{4}[a^4+3-4a^2+4\ln a+4\tilde{\varLambda}(a^2-1)^2], \end{align}
where
 \begin{equation} w_0(r)=S_1(a^2-r^2+2\tilde{\varLambda}a^2)-\frac{S_2}{2}(a^2-r^2+2\ln\frac{r}{a}+2\tilde{\varLambda}(a^2-1)) \end{equation}
is the velocity profile in dimensionless form. If  $S_1=0$ and
  $S_2>0$, then
  $Q_0<0$ for all values of
  $a$ and
  $\tilde {\varLambda }=0$; similarly, if
  $S_1>0$ and
  $S_2=0$, then
  $Q_0>0$. In both cases, increasing
  $\tilde {\varLambda }$ increases
  $|Q_0|$.
Figure 2(a) shows  $Q_0$ for a variety of
  $a$ and
  $\tilde {\varLambda }$ values in the case where both
  $S_1$ and
  $S_2$ are positive. If the film is thin enough, the liquid volume flux is positive, indicating net movement up the tube; if the film is thicker, the net movement is down the tube.

Figure 2. (a) Liquid volume flux  $Q_0$ for constant free surface
  $R=1$ for various
  $a$ and
  $\tilde {\varLambda }$ and with
  $S_2/S_1=8$. The flux has been rescaled by
  $S_1$. (b) Velocity profile
  $w_0(r)$ corresponding to star symbols at
  $a=1.1$ in (a). Velocity has been rescaled by
  $S_1$. (c) Same as (b), but corresponding to the triangle symbol in (a) at
  $a=a^*$. (d) Same as (b), but corresponding to star symbols at
  $a=1.2$ in (a).
There is a value of  $a$ for which the flux and base velocity profile are independent of
  $\tilde {\varLambda }$, namely
 \begin{equation} a^*=\sqrt{S_2/(S_2-2S_1)}. \end{equation}
With  $S_2/S_1=8$ as in figure 2(a),
  $a^*\approx 1.15$. This
  $a^*$ value is also the value of
  $a$ for which
  ${{\rm d}w_0}/{{\rm d}r}|_{r=a}=0$, as seen in figure 2(c). For
  $a< a^*$,
  ${{\rm d}w_0}/{{\rm d}r}|_{r=a}<0$ as in figure 2(b), and for
  $a>a^*$,
  ${{\rm d}w_0}/{{\rm d}r}|_{r=a}>0$ as in figure 2(d). If the airflow is strong enough so that
  $S_2/S_1<2$, no such
  $a^*$ value exists, and
 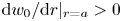 ${{\rm d}w_0}/{{\rm d}r}|_{r=a}>0$ for all
  $a$.
$a$.
Figure 2(a) shows that for  $a>a^*$ but not too large, as
  $\tilde {\varLambda }$ increases the flux changes sign from positive to negative. This occurs whenever the slip length increases past the value
 \begin{equation} \tilde{\varLambda}=\frac{2S_1(a^2-1)^2-S_2(a^4-4a^2+3+4\ln a)}{-8S_1(a^4-a^2)+4S_2(a^2-1)^2}. \end{equation}
For  $S_2/S_1=8$ and
  $a=1.2$, corresponding to the stars in figure 2(a),
  $Q_0=0$ for
  $\tilde {\varLambda }\approx 0.039$.
We note that while the net transport may be in one direction, the film's velocity profile  $w_0$ may change sign in the fluid layer. Figure 2(b) shows
  $w_0(r)$ for the solutions in figure 2(a) with
  $a=1.2$. For each of the profiles there is some portion of the film close to the wall that is moving down the tube and some portion along the free surface moving up the tube. For values of slip length
 \begin{equation} \tilde{\varLambda}>\frac{(2S_1-S_2)(a^2-1)+2S_2\ln a}{-4S_1a^2+2S_2(a^2-1)} \end{equation}
the velocity profile  $w_0(r)<0$ for all
  $r$. For
  $S_2/S_1=8$ and
  $a=1.2$ as in figure 2(b), this occurs when
  $\tilde {\varLambda }\gtrapprox 0.217$.
Next, we proceed to temporal linear stability analysis of (2.22). In the case of no slip, i.e.  $\tilde {\varLambda }=0$, it has been shown that the free surface modelled in (2.22) is unstable to long-wave disturbances (Camassa & Ogrosky Reference Camassa and Ogrosky2015). The speed of disturbances is governed by the competition between the
  $S_1$ and
  $S_2$ terms, with the
  $S_1$ terms representing the impact of airflow moving disturbances up the tube and the
  $S_2$ terms incorporating the impact of gravity on disturbances. It is worth noting that positive
  $S_2$ values show that gravity acts counter to the gas shear stress. The growth rate is positive for small wavenumbers and is set by the
  $S_3$ terms, which contain both stabilizing and destabilizing effects of surface tension due to the axial and azimuthal curvature of the free surface, respectively. Next, the effect of slip on the stability of the free surface is examined.
Consider a small perturbation to an otherwise undisturbed free surface:
 \begin{equation} R=1+A\exp({{\rm i}(kz-\omega t)}),\end{equation}
where  $k$ is the (real) wavenumber,
  $\omega$ is the frequency and
  $A\ll 1$ is the amplitude of the disturbance. Substituting (3.6) into (2.22), ignoring the higher-order terms in
  $A$ and solving for
  $\omega$ gives
 \begin{align}
\omega&=[S_1(a^4-a^2+2a^2\tilde{\varLambda}
(2a^2-1))+S_2(1-a^2+2\ln(a)-2\tilde{\varLambda}(a^2-1))]k\nonumber\\
&\quad +[{\rm
i}S_3(a^4+3-4a^2+4\ln(a)+4\tilde{\varLambda}(a^2-1)^2)](k^2-k^4).
\end{align}
\begin{align}
\omega&=[S_1(a^4-a^2+2a^2\tilde{\varLambda}
(2a^2-1))+S_2(1-a^2+2\ln(a)-2\tilde{\varLambda}(a^2-1))]k\nonumber\\
&\quad +[{\rm
i}S_3(a^4+3-4a^2+4\ln(a)+4\tilde{\varLambda}(a^2-1)^2)](k^2-k^4).
\end{align}
The dispersion relation,  $\omega$, is a complex number with the linear wave speed being given by the real part of
  $\omega$ divided by the wavenumber (Re(
 $\omega )/k$) and the growth rate of the waves given by Im(
 $\omega$).
What impact does slip have on the speed of free-surface disturbances? In the case where  $S_1>0$ and
  $S_2=0$, disturbances will move up the tube due to pressure-driven airflow. Figure 3(a) shows that as
  $\tilde {\varLambda }$ increases, the wave speed increases, moving up the tube faster. Similarly, in the case where
  $S_1=0$ and
  $S_2>0$, waves fall down the tube, with speed increasing as
  $\tilde {\varLambda }$ increases, as shown by Liu & Ding (Reference Liu and Ding2017). In both cases, the phase speed increases with film thickness parameter
  $a$.
$a$.

Figure 3. Phase speed from (3.7) for a variety of  $a$ and
  $\tilde {\varLambda }$ values. Air-driven flow with (a)
  $S_2/S_1=0$ and (b)
  $S_2/S_1=8$.
Figure 3(b) shows the phase speed for  $S_2/S_1=8$. In this case with both
  $S_1$ and
  $S_2$ fixed and non-zero, the direction of wave propagation depends on film thickness parameter
  $a$. For thin films with
  $a$ close to 1, waves move up the tube, consistent with the
  $S_1$ terms appearing at
  $O(\beta )$ while the
  $S_2$ terms appear at
  $O(\beta ^2)$ in (2.26). For thick films with much larger values of
  $a$, waves also move up the tube. This is consistent with the assumed constant volume flux of air in the model derivation and the resulting
  $1/R^3$ scaling of the free-surface tangential stress. Between these extremes, an intermediate range of film thicknesses exists where waves may propagate down the tube. This interval of
  $a$ values depends on the value of
  $\tilde {\varLambda }$, though it is interesting to note that there are two values of
  $a$ in figure 3(b) for which the phase speed is independent of
  $\tilde {\varLambda }$; these may be found analytically by finding the roots of
 \begin{equation} 2S_1a_*^4-(S_1+S_2)a_*^2+S_2=0. \end{equation}
In figure 3(b) with  $S_2/S_1=8$ these are
  $a_*\approx 1.10$ and
  $a_*\approx 1.81$. We note that if
  $S_2/S_1<3+2\sqrt {2}$, then there are no such values of
  $a_*$ for which phase speed is independent of
  $\tilde {\varLambda }$. Also in figure 3(b), it is apparent that for
  $\tilde {\varLambda }=0$, the phase speed initially increases as
  $a$ increases from 1 before reaching a local maximum; for larger
  $\tilde {\varLambda }$, the phase speed initially decreases. It may be shown that the initial increase in phase speed occurs for all
  $\tilde {\varLambda }< S_1/(2S_2-6S_1)$ so long as
  $S_2/S_1>3$.
Figure 4 shows the dependence of  $a^*$ (base flow velocity and flux independent of
  $\tilde {\varLambda }$) and
  $a_*$ (phase speed independent of
  $\tilde {\varLambda }$) on
  $S_2/S_1$. Note that the values of
  $a^*$ and
  $a_*$ are in general not identical. This means that for fixed
  $S_2/S_1$, there is a value of
  $a$, namely
  $a^*$, for which the base flow velocity profile is independent of slip length, but the speed of infinitesimal free-surface disturbances is not. It seems noteworthy that a parameter that only appears in the boundary condition at the wall can have no impact on the film flow profile throughout the fluid layer but be felt at the opposite boundary. It appears that the same phenomenon is present in the thin-film model of Hossain & Behera (Reference Hossain and Behera2022) for film flow along a slippery inclined plane with shear stress applied at the free surface, though the primary focus there was on whether the film was unstable.


Next, how does slip at the wall impact the growth rate of disturbances? Figure 5 shows the linear growth rates for a variety of slip length and film thickness values (i.e. various  $\tilde {\varLambda }$ and
  $a$ values). For all parameter values, the free surface is unstable to long-wave disturbances with wavenumbers bounded above by cut-off wavenumber
  $k=1$, as in the no-slip case. Here
  $k=1$ corresponds to the cut-off wavenumber of the Plateau–Rayleigh instability. The wavenumber of maximum growth rate is also the same as the no-slip case,
  $k_{max}={1}/{\sqrt {2}}$. The growth rates increase with both
  $\tilde {\varLambda }$ and film thickness parameter
  $a$.
$a$.

Figure 5. The growth rates for different values of  $\tilde {\varLambda }$ are shown for (a)
  $a=1.1$, (b)
  $a=1.307$ and (c)
  $a=2.0$.
4. Nonlinear solutions
What impact does slip have on the saturation of the instability growth explored in the previous section? To understand this, numerical solutions to (2.22) will be found, and families of travelling wave solutions will also be studied.
4.1. Transient solutions
Equation (2.22) may be solved approximately using the method of lines; a brief outline is given here, with more details available elsewhere (e.g. Camassa et al. Reference Camassa, Ogrosky and Olander2014). Periodic boundary conditions in  $z$ were used. The initial condition consisted of a constant free surface
  $R_0$ perturbed by one or more small-amplitude Fourier modes. A variety of wavenumbers, amplitudes and phase shifts were used. For the most part, the results were independent of initial conditions used; one exception is that there is a range of unperturbed film thickness for which the occurrence and timing of plug formation may depend on the initial conditions. This dependence, however, only occurs over a small range and further exploration of this sensitivity is left for future work.
The algorithm used is pseudospectral with spatial derivatives being calculated in Fourier space while nonlinear terms are calculated in physical space. To integrate with respect to time, a second-order predictor–corrector scheme is used. The strongly nonlinear terms required that the Fourier coefficients be dealiased after every time step. The total volume of fluid was monitored during the simulation; if this value varied more than some small specified tolerance, the simulation was rerun with smaller  $\Delta z$ and
  $\Delta t$. These numerical solutions were verified by comparing instability growth and propagation early in simulations with the linear stability analysis results and with no-slip results from earlier studies.
The case of passive core flow ( $S_1=0$) is considered first. Figure 6 shows successive snapshots of the free surface taken at regularly spaced time intervals from numerical solutions to (2.22). In order to track the wave crests properly, each snapshot has been aligned by shifting it in
  $z$ by an amount corresponding to the phase speed found in § 3 (or approximately the phase speed, due to the discretization used when numerically finding solutions). It is worth noting that gravity is acting from right to left in these plots; hence, the waves are moving in the negative
  $z$ direction. In each of the simulations shown,
  $S_1=0$,
  $S_3/S_2=0.35$ and
  $a=1.27$ (here
  $S_2=1.607$,
  $S_3=0.568$, though the specific values do not affect the dynamical outcomes, only the time scale of the evolution). In the absence of pressure-driven airflow, the film flows down the tube. During the early stages, waves grow in amplitude with the expected growth rate; at later stages, one of two things happen. For small values of
  $\tilde {\varLambda }$, the nonlinearities in the model cause the saturation of wave growth, resulting in wave trains propagating down the tube; these waves interact with one another, but maintain a mostly steady shape.

Figure 6. (a–c) Time snapshots showing the evolution of the free surface for (2.22) in a periodic domain with  $S_1=0$,
  $S_3/S_2=0.35$ and
  $a=1.25$: (a)
  $\tilde {\varLambda }=0$, (b)
  $\tilde {\varLambda }=0.015$ and (c)
  $\tilde {\varLambda }=0.07$. The free-surface profiles are shown for equal time intervals. Profiles are shown in a frame of reference moving with the phase speed according to (3.7). (d–f) Time snapshots at the end of the simulations shown in (a–c), respectively; snapshots are shown inside a tube. For (f), snapshot shown occurs just after the final snapshot in (c). (g) Plots of
  $\max _zh(z,t)$ and
  $\min _zh(z,t)$ for simulations in (a–c). Waves flowing down the tube due to gravity are moving in the negative
  $z$ direction.
For larger values of  $\tilde {\varLambda }$, the fastest-growing wave may undergo accelerated growth, with the wave crest appearing to approach the centre of the tube in finite time. This
  $R\rightarrow 0$ behaviour is an indication of plug formation and may be taken as a model prediction that plugs will form. This same behaviour can also occur due to the merger of two free-surface waves as occurs in figure 6(c) near the right of the final snapshot shown. In order to see the amplitude of these waves during the late-time stages of each simulation more clearly, figures 6(d)–6(f) show the free surface in the tube geometry at the final time of each simulation shown in figures 6(a)–6(c), respectively. In order to show the free surface as close to plug formation as possible, the free surface shown in figure 6(f) corresponds to the simulation shown in figure 6(c) but at
  $t=370.74$, which is just past the final time shown in figure 6(c). We note that the model solution cannot be continued all the way to
  $R=0$ due to the inverse powers and logarithms of
  $R$ in (2.22); it is also likely that the simplifying assumptions used in deriving the model (e.g. negligible inertia) may not be satisfied during the latter stages of plug formation. The maximum and minimum film thickness for each simulation is shown in figure 6(g). The accelerated growth for
  $\tilde {\varLambda }=0.07$ as
  $\min R\rightarrow 0$ in finite time is clearly seen.
There appears to be a critical value of  $\tilde {\varLambda }$ above which plug formation occurs. It is likewise the case that, for fixed
  $\tilde {\varLambda }$, there is a critical value of film thickness parameter
  $a$ above which plug formation occurs, as has been shown for the no-slip limit of (2.22) in Camassa et al. (Reference Camassa, Ogrosky and Olander2014) (similarly, for fixed
  $a$, increasing the
  $S_3/S_2$ ratio past a critical value promotes plug formation as in Ogrosky (Reference Ogrosky2021b)). Thus it appears that in the absence of pressure-driven flow, both slip and increasing film thickness promote plug formation, consistent with the findings of Liu & Ding (Reference Liu and Ding2017).
In the case of no slip, i.e.  $\tilde {\varLambda }=0$, it has been shown that the free surface in (2.22) exhibits self-similar behaviour during the pinch-off process (see e.g. Ding et al. Reference Ding, Liu, Liu and Yang2019), i.e. where
  $R(z,t)$ may be written as
  $(t_p-t)^{1/5}F(\zeta )$ with
  $\zeta =(z-z_p)/(t_p-t)^{1/5}$, where
  $z_p$ is the axial location of liquid pinch-off and
  $t_p$ is the time of pinch-off. This 1/5 scaling law matches the early stages of plug formation observed in experiments by Pahlavan et al. (Reference Pahlavan, Stone, McKinley and Juanes2019).
Does slip alter this 1/5 scaling? Following the approach of, for example, Ding et al. (Reference Ding, Liu, Liu and Yang2019), self-similar solutions to (2.22) are sought. Substituting
 \begin{equation} R(z,t)=\Delta t^{\lambda}F(\zeta),\quad \Delta t=t_p-t,\quad \zeta=\frac{z-z_p}{\Delta t^{\gamma}}, \end{equation}
with  $\lambda >0$ and
  $\gamma >0$, into (2.22) and retaining only leading-order terms in
  $\Delta t$ produces
 \begin{align} &\Delta t^{2\lambda-1}F(-\lambda F+\gamma \zeta F') \nonumber\\ &\quad +S_3a^4(1+4\tilde{\varLambda})\left[\Delta t^{-\lambda-2\gamma}\left(-\frac{2(F')^2}{F^3}+\frac{F''}{F^2}\right)+\Delta t^{\lambda-4\gamma}F^{(4)}\right]=0. \end{align}
Balancing these leading-order terms produces  $\lambda =\gamma =1/5$ as in the case with no slip; the presence of slip simply modifies the effective value of
  $S_3$.
This scaling is confirmed in the numerical solutions found. Figure 7(a) shows the later stages of plug formation as  $\min R$ approaches zero in simulations for three values of
  $\tilde {\varLambda }$; all three cases exhibit the 1/5 scaling of the no-slip case. Figure 7(b) shows the profile of the wave close to pinching off in each of the three simulations. These are overlaid on the self-similar solution profile, which was found by numerically solving (4.2).

Figure 7. (a) Plot of  $\min _zR(z,t)$ as a function of time prior to time
  $t_p$ of plug formation for
  $S_1=0$,
  $S_3/S_2=0.35$,
  $a=1.32$ and three values of
  $\tilde {\varLambda }$. (b) Solution to (4.2) (red line) with solutions to (2.22) (symbols) shown near the time and location of plug formation; solutions to (2.22) have been rescaled using (4.1a–c).
There is a second way in which model equations like (2.22) may be used to predict whether plugs will form. In Camassa et al. (Reference Camassa, Ogrosky and Olander2014) it was shown that turning points in families of travelling wave solutions serve as a reliable indicator of plug formation in model simulations and experiments in the case of no slip; this method has been further verified in other studies by Camassa et al. (Reference Camassa, Marzuola, Ogrosky and Vaughn2016), Ding et al. (Reference Ding, Liu, Liu and Yang2019) and Dietze et al. (Reference Dietze, Lavalle and Ruyer-Quil2020). This perspective is explored next for (2.22).
4.2. Travelling wave solutions
Since the solutions in figure 6 appear to consist of waves travelling with a relatively fixed profile and speed, we next look for travelling wave solutions to (2.22). These solutions will have the form
 \begin{equation} R(z,t)=Q(Z) , \end{equation}
where  $Z=z-ct$, with
  $c$ being the wave speed. Substituting (4.3) into (2.22) and integrating once, we get the third-order ordinary differential equation
 \begin{align} K&={-}c\left(\frac{Q^2}{2}\right)+S_1 \left[-\frac{a^4}{4Q^4}+\frac{a^2}{2Q^2}-\frac{\tilde{\varLambda}a^4}{Q^4}+\frac{\tilde{\varLambda}a^2}{Q^2}\right]\nonumber\\ &\quad +S_2\left[\frac{3Q^4}{8}-\frac{Q^2a^2}{2}-\frac{Q^4}{2}\ln\left(\frac{Q}{a}\right)-\tilde{\varLambda}a^2Q^2+\frac{\tilde{\varLambda}Q^4}{2}\right] \nonumber\\ &\quad +S_3\left[\left(\frac{a^4}{Q^2}+3Q^2-4a^2+4Q^2\ln\left(\frac{a}{Q}\right)+\frac{4\tilde{\varLambda}}{Q^2}(a^2-Q^2)^2\right)(Q'+Q^2Q''')\right], \end{align}
where primes denote differentiation with respect to  $Z$ and
  $K$ is a constant of integration that becomes an additional parameter in the problem.
Solutions to (4.4) may be found using numerical continuation software AUTO (Doedel et al. Reference Doedel, Champneys, Dercole, Fairgrieve, Kuznetsov, Oldeman, Paffenfroth, Sandstede, Wang and Zhang2008) in the following way. Starting with a constant solution, the film thickness  $a$ may be varied until a Hopf bifurcation is reached. The wave speed,
  $c$, is a free parameter and the constant of integration,
  $K$, is prescribed using (4.4). Using (4.4) exactly as written presents some numerical challenges, as the bifurcation is a zero-Hopf bifurcation. In order to more easily identify the bifurcation, a small amount of viscosity,
  $\beta Q''$, is added to (4.4). Once we have moved onto the family of periodic solutions from the Hopf, this viscosity parameter is taken to 0; see e.g. Camassa et al. (Reference Camassa, Marzuola, Ogrosky and Swygert2021) for more details and a justification of this numerical smoothing procedure.
Families of these periodic solutions may be traced out by varying  $\tilde {\varLambda }$ or
  $a$. Figure 8(a) shows families of travelling wave solutions for
  $S_1=0$,
  $S_2=1.607$,
  $S_3=0.598$, fixed period of
  $4{\rm \pi}$ and four different values of
  $\tilde {\varLambda }$. Each family of solutions contains a turning point in the solution family at a value
  $a_c$. For
  $a>a_c$, no travelling wave solutions were found; for
  $a< a_c$, two travelling wave solutions were found, one with higher amplitude and one with lower amplitude. The lower-amplitude solutions correspond to the waves seen in the numerical solutions to the evolution equation (2.22), while the higher-amplitude solutions do not appear in these solutions. Figure 8(b) shows the solutions at
  $a=a_c$ for the values of
  $\tilde {\varLambda }$ in figure 8(a).

Figure 8. (a) Families of travelling wave solutions for  $S_1=0$,
  $S_3/S_2=0.35$, period
  $L=4{\rm \pi}$ and four values of
  $\tilde {\varLambda }$. Dashed lines indicate critical film thickness parameter value
  $a_c$. Pluses (circles) denote
  $\min _zR(z,t)$ in solution to (2.22) with
  $L=4{\rm \pi}$ (
 $L=12{\rm \pi}$); see text for details. Shading denotes
  $a$ values that lie between the critical thickness found for
  $L=4{\rm \pi}$ and
  $L=12{\rm \pi}$. (b) Travelling wave profiles corresponding to the critical film thickness
  $a_c$ and slip combinations in (a). (c) Evolution of
  $\min _zh(z,t)$ and
  $\max _zh(z,t)$ for simulations corresponding to black pluses and circles in (a). The value of
  $a$ used during each time interval of the simulation is listed near the top of the plot; see text for details.
It is important to note that the value of  $a_c$ does depend on the period size specified when finding travelling wave solutions. We briefly justify the selection of
  $4{\rm \pi}$ used here. One reasonable choice for the period size would be to use the most unstable wavelength,
  $2\sqrt {2}{\rm \pi}$. However, once the wave growth in solutions to (2.22) has saturated, the typical distance from one wave crest to another is larger than this value. For example, in figure 6(a–c), the simulations show 6–7 wave crests within a
  $24{\rm \pi}$ domain. The period
  $4{\rm \pi}$ was used as an approximate average wavelength for these saturated waves. Other methods could be used, including the approach used by Dietze et al. (Reference Dietze, Lavalle and Ruyer-Quil2020); see also Camassa et al. (Reference Camassa, Marzuola, Ogrosky and Vaughn2016) for discussion of the impact of period size on critical thickness
  $a_c$ without slip.
These  $a_c$ values may be taken as an approximate value for the critical film thickness past which plugs may be expected to form. Increasing
  $\tilde {\varLambda }$ results in decreasing
  $a_c$, consistent with numerical solutions showing that increasing
  $\tilde {\varLambda }$ promotes plug formation. The travelling wave solutions at the critical film thickness value
  $a_c$ are shown for each of the four families in figure 8(b).
How well does  $a_c$ approximate the critical thickness required for plug formation to occur in solutions to the evolution equation (2.22), and how much do domain length and initial conditions affect this agreement? To answer this, additional simulations of (2.22) were conducted for each value of
  $\tilde {\varLambda }$ shown in figure 8(a). In these simulations, the value of
  $a$ was initially set to be lower than the critical value
  $a_c$ to ensure no plugs would form. Once the free-surface instability growth had saturated as a series of travelling waves, the value of
  $a$ was increased by 0.005, and the simulation was continued for an additional 1200 time units. After each subsequent 1200 time units, the value of
  $a$ was further increased by 0.005, with the simulation being allowed to run until
  $\min R$ began to approach zero, indicating plug formation. For each value of
  $\tilde {\varLambda }$, this test was first conducted with a small domain of length
  $4{\rm \pi}$, chosen to match the period of the travelling wave solutions found in figure 8(a). The test was conducted a second time with larger domain (
 $12{\rm \pi}$) in order to briefly explore the impact of domain length on plug formation. See figure 8(c) for the evolution of
  $\max _zh(z,t)$ and
  $\min _zh(z,t)$ for both tests with
  $\tilde {\varLambda }=0$. For each value of
  $\tilde {\varLambda }$, the smaller domain produces plugs at a value of
  $a$ that matches the travelling wave turnaround point quite well, while the larger domain produces plugs at a smaller value of
  $a$ than the
  $a_c$ identified by travelling wave solutions. This is due to the formation of plugs occurring from the interactions and mergers of multiple waves in these longer domain simulations. The shaded areas of figure 8(a) represent the difference between values of
  $a$ for which plugs formed in the small- and large-domain tests; the width of the shaded areas is slightly larger for higher values of
  $\tilde {\varLambda }$, suggesting an increased sensitivity to domain length for higher slip.
As mentioned above, the final state of the solution (plugs or no plugs) can be sensitive to the initial conditions. This sensitivity is seen only in simulations with large domain and thickness near but less than  $a_c$ so that plugs may form due to wave mergers. Figure 9 provides an example of this dependence of plug formation on initial conditions. Two model solutions were found using
  $a=1.25$,
  $S_1=0$,
  $S_3/S_2=0.35$ and
  $\tilde {\varLambda }$ in a domain of length
  $L=24{\rm \pi}$. Each initial condition consisted of the constant free-surface
  $R=1$ perturbed by 20 modes with amplitude and phase shift chosen randomly; the initial conditions are shown in figure 9(a), and the evolution of
  $\max h$ and
  $\min h$ is shown in figure 9(b). Solution 1 displays no plug formation during the first 8000 time units, while solution 2 displays plug formation prior to
  $S_2t=2000$. It is of course possible that solution 1 will eventually produce a wave merger that results in a plug, though none was seen in the simulation run here, and the relevance for experiments conducted with tubes of reasonable length seems minimal.

Figure 9. (a) Initial conditions used in two solutions to (2.22) using  $a=1.25$,
  $S_1=0$,
  $S_3/S_2=0.35$,
  $\tilde {\varLambda }=0.02$ and domain length
  $L=24{\rm \pi}$. (b) Evolution of
  $\min _z h(z,t)$ (dashed line) and
  $\max _z h(z,t)$ (solid line) for solutions from (a).
Before proceeding, a brief discussion of the stability of these travelling waves is given. For the no-slip case, the travelling wave solutions with higher amplitude, lying on the solution branch with  $\min R$ smaller than that at
  $a_c$, were shown to be unstable (Camassa et al. Reference Camassa, Marzuola, Ogrosky and Vaughn2016); the stability of these waves in the presence of slip is briefly explored next. When a travelling wave solution, plus a small perturbation, is used as an initial condition in the solver for (2.22), one of two things occurs. As the wave travels, either the amplitude grows and
  $\min R$ approaches 0, or the amplitude decreases and the wave profile approaches that of the lower-amplitude travelling wave solution with the same parameter values. Figure 10 shows the second case; the evolution of a higher-amplitude travelling wave solution with noise for
  $S_1=0$,
  $S_3/S_2=0.35$,
  $a=1.21$ and
  $\tilde {\varLambda }=0.13$ is shown in figure 10(a) with solutions shifted so that the wave crest is always in the centre of the domain. The evolution of
  $\max _z h(z,t)$ is shown in figure 10(b). This second case has also been observed in the no-slip case (Camassa et al. Reference Camassa, Marzuola, Ogrosky and Vaughn2016). These simulations suggest that in both cases, these higher-amplitude waves are unstable. The stability of the smaller-amplitude waves with no slip was discussed in Camassa et al. (Reference Camassa, Marzuola, Ogrosky and Swygert2021); our simulations here suggest those findings appear unchanged by slip.

Figure 10. (a) Snapshots from the evolution of a high-amplitude travelling wave solution with  $S_1=0$,
  $S_3/S_2=0.35$,
  $a=1.21$ and
  $\tilde {\varLambda }=0.13$. Waves have been shifted so that the wave crest is in the centre of the domain. (b) Plot of
  $\max _zh(z,t)$ for solution shown in (a); crosses correspond to snapshots shown in (a); dashed lines show
  $\max _zh(z)$ for the two travelling wave solutions identified for these parameter values.
The dependence of  $a_c$ on slip,
  $a_c(\tilde {\varLambda })$, is shown in figure 11. For small slip, the critical thickness value
  $a_c$ decreases rapidly as
  $\tilde {\varLambda }$ increases. For large values of
  $\tilde {\varLambda }$, this critical thickness
  $a_c$ decreases very slowly. For example, for the parameter values used in figure 11, when
  $\tilde {\varLambda }=200$,
  $a_c\approx 1.16$. It is not unreasonable to conjecture that the value of
  $a_c$ approaches some minimum value above 1 as
  $\tilde {\varLambda }\rightarrow \infty$. This could suggest that there is some small film thickness for which plugs are not expected to form regardless of slip; exploring this further analytically is, however, a challenging task as one cannot obtain an explicit formula for
  $a_c$ in terms of
  $\tilde {\varLambda }$.

Figure 11. Critical film thickness parameter  $a_c$ as a function of
  $\tilde {\varLambda }$ for
  $S_1=0$,
  $S_2=1.607$,
  $S_3=0.568$ and period
  $4{\rm \pi}$. The solid line represents the tangent line approximation from (4.6) which can be used to predict the critical
  $a$ value for small
  $\tilde {\varLambda }$. The coloured triangles correspond to the travelling waves in figure 8(b) with the same colour.
A functional form of  $a_c(\tilde {\varLambda })$ valid for small
  $\tilde {\varLambda }$ may be found analytically by exploiting the apparent weak dependence of the profiles in figure 8(b) on
  $\tilde {\varLambda }$ as follows. Setting
  $S_1=0$, holding
  $S_2$ and
  $S_3$ constant, letting
  $a_c=a_c(\tilde {\varLambda })$,
  $c=c(\tilde {\varLambda })$ and
  $K=K(\tilde {\varLambda })$, and taking a derivative with respect to
  $\tilde {\varLambda }$ results in
 \begin{align} &\frac{{\rm d}K}{{\rm d}\tilde{\varLambda}}+\frac{Q^2}{2}\frac{{\rm d}c}{{\rm d}\tilde{\varLambda}} \nonumber\\ &\quad =\left[S_2\left({-}a_cQ^2+\frac{Q^4}{2a_c}\right)+S_3\left(\frac{4a_c^3}{Q^{2}}-8a_c+\frac{4Q^2}{a_c}\right)(Q'+Q^2Q''')\right]\left(\frac{{\rm d}a_c}{{\rm d}\tilde{\varLambda}}+a_c\right), \end{align}
where terms of  $O(\tilde {\varLambda })$ have been omitted. In addition, the values of
  $c$ and
  $K$ for turning point solutions found numerically at small values of
  $\tilde {\varLambda }$ suggest that
  ${{\rm d}c}/{{\rm d}\tilde {\varLambda }}$ and
  ${{\rm d}K}/{{\rm d}\tilde {\varLambda }}$ may also be neglected in (4.5) for
  $\tilde {\varLambda }\ll 1$. The remaining terms are clearly satisfied so long as
  ${\rm d}a_c/{\rm d}\tilde {\varLambda }=-a_c$. Solving this ordinary differential equation using initial condition
  $a_c(0)=a_{c,0}$ results in
  $a_c=a_{c,0}\exp (-\tilde {\varLambda })$. For
  $\tilde {\varLambda }\ll 1$, this is well approximated by
 \begin{equation} a_c(\tilde{\varLambda})=a_{c,0}(1-\tilde{\varLambda}). \end{equation}
This simple prediction for the critical thickness as a function of slip is shown by the solid line in figure 11.
Before proceeding, we note that the validity of the model depends on the condition  $\epsilon =\bar {\kappa }/\bar {R}_0\ll 1$, sometimes referred to as a ‘small-slope’ approximation (e.g. Gauglitz & Radke Reference Gauglitz and Radke1988), being satisfied. Since
  $\bar {\kappa }$ is not directly specified, the validity of the model may be checked a posteriori by ensuring that the model solution satisfied this criterion at all times. This has been done previously in no-slip cases (see e.g. Ogrosky Reference Ogrosky2021b), and was briefly checked here as well. Figure 12 shows the evolution of
  $\max _z|R_z(z,t)|$ for the two solutions in figure 9(a). For all time in solution 1,
  $\max _z|R_z(z,t)|<0.3$; for solution 2, this value can reach as high as 1.5 in the late stages of plug formation. While these values attained immediately prior to a plug forming violate the ‘small-slope’ approximation, it has been shown that this long-wave modelling approach produces remarkable agreement with experiments during the early stages of plug formation; only during the final stages does the accuracy break down (Pahlavan et al. Reference Pahlavan, Stone, McKinley and Juanes2019).

Figure 12. Evolution of  $\max _z|R_z(z,t)|$ for solutions from figure 9(a).
Next, the case where  $S_1>0$ is considered. In this case, the possibility of plug formation in the model is eliminated owing to the fixed volume flux of air; see Camassa & Ogrosky (Reference Camassa and Ogrosky2015) for more discussion of this point. With both
  $S_1>0$ and
  $S_2>0$, the waves grow and saturate, with movement up or down the tube depending on the relative magnitude of
  $S_1$ and
  $S_2$. In the case
  $S_2=0$, the waves move strictly up the tube as expected and as shown in figure 3(a).
For the no-slip case with  $S_2=0$, it has been shown that as long as the film is thin enough, the fluid within travelling waves may form a region of recirculation, or ‘trapped core’ of fluid that effectively rolls along the film substrate; such waves may also be referred to as ‘roll waves’. This region of recirculation can be distinguished from the underlying substrate by a separatrix present in a plot of the streamlines. If the film is thicker than some threshold value (which depends on the value of
  $S_1$ and
  $S_3$), travelling wave solutions show streamlines that may be fanned or constricted but do not form regions of recirculation (Camassa et al. Reference Camassa, Forest, Lee, Ogrosky and Olander2012). This topological difference in streamlines was shown not to be present in the thin-film model of Kerchman (Reference Kerchman1995), for which regions of recirculation are present in all solutions explored. This streamline topology can have consequences for the transport of the film along the tube and the transport of insoluble surfactant or other particles lying at the free surface, and we explore the impact of slip on streamline topology next.
The Stokes streamfunction  $\varPsi$ for a travelling wave solution is defined by
 \begin{equation} u={-}\partial_z \varPsi \quad \text{and} \quad w-c=\frac{1}{r}\partial_r(r\varPsi), \end{equation}
where  $c$ is the speed of the travelling wave solutions. Using (2.16) for
  $w$, the radial velocity
  $u$ may be solved for using the continuity equation (2.13c) and boundary condition
  $u=0$ at
  $r=a$. Integrating
  $u$ with respect to
  $z$ then yields the streamfunction:
 \begin{align}
\varPsi&={-}\frac{cr}{2}+\frac{1}{4r}\left(-\frac{S_1}{R^4}+\frac{S_2}{2}+\frac{4S_3}{R^2}(R_z+R^2R_{zzz})\right)((a^2-r^2)^2-4\tilde{\varLambda}a^2(r^2-a^2))\nonumber\\
&\quad
-\frac{1}{4r}(S_2R^2+8S_3(R_z+R^2R_{zzz}))\left(a^2-r^2+2r^2\ln\left(\frac{r}{a}\right)-2\tilde{\varLambda}(r^2-a^2)\right).
\end{align}
\begin{align}
\varPsi&={-}\frac{cr}{2}+\frac{1}{4r}\left(-\frac{S_1}{R^4}+\frac{S_2}{2}+\frac{4S_3}{R^2}(R_z+R^2R_{zzz})\right)((a^2-r^2)^2-4\tilde{\varLambda}a^2(r^2-a^2))\nonumber\\
&\quad
-\frac{1}{4r}(S_2R^2+8S_3(R_z+R^2R_{zzz}))\left(a^2-r^2+2r^2\ln\left(\frac{r}{a}\right)-2\tilde{\varLambda}(r^2-a^2)\right).
\end{align} Figure 13 shows three travelling wave solutions with  $S_1=0.1$,
  $S_2=0$,
  $S_3=0.568$,
  $a\approx 1.25$ and different values of
  $\tilde {\varLambda }$. For small values of
  $\tilde {\varLambda }$, there is a small but distinct region of recirculation at the wave crest, as in figure 13(b). For larger
  $\tilde {\varLambda }$, no such recirculation region is present, as in figure 13(c). The absence of any region of recirculation was confirmed by comparing the travelling wave speed
  $c$ with the velocity of the fluid at the wave crest
  $w_c$: in figure 13(c),
  $c-w_c>0$, while for figure 13(b),
  $c-w_c<0$.

Figure 13. Travelling wave solutions and streamlines for  $S_1=0.1$,
  $S_2=0$,
  $S_3=0.568$ and
  $a=1.25$. (a)
  $\tilde {\varLambda }=0, c=0.134$; a region of recirculation exists. (b)
  $\tilde {\varLambda }=0.25, c=0.586$; recirculation continues. (c)
  $\tilde {\varLambda }=0.40, c=0.872$; no region of recirculation is present.
The quantity  $c-w_c$ is plotted in figure 14 for a variety of solutions with
  $S_1=0.1$,
  $S_2=0$,
  $S_3=0.568$ and
  $a\approx 1.25$. For no slip,
  $c-w_c<0$, indicating a region of recirculation at the wave crest. For very small
  $\tilde {\varLambda }$,
  $c-w_c$ actually decreases, reaching a minimum near
  $\tilde {\varLambda }=0.1$. For larger values of
  $\tilde {\varLambda }$,
  $c-w_c$ increases, becoming positive near
  $\tilde {\varLambda }=0.35$, indicating a threshold value for
  $\tilde {\varLambda }$ past which recirculation does not occur.

Figure 14. The quantity  $c-w_c$ plotted as a function of
  $\tilde {\varLambda }$ for travelling wave solutions with
  $S_1=0.1$,
  $S_2=0$,
  $S_3=0.568$ and
  $a\approx 1.25$. Velocity
  $w_c$ refers to the fluid velocity at the wave crest. Positive values of
  $c-w_c$ indicate the existence of a region of recirculation.
This recirculation was explored for other film thicknesses and parameter values. For films thicker than some threshold value, there was no recirculation present for any value of  $\tilde {\varLambda }$. Likewise, for the falling-film case of
  $S_1=0$ and
  $S_2>0$, recirculation was not found for the parameter values used, regardless of slip.
5. Conclusion
A long-wave asymptotic model has been developed and studied for a film coating the interior of a rigid tube. The cases of the core region consisting of (i) passive air and (ii) pressure-driven airflow have been considered. The model was derived using a Navier-slip boundary condition in which the velocity at the wall is assumed to be proportional to the velocity's normal derivative at the wall, with proportionality constant denoted the slip length. This boundary condition also applies to the flow of a film over a porous boundary under certain simplifying assumptions. In the limit of zero slip length, previously studied no-slip models are recovered.
Linear stability analysis showed that increasing slip length results in increasing the growth rate of long-wave disturbances to the free surface. The speed of disturbances is also modified; in many cases the speed increases, though this depends on the film thickness and other parameter values.
Solutions to the nonlinear evolution equation show that once disturbances have grown beyond the linear regime, one of two outcomes is possible. In the first case, the growth saturates due to the nonlinearities present in the model, resulting in a wave train moving along the tube. Increasing the slip length increases the amplitude of these waves. In the second case, one of the waves undergoes accelerated growth with the wave crest tending to  $r=0$ in finite time, indicating the formation of a liquid plug. These nonlinear simulations indicate that there is a critical film thickness past which plug formation may be expected; similarly, for some fixed values of film thickness, there is a critical value of slip length past which plug formation may be expected.
In the case of a falling film with passive air core, families of travelling wave solutions contain a turning point at this critical thickness; past this thickness, no travelling wave solutions are found. A simple approximation, which holds for small slip length, was derived for the dependence of this critical thickness on slip length. It is important to note that whether or not a simulation results in plug formation can depend on other factors as well, e.g. initial conditions, domain length, etc.
In the case of pressure-driven airflow, it was shown that increasing the slip length can suppress the formation of a region of circulation within these free-surface waves. This was verified by examining streamlines in travelling wave solutions and also the difference between wave speed and the speed of a fluid parcel at the wave crest; it was noted that there was a non-monotonic change in this difference as slip length increased.
Funding
This work was supported by the Simons Foundation, no. 851065, no. 854116.
Declaration of interests
The authors report no conflict of interest.


 Open access