


1. Introduction
The flow development in the initial region of jets, located just downstream of the nozzle exit and consisting of shear layers bounding an irrotational core, has been carefully and extensively investigated for more than 60 years. In particular, the shear layers have been the subject of numerous works, listed in the two review papers by Ho & Huerre (Reference Ho and Huerre1984) and Thomas (Reference Thomas1991), for instance, because of the variety of phenomena taking place there, whose roles are important with regard to laminar–turbulent transition, jet flow mixing and noise generation. Among these phenomena, the presence of sinusoidal waves at specific frequencies based on the thickness of the shear layers, first growing exponentially near the nozzle lip, then saturating and finally decaying farther downstream, has been recognized at least since the experiments of Sato (Reference Sato1956, Reference Sato1960). These waves have been identified as the Kelvin–Helmholtz instability waves and characterized using linear and nonlinear stability models in many studies, such as those of Michalke (Reference Michalke1964) and Gudmundsson & Colonius (Reference Gudmundsson and Colonius2011) to name a couple of them.
Regarding the frequency of the predominant instability wave in a shear layer, Michalke (Reference Michalke1964) predicted a maximum instability growth rate at a momentum-thickness-based Strouhal number  $St_{\theta }$ equal to 0.017 for a hyperbolic–tangent velocity profile using a spatial linear stability analysis. This value was confirmed in Freymuth (Reference Freymuth1966) by exciting an initially laminar shear layer by acoustic waves. The frequencies obtained for non-excited shear layers and jets are usually lower than this value, as pointed out in Zaman & Hussain (Reference Zaman and Hussain1981). For example, values of $St_{\theta }=0.012$ and $0.013$ were measured by Zaman & Hussain (Reference Zaman and Hussain1980) and Drubka, Reisenthel & Nagib (Reference Drubka, Reisenthel and Nagib1989), respectively. Hussain (Reference Hussain1986) attributed this discrepancy to the fact that $St_{\theta }=0.017$ corresponds to the case of maximum amplification rate and perhaps not to the case of maximum amplification. In the jet experiments of the literature collected in Gutmark & Ho (Reference Gutmark and Ho1983), the Strouhal number of the dominant instability wave downstream of the nozzle was even found to vary from $St_{\theta }=0.009$ up to $0.018$. There may be several reasons for this scatter. One is the influence of the shape and the thickness of the velocity profiles on the most unstable frequencies in jet shear layers, quantified in Michalke (Reference Michalke1984) and Morris (Reference Morris2010) using linear stability analysis. In particular, the instability Strouhal numbers $St_{\theta }$ are higher for a turbulent nozzle-exit boundary-layer profile than for a laminar one according to experiments (Drubka & Nagib Reference Drubka and Nagib1981; Hussain & Zaman Reference Hussain and Zaman1985) and to simulations (Bogey & Sabatini Reference Bogey and Sabatini2019). Another reason for the frequency scattering may be related to the possibility of helical instability modes, whose amplification rates are similar to those of the axisymmetric ones (Mattingly & Chang Reference Mattingly and Chang1974). Hence, the predominance of one mode over the other can be expected to depend on the initial disturbances in the shear layer, as noted in Drubka et al. (Reference Drubka, Reisenthel and Nagib1989).
The initial disturbances can come from upstream or from downstream of the nozzle exit. The effects of upstream disturbances on the early development of jets have been highlighted in a series of papers, by Bradshaw (Reference Bradshaw1966), Hussain & Zedan (Reference Hussain and Zedan1978), Browand & Latigo (Reference Browand and Latigo1979) and Bogey, Marsden & Bailly (Reference Bogey, Marsden and Bailly2012), among others. It has been established that, downstream of the nozzle, the levels of velocity fluctuations rapidly increase and reach a sharp peak during the laminar–turbulent transition for laminar exit conditions, but grow monotonically for highly disturbed ones. For laminar conditions, the properties of the instability wave dominating near the nozzle were also reported to vary with the upstream disturbances. The peak associated with the instability wave was shown, for instance, to be less prominent in the shear-layer spectra for stronger disturbances (Drubka et al. Reference Drubka, Reisenthel and Nagib1989). Its frequency also appeared to be linked to the spectral content of the disturbances in some experiments. This was the case in Gutmark & Ho (Reference Gutmark and Ho1983), where a stepwise variation of the frequency with the jet velocity was observed and attributed to the presence of small upstream disturbances in the plenum chamber, producing spatially coherent disturbances at the nozzle exit. This was also discussed in Cohen & Wygnanski (Reference Cohen and Wygnanski1987) where, on the basis of velocity spectra obtained at the nozzle exit as well as slightly downstream, the most energetic frequency in the flow was demonstrated to be an outcome of both the initial spectral distribution and the instability amplification curve. As mentioned above, the disturbances affecting the initial shear layer development can originate from downstream, as was proposed by Dimotakis & Brown (Reference Dimotakis and Brown1976), Laufer & Monkewitz (Reference Laufer and Monkewitz1980) and Ho & Huang (Reference Ho and Huang1982). In these authors’ view, the near-nozzle flow is influenced by upstream-propagating fluctuations through a feedback mechanism, which is similar to that occurring in an impinging jet (Powell Reference Powell1953; Ho & Nosseir Reference Ho and Nosseir1981). These fluctuations may be acoustic waves generated by vortex pairings taking place in the shear layer. Evidence of such a feedback mechanism in initially fully laminar jets at a Mach number of 0.50 was provided in Bogey (Reference Bogey2021a). Given recent findings, the upstream-propagating fluctuations can also be thought to be guided jet waves and not classical sound waves travelling on both sides of the jet.
The guided jet waves, sometimes also called neutral acoustic waves in the literature, are essentially confined inside the jet flow. As first shown in Tam & Hu (Reference Tam and Hu1989), they have specific dispersion relations and eigenfunctions, which can be predicted using a vortex-sheet model, and they are classified into modes depending on their radial and azimuthal structures. Following the seminal work of Tam & Ahuja (Reference Tam and Ahuja1990) and Shen & Tam (Reference Shen and Tam2002), the upstream-propagating guided jet waves, only allowed in narrow frequency bands (Tam & Norum Reference Tam and Norum1992), have been shown to play a key role in the occurrence of resonance phenomena in jets over the last few years (Edgington-Mitchell Reference Edgington-Mitchell2019). For example, they turned out to close the feedback loops encountered in jets impinging on a plate (Gojon, Bogey & Marsden Reference Gojon, Bogey and Marsden2016; Bogey & Gojon Reference Bogey and Gojon2017; Jaunet et al. Reference Jaunet, Mancinelli, Jordan, Towne, Edgington-Mitchell, Lehnasch and Girard2019; Varé & Bogey Reference Varé and Bogey2022), in jets interacting with an edge (Jordan et al. Reference Jordan, Jaunet, Towne, Cavalieri, Colonius, Schmidt and Agarwal2018) or a flat plate (Zaman et al. Reference Zaman, Fagan, Bridges and Brown2015; Tam & Chandramouli Reference Tam and Chandramouli2020), in screeching shock-containing jets (Edgington-Mitchell et al. Reference Edgington-Mitchell, Jaunet, Jordan, Towne, Soria and Honnery2018; Gojon, Bogey & Mihaescu Reference Gojon, Bogey and Mihaescu2018; Mancinelli et al. Reference Mancinelli, Jaunet, Jordan and Towne2019) and in supersonic twin jets (Nogueira & Edgington-Mitchell Reference Nogueira and Edgington-Mitchell2021). In these cases, strong aeroacoustic resonance processes, which can be isolated using the proper orthogonal decomposition method for instance (Edgington-Mitchell et al. Reference Edgington-Mitchell, Wang, Nogueira, Schmidt, Jaunet, Duke, Jordan and Towne2021), happen and lead to the formation of standing-wave patterns in the jet near-pressure field (Panda Reference Panda1999).
For subsonic and ideally expanded supersonic free jets, the upstream-propagating guided jet waves also result in peaks in the pressure spectra near the nozzle exit just outside the flow (Suzuki & Colonius Reference Suzuki and Colonius2006; Brès et al. Reference Brès, Jordan, Jaunet, Le Rallic, Cavalieri, Towne, Lele, Colonius and Schmidt2018), propagating to the far field in the upstream direction (Bogey Reference Bogey2022b). Above a Mach number of approximately 0.80, the peaks are tonal and emerge strongly, due to resonant interactions between upstream-propagating and downstream-propagating guided jet waves in the jet potential core according to Towne et al. (Reference Towne, Cavalieri, Jordan, Colonius, Schmidt, Jaunet and Brès2017) and Schmidt et al. (Reference Schmidt, Towne, Colonius, Cavalieri, Jordan and Brès2017). For lower Mach numbers, they persist but are progressively broader and weaker as the jet velocity decreases (Jaunet et al. Reference Jaunet, Jordan, Cavalieri, Towne, Colonius, Schmidt and Brès2016; Zaman, Fagan & Upadhyay Reference Zaman, Fagan and Upadhyay2022). This trend, as well as the variations of the properties of the near-nozzle acoustic peaks between Mach numbers  $0.50$ and 2, in terms of frequency, amplitude, prominence and azimuthal structure, notably, have been recently detailed and discussed in Bogey (Reference Bogey2021a). Despite this newly acquired knowledge, several questions remain about the upstream-propagating guided jet waves (Brès & Lele Reference Brès and Lele2019). For shock-free non-impinging jets, in particular, little is known about the effects of these waves on the Kelvin–Helmholtz instability waves growing in the shear layers downstream of the nozzle lip.
In the present work, the interactions between upstream-propagating guided jet waves and shear-layer instability waves in subsonic and nearly ideally expanded supersonic, initially laminar free jets are investigated using highly resolved large-eddy simulations (LES). The work is focused on the scattering of the former waves into the latter near the jet nozzle and does not address the issue of the interactions that might occur far from the nozzle exit, typically near the end of the jet potential core. The jets, approximately half of which were considered in Bogey (Reference Bogey2021a), have a diameter-based Reynolds number of  $10^5$ and Mach numbers between 0.50 and 2. Their boundary layers have thicknesses varying from 2.5 % up to 40 % of the nozzle radius and they are untripped in the nozzle, leading to fully laminar exit flow conditions. In this way, a wide range of Mach numbers and very different boundary-layer thicknesses are considered. In practice, the emergence of peaks associated with Kelvin–Helmholtz instability waves in the velocity spectra downstream of the nozzle will be explored. The characteristics of the instability waves, including their frequencies, azimuthal modes and amplitudes, and their variations with the boundary-layer thickness and the jet velocity will be described. The possibility that the development of the instability waves may be affected, or even driven, by guided jet waves will be examined. This will be done by seeking discontinuous and staging changes with the jet velocity such as those exhibited by the screech modes in shock-containing jets (Raman Reference Raman1998; Gojon et al. Reference Gojon, Bogey and Mihaescu2018). The frequencies of the instability waves will also be compared with those predicted using linear stability analysis from the LES mean flow profiles and with the frequency bands of the free-stream upstream-propagating guided jet waves given by a vortex-sheet model. Finally, the presence of standing-wave patterns will be checked in the jet flow and near-pressure fields at the instability waves frequencies. For jets with fully laminar nozzle-exit boundary layers, the exit velocity profile is highly sensitive to disturbances of small amplitude, making a coupling with guided jet waves very likely. The consequences of such a coupling concerning, for instance, the scattering of the Strouhal number $St_{\theta }$ of the predominant initial instability wave and the forcing of the laminar–turbulent transition in non-excited jets will be addressed.
The paper is organized as follows. In § 2, the jet initial conditions and the LES methods and parameters are documented. In § 3, vorticity and pressure snapshots are first shown. Second, frequency–wavenumber spectra computed from pressure fluctuations in the shear layers are displayed. Third, the initial development of the jet shear layers is investigated. For that, the most unstable frequencies are calculated from the LES mean flow profiles using linear stability analysis. Then, the features of the velocity and pressure fields downstream of the jet nozzle are detailed. Concluding remarks are given in § 4. Finally, the allowable frequency bands of the free-stream upstream-propagating guided jet waves determined by a vortex-sheet model are presented in Appendix A, near-nozzle acoustic results obtained for the present jets, missing in Bogey (Reference Bogey2021a), are provided in Appendix B and the variations of the most unstable frequencies downstream of the jet nozzle with the axial distance are illustrated in Appendix C.
2. Parameters
2.1. Jet definition
The jets in this work are isothermal round free jets at Mach numbers  $M=u_j/c_0$ between 0.50 and 2 and at a Reynolds number $Re_D=u_jD/\nu$ of $10^5$, where $u_j$, $D$,
$D$,  $c_0$ and $\nu$ are the jet initial velocity and diameter, the speed of sound in the ambient medium and the kinematic molecular viscosity. Fifty-eight jets are considered in order to accurately describe the Mach number range mentioned above for different nozzle-exit boundary-layer thicknesses. Their main parameters are collected in table 1 and represented in figure 1. They originate at $z=0$ from a straight pipe nozzle of radius $r_0=D/2$ and length $2 r_0$, whose lip is $0.053r_0$ thick, into a medium at rest at a temperature $T_0=293$ K and a pressure $p_0=10^5$ Pa. At the pipe inlet, at $z=-2r_0$, Blasius laminar boundary-layer profiles of thickness $\delta _{BL}$ are imposed for the axial velocity $u_z$, radial and azimuthal velocities $u_r$ and $u_{\theta }$ are set to zero, pressure is equal to $p_0$ and temperature is determined by a Crocco–Busemann relation.
Table 1. Jet Mach and Reynolds numbers  $M$ and $Re_D$, thickness $\delta _{BL}$ of the Blasius profiles at the pipe-nozzle inlet, momentum thickness $\delta _{\theta }(z=0)$ and peak turbulence intensity $u'_e/u_j$ at the exit.


Figure 1. Jet Mach number  $M$ and thickness $\delta _{BL}$ of the Blasius profiles at the pipe-nozzle inlet.
In the nozzle pipe, the boundary layers are untripped, yielding fully laminar flow conditions at the exit. However, it was necessary to add disturbances in the flow at the beginning of the simulations in order to trigger the formation of vortical structures in the jets, which would, otherwise, remain laminar over very long time periods. In practice, pressure fluctuations of maximum amplitude 200 Pa random in space and time are arbitrarily introduced between  $z=0.25r_0$ and $z=4r_0$ in the shear layers between times $t=0$ and $t=12.5 r_0/u_j$. Afterwards, the turbulent development of the initially laminar jets sustains by itself without any external excitation. The acoustic waves generated by the jets travelling in the upstream direction may be involved in this process, which will investigated in what follows.
Twenty-four jets have a pipe-inlet boundary layer of thickness  $\delta _{BL}=0.2r_0$ and Mach numbers increasing from $M=0.50$ up to $M=2$ in increments of $\Delta M=0.05$ for $M \leq 1.30$ and of $\Delta M=0.10$ for $M \geq 1.30$. Thirty-two jets have pipe-inlet boundary layers of thickness $\delta _{BL}=0.05r_0$ or $0.1r_0$, and Mach numbers ranging from $M=0.50$ up to $M=2$ in increments of $\Delta M=0.10$. There are also two jets at $M=0.90$ with $\delta _{BL}=0.025r_0$ and $\delta _{BL}=0.4r_0$. Past or partial simulations of the jets at $M=0.90$ were presented in Bogey & Bailly (Reference Bogey and Bailly2010) and Bogey (Reference Bogey2018). Results obtained for the jets at $M=0.50$ and at $M=0.90$ and for those with $\delta _{BL}=0.2r_0$ can be found in Bogey (Reference Bogey2021a). For the five jets at $M=0.90$, these results include the nozzle-exit mean and root-mean-square (r.m.s.) velocity profiles. The mean profiles resemble the pipe-inlet Blasius profiles and are characterized by momentum thicknesses varying from $\delta _{\theta }=0.004r_0$ up to $\delta _{\theta }=0.047r_0$, as reported in table 1, with $\delta _{\theta } \simeq 0.007r_0$ for $\delta _{BL}=0.05r_0$, $\delta _{\theta } \simeq 0.012r_0$ for $\delta _{BL}=0.1r_0$ and $\delta _{\theta } \simeq 0.024r_0$ for $\delta _{BL}=0.2r_0$. For comparison, Zaman (Reference Zaman1985) measured $\delta _{\theta }=0.0062r_0$ in an untripped jet at $Re_D=10^5$. With respect to this jet, the boundary layer is thinner in the jet with $\delta _{BL}=0.025r_0$, similar for $\delta _{BL}=0.05r_0$ and thicker for $\delta _{BL}\geq 0.1r_0$. As for the velocity fluctuations, their peak r.m.s. values $u'_e$ at the nozzle exit do not exceed $0.002u_j$, indicating that the jets are initially fully laminar.
2.2. Numerical methods
The numerical methods in the LES are identical to those used in previous jet simulations of the author since Bogey & Bailly (Reference Bogey and Bailly2010). The LES have been carried out using an in-house solver of the three-dimensional filtered compressible Navier–Stokes equations in cylindrical coordinates  $(r,\theta,z)$ based on low-dissipation and low-dispersion explicit schemes. The axis singularity is taken into account by the method of Mohseni & Colonius (Reference Mohseni and Colonius2000). In order to alleviate the time-step restriction near the cylindrical origin, the derivatives in the azimuthal direction around the axis are calculated at coarser resolutions than permitted by the grid (Bogey, de Cacqueray & Bailly Reference Bogey, de Cacqueray and Bailly2011). For the points closest to the axis, they are evaluated using $16$ points, yielding an effective resolution of $2{\rm \pi} /16$. Fourth-order eleven-point centred finite differences are used for spatial discretization and a second-order six-stage Runge–Kutta algorithm is implemented for time integration (Bogey & Bailly Reference Bogey and Bailly2004). A sixth-order eleven-point centred filter (Bogey, de Cacqueray & Bailly Reference Bogey, de Cacqueray and Bailly2009) is applied explicitly to the flow variables every time step. Non-centred finite differences and filters are also used near the pipe walls and the grid boundaries (Berland et al. Reference Berland, Bogey, Marsden and Bailly2007). The explicit filtering is employed to remove grid-to-grid oscillations, but also as a subgrid-scale high-order dissipation model. The performance of this LES approach has been studied for subsonic jets (Bogey & Bailly Reference Bogey and Bailly2006), Taylor–Green vortices (Fauconnier, Bogey & Dick Reference Fauconnier, Bogey and Dick2013) and turbulent channel flows (Kremer & Bogey Reference Kremer and Bogey2015). For the jets at $M\geq 1.30$, containing weak shock cells in their potential cores as will be mentioned in § 3.1, a shock-capturing filtering is applied in order to avoid Gibbs oscillations near the shocks. It consists of applying a conservative second-order filter at a magnitude determined each time step using a shock sensor (Bogey et al. Reference Bogey, de Cacqueray and Bailly2009). At the boundaries, the radiation conditions of Tam & Dong (Reference Tam and Dong1996) are applied, with the addition of a sponge zone combining grid stretching and Laplacian filtering at the outflow. At the inflow and radial boundaries, density and pressure are also brought back close to $p_0$ and $\rho _0$ at rate of $0.5\,\%$ every $0.055r_0/c_0$, in order to keep the mean values of density and pressure around their ambient values without generating significant acoustic reflections. No co-flow is imposed.
2.3. Simulation parameters
The grids used in the present LES are described and their quality has been assessed in several papers. In particular, the variations of the mesh spacings can be found in Bogey (Reference Bogey2021a). The influence of the grid resolution in the three coordinate directions on the flow and acoustic fields of the two jets at  $M=0.90$ with $\delta _{BL}=0.2r_0$ and $0.025r_0$ were investigated in Bogey & Bailly (Reference Bogey and Bailly2010) and Bogey (Reference Bogey2018).
All the jets are simulated using the same grid in the  $(r,z)$ plane, detailed and referred to as gridz40B in Bogey (Reference Bogey2018). It contains $N_r=504$ and $N_z=2048$ points in the radial and axial directions and extends radially out to $r=L_r = 15r_0$ and axially, excluding the 100-point outflow sponge zone, down to $z=L_z=40r_0$. In the radial direction, the mesh spacing $\Delta r$ is equal to $\Delta r_{min}=0.0036r_0$ at $r=r_0$ and to $0.075r_0$ between $r=6.25r_0$ and $r=L_r$ in the jet near-pressure field. For an acoustic wave discretized by five points per wavelength, the mesh spacing of $0.075r_0$ provides diameter-based Strouhal numbers of $St_D=fD/u_j=10.7$ for $M=0.50$, $St_D=5.9$ for $M=0.90$, $St_D=4.1$ for $M=1.30$ and $St_D=2.7$ for $M=2$, where $f$ is the frequency. In the axial direction, the mesh spacing $\Delta z$ is equal to $0.0072r_0$ between $z=-r_0$ and $z=0$. Farther downstream, it increases and reaches $\Delta z=0.049r_0$ at $z=L_z$. Finally, the number of points in the azimuthal direction was set at $N_{\theta }=512$ for the three jets at $M=0.90$ with $\delta _{BL}\leq 0.1r_0$ and at $N_{\theta }=256$ for all others. This leads to 528 million points and 262 million points in the three-dimensional grids, respectively.
In the LES, the time step is given by  $\Delta t=0.7 \times \Delta r_{min}/c_0$, ensuring numerical stability up to $M=2$. After a transient period varying from $275r_0/u_j$ up to $400r_0/u_j$ depending on the jet initial conditions, the simulations have all been carried out during a time period $T=500r_0/u_j$. In order to improve the statistical convergence of the results, the LES have been continued from this time onwards for the four jets at $M=0.90$ with $\delta _{BL}\leq 0.2r_0$, yielding $T=3000r_0/u_j$ for $\delta _{BL}=0.2r_0$, $1000r_0/u_j$ for $\delta _{BL}=0.1r_0$ and $\delta _{BL}=0.05r_0$ and $2000r_0/u_j$ for $\delta _{BL}=0.025r_0$.
In the simulations, density, velocity components and pressure have been recorded at several locations during time  $T$, creating a data base of the order of 200 TB; refer to Bogey (Reference Bogey2022a) for an exhaustive description of the data available. The data of interest in this work include those on the cylindrical surface at $r=r_0$ and the cross-section at $z=0$, which have been stored at a sampling frequency corresponding to $St_D=12.8$, with 256 points in the azimuthal direction. The signals have also been acquired in the azimuthal planes at $\theta =0$, ${\rm \pi} /4$, ${\rm \pi} /2$ and $3{\rm \pi} /4$ at a sampling frequency of $St_D=6.4$. The Fourier coefficients estimated over the section $(r,z)$ have been saved in the same way for the first nine azimuthal modes $n_{\theta }=0$ to 8 for the jets at $M=0.90$ and for $n_{\theta }=0$ and 1 otherwise. The flow and acoustic near field statistics presented in what follows are calculated from these recordings. They are averaged in the azimuthal direction, when possible. The time spectra are evaluated from overlapping samples of duration $90 r_0/u_j$.
Finally, the simulations have been carried out using an OpenMP-based in-house solver on single nodes with 16 to 40 cores provided by the French high-performance computing (HPC) centres listed in the acknowledgment section. They needed 50 GB of memory using  $N_{\theta }=256$ points and 100 GB using $N_{\theta }=512$ points. The number of iterations varies between 170 000 for the jets at $M=2$ and $1.44 \times 10^6$ for the jet at $M=0.9$ with $\delta _{BL}=0.2r_0$.
3. Results
3.1. Vorticity and pressure snapshots
In order to illustrate the influence of the Mach number and of the nozzle-exit boundary-layer thickness on the jet initial development and near-pressure field, snapshots of vorticity and pressure obtained downstream of the nozzle are provided in figure 2(a–c) for the jets with  $\delta _{BL}=0.2r_0$ at $M=0.60$, 0.90 and 1.50 and in figure 2(d,e) for the jets at $M=0.90$ with $\delta _{BL}=0.1r_0$ and $0.4r_0$. As expected (Winant & Browand Reference Winant and Browand1974), roll-ups of the initially fully laminar shear layers and pairings of vortical structures are observed in all cases. As the Mach number increases, in figure 2(a–c), they occur later due to the lower amplification rates of the instability waves (Michalke Reference Michalke1984; Morris Reference Morris2010). As the nozzle-exit boundary layer is thicker, they also happen farther away from the nozzle in figure 2(b,d,e).

Figure 2. Snapshots in the  $(z,r)$ plane of the vorticity norm between $r=0.5r_0$ and $r=1.5r_0$ and of the pressure fluctuations otherwise for the jets with $\delta _{BL}=0.2r_0$ at (a) $M=0.60$, (b) $M=0.90$ and (c) $M=1.50$, and for the jets at $M=0.90$ with (d) $\delta _{BL}=0.1r_0$ and (e) $\delta _{BL}=0.4r_0$, The colour scale levels range between ${\pm }12u_j/r_0$ for vorticity, and (a) ${\pm }3.5\times 10^{-3} p_0$, (b,d,e) ${\pm }4.75\times 10^{-3} p_0$ and (c) ${\pm }1.3\times 10^{-2} p_0$ for pressure, from blue to red.
In the pressure fields, hydrodynamic fluctuations dominate near the flow large-scale structures (Arndt, Long & Glauser Reference Arndt, Long and Glauser1997). Footprints of weak shock cells are visible in the core of the supersonic jet in figure 2(c) despite the fact that ambient pressure is imposed at the inlet of the pipe nozzle. The noise radiated by the vortex pairings in the downstream direction (Colonius, Lele & Moin Reference Colonius, Lele and Moin1997) also appears. Finally, acoustic waves propagating in the upstream direction can be seen inside and outside of the jets. The properties of these waves in the near-nozzle region and their propagation to the upstream far field were investigated in previous papers (Bogey Reference Bogey2021a, Reference Bogey2022b). Additional results can be found in Appendix B.
3.2. Frequency–wavenumber spectra in the jet shear layers
To verify the presence of guided jet waves in the jet shear layers, a space–time Fourier transform has been applied to the pressure fluctuations recorded on the nozzle-lip line for the jets at  $M=0.90$. The pressure fluctuations are taken at $r=r_0$ between $z=0$ and $z=0.7z_c$, where $z_c$ denotes the position at which the centreline mean axial velocity is equal to $0.95u_j$, corresponding approximately to the end of the potential core.
The spectra obtained for the jets with  $\delta _{BL}=0.1r_0$, $0.05r_0$ and $0.025r_0$ for the azimuthal modes $n_{\theta }=0$, 1 and 2 are represented in figures 3(a–c), 3(d–f) and 3(g–i), respectively, as a function of $k$ and $St_D$ for $k\leq 0$. The spectra for the two other jets with thicker boundary layers are not shown, for brevity. The results are very similar in spite of the disparity in nozzle-exit boundary-layer thickness, most likely due to shear-layer spreading between $z=0$ and $z=0.7z_c$. Strong components of aerodynamic nature predominate near $k=0$ for low Strouhal numbers. More interestingly, curved bands of high levels, more pronounced at high frequencies for a thinner boundary layer, are also found on the left side of the line $k=-\omega /c_0$. They are located near the dispersion curves of the guided jet waves given by a vortex-sheet model, indicating that they are due to the presence of such waves. Differences, which can be attributed to the assumption of an infinitely thin shear layer in the model, can be noted between the bands and the dispersion curves. In particular, near the line $k=-\omega /c_0$, the bands are slightly below the dispersion curves, especially as the radial mode number increases. This behaviour is consistent with that observed for the dispersion curves of the guided jet waves for thick mixing layers in Tam & Ahuja (Reference Tam and Ahuja1990). In addition, contrary to the bands appearing in the frequency–wavenumber spectra computed in the jet potential core (Towne et al. Reference Towne, Cavalieri, Jordan, Colonius, Schmidt, Jaunet and Brès2017), the present ones do not follow the entire dispersion curves. Instead, they are restricted to short parts of the curves, extending roughly from the limit points L on $k=-\omega /c_0$ to the stationary points S $_{max}$ associated with a local maximum, between which the group velocity $v_g={\rm d}\omega /{\rm d} k$ is negative. That was also the case in the frequency–wavenumber spectra calculated just outside the jet flow at $r=1.1r_0$ in Bogey (Reference Bogey2021a). Therefore, free-stream upstream-propagating guided jet waves of significant amplitude clearly travel in the mixing layers of the jets, at frequencies close to those predicted for these waves for a vortex-sheet model.

Figure 3. Frequency–wavenumber spectra of the pressure fluctuations at  $r=r_0$ and $0\leq z \leq 0.7z_c$ for the jets at $M=0.90$ with (a–c) $\delta _{BL}=0.1r_0$, (d–f) $\delta _{BL}=0.05r_0$ and (g–i) $\delta _{BL}=0.025r_0$ for (a,d,g) $n_{\theta }=0$, (b,e,h) $n_{\theta }=1$ and (c, f,i) $n_{\theta }=2$ as a function of $(kD,St_D)$; ——– dispersion curves of the guided jet waves, (black circles) L and (red circles) S $_{max}$; – – – $k=-\omega /c_0$. The grey scale levels spread over 25 dB.
3.3. Initial development of the jet shear layers
In this section, the initial development of the jet shear layers is investigated by describing the characteristics of the flow fluctuations obtained downstream of the nozzle. In particular, in order to identify the predominant instability waves, velocity spectra are presented for various distances from the nozzle exit depending on the nozzle-exit boundary-layer thickness and on the jet Mach number. These distances are defined using criteria based on the jet flow properties.
In all cases, the spectra are computed at axial positions close to those of the rolling-ups of the initially laminar shear layers, clearly visible in figure 2 for instance. For the five jets at  $M=0.90$, the velocity spectra are calculated at $z=100 \delta _{\theta }(z=0)$, yielding $z=0.43r_0$, $0.74r_0$, $1.23r_0$, $2.34r_0$ and $4.74r_0$, for the inlet boundary-layer thicknesses $\delta _{BL}=0.025r_0$, $0.05r_0$, $0.1r_0$, $0.2r_0$ and $0.4r_0$, respectively. For the other jets, a different criterion is used in order to take into account the significant variations of the Kelvin–Helmholtz instability growth rates over the jet Mach number range (Michalke Reference Michalke1984; Morris Reference Morris2010). In this case, the spectra are evaluated at $z=z_{turb10\,\%}$, where the r.m.s. value of the axial velocity fluctuations is equal to $0.10u_j$, that is roughly half the peak values reached during the laminar–turbulent transition process (Browand & Latigo Reference Browand and Latigo1979; Husain & Hussain Reference Husain and Hussain1979). Given that this process occurs more slowly with increasing Mach number, as illustrated in figure 2(a–c), the value of $z_{turb10\,\%}$ varies from $z=2.39r_0$ up to $8.83r_0$ for the jets with $\delta _{BL}=0.2r_0$, from $z=1.26r_0$ up to $5.69r_0$ for $\delta _{BL}=0.1r_0$ and from $z=0.77r_0$ up to $4.30r_0$ for $\delta _{BL}=0.05r_0$ between $M=0.50$ and $M=2$.
The Strouhal numbers of the components emerging in the spectra will be compared with the frequencies expected for the most-amplified instability waves according to linear stability analysis. These frequencies are arbitrarily estimated at half the above distances, namely  $z=50 \delta _{\theta }(z=0)$ and $z=z_{turb10\,\%}/2$. Obviously, different frequencies would be obtained at other positions because of the modification of the shape and the thickening of the shear-layer velocity profiles between the nozzle exit and the positions where the spectra are calculated. The variations of the most unstable frequencies with the axial distance downstream of the nozzle are, however, limited to a few per cent, as shown in Appendix C. Note also that the linear stability analysis is performed not to accurately predict the frequencies of the instability waves initially dominating in the jets, which is difficult (Gutmark & Ho Reference Gutmark and Ho1983), but to provide fair approximations of the most unstable frequencies downstream of the nozzle for the wide variety of nozzle-exit boundary-layer thicknesses and jet Mach numbers considered.
3.3.1. Most unstable frequencies downstream of the jet nozzle
As was done in Fontaine et al. (Reference Fontaine, Elliott, Austin and Freund2015) and Brès et al. (Reference Brès, Jordan, Jaunet, Le Rallic, Cavalieri, Towne, Lele, Colonius and Schmidt2018), for example, an inviscid spatial stability analysis has been conducted from the mean flow fields of the jets. In practice, a procedure recently developed in order to investigate the influence of the nozzle-exit boundary-layer profile on the flow and sound fields of high-subsonic jets (Bogey & Sabatini Reference Bogey and Sabatini2019; Bogey Reference Bogey2021b) is used. For a given axial distance  $z$ between $z = 0.02r_0$ and $5r_0$ and for a given Strouhal number $St_D$, the compressible Rayleigh equation (Michalke Reference Michalke1984) is solved through a shooting technique (Morris Reference Morris2010), based on the Euler method for the integration step and on the secant method for the search of the complex wavenumber $k_z$, for the first three azimuthal modes $n_{\theta }=0$, 1 and 2. The integration is performed directly from the LES mean velocity and density profiles, interpolated on a grid extending from $r=0$ to $3r_0$ every $0.0005r_0$ and then smoothed using a high-order centred filter in order to remove spurious high-frequency oscillations. Viscous effects are not taken into account in the analysis. According to the results in Morris (Reference Morris1983, Reference Morris2010), they should be weak in the shear layers of the jets with pipe-inlet boundary-layer thicknesses $\delta _{BL}\geq 0.1r_0$, for which the Reynolds numbers $Re_{\theta }=u_j\delta _{\theta }(z=0)/\nu$ based on the nozzle-exit momentum thickness are greater than 500, but they may be non-negligible for $\delta _{BL} \leq 0.05r_0$. In the last case, they are expected to reduce the growth rates of the instability waves. However, they are unlikely to modify the frequencies of the most amplified instability waves significantly (Morris Reference Morris2010).
The results obtained for the axisymmetric mode  $n_{\theta }=0$ at the near-nozzle axial positions defined previously depending on the jet exit conditions are illustrated in figures 4 and 5. They are very similar to those for $n_{\theta }=1$ and $n_{\theta }=2$, not shown for brevity (Michalke Reference Michalke1984).

Figure 4. Instability (a,b) growth rates and (c) phase velocities obtained at  $z=50 \delta _{\theta }(0)$ for $n_{\theta }=0$ for the jets at $M=0.90$ with $\delta _{BL}=$ (black) $0.4r_0$, (red) $0.2r_0$, (blue) $0.1r_0$, (green) $0.05r_0$ and (maroon) $0.025r_0$ as a function of (a) $St_D$ and (b,c) $St_{\theta }$; (circle) phase velocity at maximum growth rate frequency.

Figure 5. Instability growth rates obtained at  $z=z_{turb10\,\%}/2$ for $n_{\theta }=0$ for the jets with (a) $\delta _{BL}=0.2r_0$, (b) $\delta _{BL}=0.1r_0$ and (c) $\delta _{BL}=0.05r_0$ at $M=$ (black) 0.50, (red) 0.80, (blue) 1.10, (green) 1.40, (maroon) 1.70 and (yellow) 2, as a function of $St_D$; – – – $St_{\theta }=f\delta _{\theta }(0)/u_j=0.017$.
The instability growth rates  $-{\rm Im} (k_z)r_0$ and $-{\rm Im} (k_z)\delta _{\theta }(0)$ calculated for $n_{\theta }=0$ at $z=50 \delta _{\theta }(0)$ for the jets at $M=0.90$ are represented in figure 4(a,b) as a function of $St_D$ and $St_{\theta }=f\delta _{\theta }(z=0)/u_j$, respectively. In figure 4(a), the growth rates strengthen and the range of unstable frequencies broadens as the thickness of the boundary-layer profile decreases (Morris Reference Morris2010), yielding peak Strouhal numbers increasing from $St_D = 0.62$ for $\delta _{BL} = 0.4r_0$ up to $St_D = 5.01$ for $\delta _{BL} = 0.025r_0$. As expected, the amplification curves are much closer to each other in figure 4(b) using a scaling with the nozzle-exit momentum thickness. In that case, the most unstable frequencies are found to correspond to Strouhal numbers $St_{\theta }$ ranging from 0.015 for $\delta _{BL} = 0.4r_0$ down to 0.010 for $\delta _{BL} = 0.025r_0$, in fair agreement with the value of 0.017 predicted for a hyperbolic–tangent velocity profile (Michalke Reference Michalke1984) and with those measured downstream of the nozzle of initially laminar jets (Zaman & Hussain Reference Zaman and Hussain1980; Gutmark & Ho Reference Gutmark and Ho1983; Drubka et al. Reference Drubka, Reisenthel and Nagib1989). The discrepancies observed between the present curves can be attributed to the fact that $\delta _{\theta }(z=0)$ is the length scale used for the scaling following the common practice in the literature, although between $z=0$ and $z=50 \delta _{\theta }(0)$, the shear layers widen appreciably at different rates depending on the jets. More precisely, the shear-layer widening is more pronounced for a thinner boundary layer due to stronger viscous effects. Thus, from the nozzle exit down to $z=50 \delta _{\theta }(0)$, the momentum thickness increases up to $1.13\delta _{\theta }(0)$ for the jet with $\delta _{BL} = 0.2r_0$ and up to $1.29\delta _{\theta }(0)$ for $\delta _{BL} = 0.05r_0$, for instance. The phase velocities $v_{\varphi }=\omega /Re (k_z)$ of the instability waves are plotted in figure 4(c) as a function of $St_{\theta }$. In agreement with the linear stability results obtained by Morris (Reference Morris2010), for example, they are close to or slightly exceed the jet velocity at lower Strouhal numbers, then decrease with the frequency and finally do not vary much or even slightly increase at higher Strouhal numbers. The decrease is more rapid for a thinner boundary layer. The phase velocities reached at the frequency of the highest amplification rate for the five jets are, however, very similar. They range from $v_{\varphi }=0.48u_j$ for $\delta _{BL} = 0.4r_0$ up to $v_{\varphi }=0.50u_j$ for $\delta _{BL} = 0.025r_0$.
The instability growth rates estimated for  $n_{\theta }=0$ at $z=z_{turb10\,\%}/2$ for the jets with $\delta _{BL}=0.2r_0$, $0.1r_0$ and $0.05r_0$ are displayed as a function of $St_D$ in figure 5(a–c) for $M=0.50$, 0.80, 1.10, 1.40, 1.70 and 2. For comparison, the frequencies corresponding to the Strouhal number of $St_{\theta }=f\delta _{\theta }(z=0)/u_j= 0.017$ are also indicated. For the three values of $\delta _{BL}/r_0$, with increasing Mach number, the amplification rates and the range of unstable frequencies are strongly reduced, especially above $M = 1.10$. As a result, the most unstable Strouhal number decreases by a factor of approximately 5 between $M = 0.50$ and $M = 2$. For instance, it drops from $St_D=2.31$ down to $St_D=0.49$ for the jets with $\delta _{BL}=0.1r_0$ in figure 5(b). These trends are consistent with the studies of the influence of the Mach number on the instability growth rates available in the literature (Michalke Reference Michalke1984; Morris Reference Morris2010). In the present figures, however, they are much more marked. This can be explained by the fact that, between $z=0$ and $z=z_{turb10\,\%}/2$, the jet shear layers thicken more significantly at higher Mach numbers. In particular, while the momentum thickness at $z=z_{turb10\,\%}/2$ is similar to that at the nozzle exit for subsonic Mach numbers, it is nearly twice as large for $M\simeq 2$. This is the case for example for the jets with $\delta _{BL}=0.1r_0$, for which the momentum thickness, close to $\delta _{\theta }=0.012r_0$ at $z=0$, is equal to $0.013r_0$ at $z=z_{turb10\,\%}/2$ for $M=0.50$ but to $0.022r_0$ for $M=2$. This shear-layer thickening leads to a further reduction of the instability amplification rates and frequencies.
3.3.2. Results for the jets at a Mach number of 0.90
The initial development of the five jets at a Mach number of 0.90 is first examined. The spectra of radial velocity fluctuations obtained at  $r=r_0$ and $z=100 \delta _{\theta }(0)$ for these jets are represented in figure 6(a) as a function of $St_D$. In agreement with measurements in initially laminar mixing layers (Sato Reference Sato1960; Husain & Hussain Reference Husain and Hussain1979; Gutmark & Ho Reference Gutmark and Ho1983), they are all dominated by a broadband hump resulting from the growth of Kelvin–Helmholtz instability waves. The hump moves to higher frequencies as the jet boundary-layer thickness decreases. As shown in figure 6(b), the peak Strouhal numbers $St_D$ match well the frequencies of the most amplified instability waves estimated at $z=50 \delta _{\theta }(0)$ using linear stability analysis. They are equal to $St_D=0.63$ for $\delta _{BL}=0.4r_0$, $1.27$ for $\delta _{BL}=0.2r_0$, $2.26$ for $\delta _{BL}=0.1r_0$, $3.59$ for $\delta _{BL}=0.05r_0$ and $5.16$ for $\delta _{BL}=0.025r_0$. These values provide Strouhal numbers $St_{\theta }=f\delta _{\theta }(z=0)/u_j$ varying from 0.011 for $\delta _{BL}=0.025r_0$ up to 0.015 for $\delta _{BL}=0.4r_0$, which fall in the Strouhal number range $0.01\leq St_{\theta }\leq 0.018$ of the initial instability frequencies found in various experiments for jets with laminar boundary layers (Drubka et al. Reference Drubka, Reisenthel and Nagib1989).

Figure 6. Power spectral densities of radial velocity fluctuations at  $r=r_0$ and $z=100 \delta _{\theta }(0)$ for the jets at $M=0.90$: (a) spectra as a function of $St_D$ for $\delta _{BL}=$ (black) $0.4r_0$, (red) $0.2r_0$, (blue) $0.1r_0$, (green) $0.05r_0$ and (maroon) $0.025r_0$ and (b) peak Strouhal numbers (filled black circles) $St_D$ and (filled red circles) $St_{\theta }$ as a function of $\delta _{BL}/r_0$; – – – most unstable $St_D$ at $z=50 \delta _{\theta }(0)$ for $n_{\theta }=0$.
Several narrow peaks are also observed in the spectra. They appear in the frequency bands of the broadband humps, as well as outside as is the case for  $\delta _{BL}=0.025r_0$ at $St_D\simeq 0.4$ for example. Within the hump, they emerge strongly for thick boundary layers, leading to dual peaks for $\delta _{BL}=0.2r_0$ and for $\delta _{BL}=0.4r_0$, but more weakly as the value of $\delta _{BL}/r_0$ decreases. Despite this, they remain clearly visible even for $\delta _{BL}=0.025r_0$. Regarding the second strongest peaks, for instance, their Strouhal numbers are equal to $St_D=0.48$ for $\delta _{BL}=0.4r_0$, 1.05 for $\delta _{BL}=0.2r_0$, 2.01 for $\delta _{BL}=0.1r_0$, 3.92 for $\delta _{BL}=0.05r_0$ and 4.89 for $\delta _{BL}=0.025r_0$. With respect to the Strouhal numbers of the dominant peaks, they differ by $\Delta St_D\simeq 0.2$ and 5 %–24 % in absolute and relative values and can be higher or lower. Looking at the results available in the literature for jets at $M=0.90$ with untripped boundary layers simulated by LES, small peaks can be seen in the hump associated with the Kelvin–Helmholtz instability waves in the spectra obtained on the nozzle-lip line around the position of the shear-layer rolling-up in Bogey & Bailly (Reference Bogey and Bailly2010) and Bogey et al. (Reference Bogey, Marsden and Bailly2012) and at $z=r_0$ in Brès et al. (Reference Brès, Jordan, Jaunet, Le Rallic, Cavalieri, Towne, Lele, Colonius and Schmidt2018). Distinct peaks can also be found in the experimental spectra of Husain & Hussain (Reference Husain and Hussain1979) and of Drubka & Nagib (Reference Drubka and Nagib1981) and Drubka et al. (Reference Drubka, Reisenthel and Nagib1989) for jets at low velocities $u_j\leq 30$ m s $^{-1}$. In particular, Drubka et al. (Reference Drubka, Reisenthel and Nagib1989) noted two peaks at frequencies differing by approximately 20 % and attributed them to the axisymmetric and the helical modes, respectively. They explained their origin by the fact that the maximum growth rates of instability waves in their jets may occur at different frequencies for these two modes according to the work of Mattingly & Chang (Reference Mattingly and Chang1974). The last assertion is, however, not true for the present jets.
The full spectra and the contributions of the first three azimuthal modes are plotted together in figure 7(a–e). The most unstable frequencies obtained at  $z=50 \delta _{\theta }(0)$ using linear stability analysis are also indicated. In all cases, strong peaks appear in the vicinity of the most unstable frequency. As in Drubka et al. (Reference Drubka, Reisenthel and Nagib1989), the peaks in the full signal can be associated with specific azimuthal modes. Nevertheless, it is difficult to establish links between the peaks and the mode number. The dominant and second strongest peaks in the spectra, for instance, are related to different modes depending on the boundary-layer thickness. For $\delta _{BL}=0.4r_0$ and $\delta _{BL}=0.2r_0$, they correspond to the first peaks for $n_{\theta }=1$ and $n_{\theta }=0$ in figure 7(a,b). In contrast, for $\delta _{BL}=0.1r_0$, they consist of a combination of the first peaks for $n_{\theta }=0$ and 2 and of the first peak for $n_{\theta }=1$ in figure 7(c). Finally, for $\delta _{BL}=0.05r_0$ and $\delta _{BL}=0.025r_0$, they coincide with the first peaks for $n_{\theta }=2$ and $n_{\theta }=1$ in figure 7(d,e).

Figure 7. Power spectral densities of radial velocity fluctuations at  $r=r_0$ and $z=100 \delta _{\theta }(0)$ for the jets at $M=0.90$ with (a) $\delta _{BL}=0.4r_0$, (b) $\delta _{BL}=0.2r_0$, (c) $\delta _{BL}=0.1r_0$, (d) $\delta _{BL}=0.05r_0$ and (e) $\delta _{BL}=0.025r_0$ as a function of $St_D$: (black) full spectra, (red) $n_{\theta }=0$, (blue) $n_{\theta }=1$ and (green) $n_{\theta }=2$; – – – most unstable frequencies at $z=50 \delta _{\theta }(0)$ for $n_{\theta }=0$.
To assess the nature of the different components in the spectra, the power gains obtained by computing the ratios of the power spectral densities of radial velocity fluctuations at  $r=r_0$, between $z=75 \delta _{\theta }(0)$ and $z=25 \delta _{\theta }(0)$ for the four jets with $\delta _{BL}\geq 0.05r_0$ and between $z=100 \delta _{\theta }(0)$ and $z=50 \delta _{\theta }(0)$ for $\delta _{BL}=0.025r_0$, are represented in figure 8(a–e) as a function of $St_D$ for $n_{\theta }=1$, 2 and 3. The positions are chosen arbitrarily so that the first ones are not too close to the nozzle lip, where velocity is nil, and that the second are not too far in order to cover regions where instability waves can be expected to grow exponentially. For all jets, the curves for the three modes are very similar and exhibit a hump shape with a maximum value near the most unstable frequency at $z=50 \delta _{\theta }(0)$. They are in good or excellent agreement with the power gains calculated by integrating the amplification rates obtained using linear stability analysis between the two limit positions considered (Tam, Chen & Seiner Reference Tam, Chen and Seiner1992). Overall, the gains are slightly lower in the LES, which can be attributed to the fact that viscous effects are not taken into account in the stability analysis. Higher gains can also be found in the LES at low frequencies in figure 8(a,b), which may be due to the presence of nonlinear effects. Despite these small discrepancies, the present results clearly indicate that the broadband hump and the narrow peaks in the velocity spectra at $z=100 \delta _{\theta }(0)$ are both related to instability waves developing in the shear layers. This implies, in particular, that the peaks are not footprints of guided jet waves superposed onto broadband instability wave components.

Figure 8. Power gains obtained from the radial velocity fluctuations at  $r=r_0$ at $z=25 \delta _{\theta }(0)$ and $z=75 \delta _{\theta }(0)$ for (a) $\delta _{BL}=0.4r_0$, (b) $\delta _{BL}=0.2r_0$, (c) $\delta _{BL}=0.1r_0$ and (d) $\delta _{BL}=0.05r_0$, and at $z=50 \delta _{\theta }(0)$ and $z=100 \delta _{\theta }(0)$ for (e) $\delta _{BL}=0.025r_0$, as a function of $St_D$: (red line) $n_{\theta }=0$, (blue line) $n_{\theta }=1$, (green line) $n_{\theta }=2$; – – – most unstable $St_D$ at $z=50 \delta _{\theta }(0)$ for $n_{\theta }=0$; amplification factors calculated from linear stability results: (red dashed line) $n_{\theta }=0$, (blue dashed line) $n_{\theta }=1$, (green dashed line) $n_{\theta }=2$.
To get further information on the shear-layer disturbances next to the nozzle, frequency–wavenumber spectra have been computed from the pressure fluctuations at  $r=r_0$ between $z=0$ and $z=150 \delta _{\theta }(0)$. The spectra obtained for the jets with $\delta _{BL}\geq 0.05r_0$ for modes $n_{\theta }=1$, 2 and 3 are displayed as a function of $k$ and $St_D$ in figure 9(a–c) for $\delta _{BL}=0.2r_0$, in figure 9(d–f) for $\delta _{BL}=0.1r_0$ and in figure 9(g–i) for $\delta _{BL}=0.05r_0$. In all cases, multiple spots of high energy are found roughly between the lines $k=\omega /u_j$ and $k=\omega /(0.5u_j)$. In contrast, no significant levels appear in the parts of the spectra with $k\leq 0$, not shown for a better readability of the figures. This demonstrates again that the strongest nozzle-lip line fluctuations near $z=100 \delta _{\theta }(0)$ are associated with Kelvin–Helmholtz instability waves travelling in the downstream direction. Interestingly, these waves do not necessarily appear at the shear-layer most unstable frequencies, represented in red, but in all cases at frequencies inside or near the allowable frequency bands of the free-stream upstream-propagating guided jet waves, depicted by green hatches. This suggests that the instability waves dominating initially in the jet mixing layers emerge at the frequencies of the latter waves, hence that they are excited by these waves. Given that the amplitude of the instability waves downstream of $z=25 \delta _{\theta }(0)$ or $z=50 \delta _{\theta }(0)$ increases in accordance with the linear stability theory in figure 8, it is most likely that this coupling mainly occurs right after the nozzle lip.

Figure 9. Frequency–wavenumber spectra of pressure fluctuations at  $r=r_0$ and $0 \leq z \leq 150 \delta _{\theta }(0)$ for (a–c) $\delta _{BL}=0.2r_0$, (d–f) $\delta _{BL}=0.1r_0$ and (g–i) $\delta _{BL}=0.05r_0$ for (a,d,g) $n_{\theta }=0$, (b,e,h) $n_{\theta }=1$ and (c, f,i) $n_{\theta }=2$ as a function of $(kD,St_D)$; (black dashed lines) $k=\omega /u_j$ and $k=\omega /(0.5u_j)$, from left to right; (red dashed line) most unstable frequencies at $z=50 \delta _{\theta }(0)$; (green hatched) frequency ranges of the free-stream upstream-propagating guided jet waves. The grey scale levels spread over 18 dB.
The Strouhal numbers of the two strongest peaks obtained in the radial velocity spectra at  $r=r_0$ and $z=100 \delta _{\theta }(0)$ for the modes $n_{\theta }=0$, 1 and 2 are represented in figure 10(a–c) as a function of $\delta _{BL}/r_0$. The most unstable frequencies at $z=50 \delta _{\theta }(0)$ and the allowable frequency bands of the free-stream upstream-propagating guided jet waves are also shown. For the three azimuthal modes, for the four jets with $\delta _{BL}\geq 0.05r_0$, the first two peaks in the spectra are located on either side of the most unstable frequency, with the dominant peak being the one that is closest to that frequency. This is also nearly the case for $\delta _{BL} = 0.025r_0$. Moreover, except for the dominant peak for $\delta _{BL} = 0.4r_0$ in figure 10(a) for mode $n_{\theta }=0$, the peaks lie inside or next to the frequency bands of the guided jet waves. They move to higher radial modes as the jet boundary-layer thickness decreases, up to the modes $n_r=8$ for $n_{\theta }=0$ and 7 for $n_{\theta }=1$ and 2 for $\delta _{BL}=0.025r_0$ for example. These results reinforce the above findings that the presence of narrow peaks in the spectra results from the forcing of the shear-layer instability waves by the free-stream upstream-propagating guided jet waves at the specific frequencies of the latter. They also support that the peak levels depend on the instability growth rates at these frequencies. As a result, downstream of the nozzle, the strongest peaks emerge at frequencies similar, but not always identical, to the most unstable frequency. Finally, it can be recalled that, for jets at a Mach number of 0.90, the duct-like upstream-propagating guided jet waves can exist over wide ranges of frequencies, notably outside the allowable ranges of the free-stream upstream-propagating guided jet waves, refer to the dispersion curves in figure 20(b) of Appendix A for instance. Therefore, the near absence of peaks between the grey bands in figure 10(a–c) reveals that these waves of negligible amplitude on the nozzle-lip line play a minor role in the generation of the Kelvin–Helmholtz instability waves in the present jets.

Figure 10. Peak Strouhal numbers in the spectra of radial velocity fluctuations at  $r=r_0$ and $z=100 \delta _{\theta }(0)$ for (a) $n_{\theta }=0$, (b) $n_{\theta }=1$ and (c) $n_{\theta }=2$ as a function of $\delta _{BL}/r_0$: $\bullet$ dominant and $\circ$ second strongest peaks; (grey) frequency ranges of the free-stream upstream-propagating guided jet waves; – – – most unstable frequencies at $z=50 \delta _{\theta }(0)$.
The Strouhal numbers  $St_{\theta }=f\delta _{\theta }(z=0)/u_j$ and the amplitudes of the dominant peaks in the spectra of radial velocity for $n_{\theta }=0$, 1 and 2 are plotted in figure 11(a,b) as a function of $\delta _{BL}/r_0$. The results for the five jets exhibit strong disparities in terms of magnitude and azimuthal distribution, which cannot be easily linked to the value of $\delta _{BL}/r_0$. For a given jet, in figure 11(a), the peak frequencies obtained for the three azimuthal modes can appreciably differ. This is the case, for instance, for the jet with $\delta _{BL}=0.1r_0$ for which the peak Strouhal numbers range between $St_{\theta }=0.012$ and $0.015$. This is due to the fact that the peaks in the shear-layer spectra occur at the frequencies of the free-stream upstream-propagating guided jet waves, which are not the same for the three modes. In figure 11(b), the peak levels also vary significantly with the mode number. This appears for example for the jet with $\delta _{BL}=0.2r_0$, for which the peak level for $n_{\theta }=2$ is nearly one order of magnitude lower than those for $n_{\theta }=0$ and 1. One reason for that is the fact that the peak levels are related to the growth rates of the instability waves. Thus, overall, the closer the frequency of a peak to the frequency of the maximum growth rate, the more prominent the peak in the shear layers developing downstream of the nozzle, regardless of the azimuthal mode number.

Figure 11. Representation of (a) the Strouhal numbers  $St_{\theta }$ and (b) the levels of the dominant peaks in the radial velocity spectra at $r=r_0$ and $z=100 \delta _{\theta }(0)$ for (red circle) $n_{\theta }=0$, (blue circle) $n_{\theta }=1$ and (green circle) $n_{\theta }=2$ as a function of $\delta _{BL}/r_0$.
Given the uncertainties related to the use of a vortex-sheet model to characterize the guided jet waves in the present jets with shear layers of finite thickness, further evidence of the presence of interactions between instability waves and free-stream upstream-propagating guided jet waves belonging to the radial modes associated with the bands in figures 9 and 10 are sought. For that purpose, power spectral densities of pressure and velocity fluctuations obtained at the peak frequencies in the shear-layer velocity spectra are presented. Indeed, standing-wave patterns are likely to appear in these fields in case of interferences between waves travelling in opposite directions, as in screeching jets (Panda Reference Panda1999) and impinging jets (Bogey & Gojon Reference Bogey and Gojon2017), for instance. For a given frequency  $f$, the wavenumber of the standing wave is $k_{sw}=k_{u}+k_{d}$, where $k_{u}=2{\rm \pi} f/v_{\varphi }^{u}$ and $k_{d}=2{\rm \pi} f/v_{\varphi }^{d}$ are the wavenumbers of the upstream- and downstream-propagating waves and $v_{\varphi }^{u}$ and $v_{\varphi }^{d}$ are their phase velocities, in absolute values. The wavelength of the standing wave $\lambda _{sw}=2{\rm \pi} /k_{sw}$ is then
 \begin{equation} \lambda_{sw} = \frac{D}{St_D(u_j/v_{\varphi}^{u}+u_j/v_{\varphi}^{d})} ,\end{equation}
and can be rewritten, when the phase velocity  $v_{\varphi }^{u}$ of the upstream-propagating wave is equal to the ambient speed of sound $c_0$, for a sound wave for instance, in the form
 \begin{equation} \lambda_{sw} = \frac{D}{St_D(M+u_j/v_{\varphi}^{d})}.\end{equation}
 For any standing wave, the wavelength  $\lambda _{sw}$ should ideally be obtained with (3.1) by taking, for $v_{\varphi }^{u}$ and $v_{\varphi }^{d}$, the phase velocities that can be directly accessed from frequency–wavenumber spectra. Unfortunately, the poor resolution and the broadness of the spectra along the wavenumber axis, appearing clearly in figures 3 and 9, do not allow for an accurate estimation of these velocities. Consequently, approximate values will be used in what follows. This is in particular true for a standing wave generated by free-stream upstream-propagating guided jet waves and Kelvin–Helmholtz instability waves. In that case, noting that the strongest free-stream upstream-propagating guided jet waves are found near the stationary points $S_{max}$ of the dispersion curves of the guided jet waves (Bogey Reference Bogey2021a), the phase velocities predicted by the vortex-sheet model at these points will be employed for $v_{\varphi }^{u}$. They are somewhat lower than $c_0$. For $v_{\varphi }^{d}$, the phase velocities of the most-amplified instability waves determined from the mean flow profiles at $z=50 \delta _{\theta }(0)$ in § 3.3.1 and represented in figure 4(c), will be considered. They are close to $0.5u_j$. These approximations appear reasonable given the frequency–wavenumber spectra of figures 3 and 9, even if the most energetic guided jet waves and instability waves are located just to the left of the points $S_{max}$ and of the line $k=\omega /(0.5u_j)$, respectively, yielding slightly lower values for $v_{\varphi }^{u}$ and higher ones for $v_{\varphi }^{d}$.
The spectral densities of pressure fluctuations obtained at the dominant frequencies in the radial velocity spectra at  $r=r_0$ and $z=100 \delta _{\theta }(0)$ for the four jets with $\delta _{BL}\leq 0.2r_0$ are represented in figure 12(a–d) for mode $n_{\theta }=0$, in figure 12(e–h) for $n_{\theta }=1$ and in figure 12(i–l) for $n_{\theta }=2$. In all cases, the strongest levels are found in the shear layer where vortical structures form just downstream of the nozzle due to the growth of Kelvin–Helmholtz instability waves. In the potential core, significant levels also clearly appear, organized into stripes elongated in the axial direction. The levels are, overall, higher near the jet axis than near the nozzle-lip line. At $r=0$, in particular, they exhibit maximum values for $n_{\theta }=0$ and minimum values for $n_{\theta }=1$ and 2. The number of stripes varies from case to case, and seems to be equal, for instance, to $2$ for $\delta _{BL}=0.2r_0$, $4$ for $\delta _{BL}=0.1r_0$, $6$ for $\delta _{BL}=0.05r_0$ and $8$ for $\delta _{BL}=0.025r_0$ in figure 12(a–d) for $n_{\theta }=0$. It agrees with the radial number $n_r$ of the guided jet modes in the bands of which the dominant frequencies visibly fall in figure 10(a–c). Therefore, the levels in the jet potential core can be attributed to the existence of free-stream upstream-propagating guided jet waves at the frequencies dominating in the shear-layer velocity spectra.

Figure 12. Power spectral densities of pressure fluctuations at the dominant frequencies in the radial velocity spectra at  $r=r_0$ and $z=100 \delta _{\theta }(0)$ for (a–d) $n_{\theta }=0$, (e–h) $n_{\theta }=1$ and (i–l) $n_{\theta }=2$, normalized by their peak values, for the jets with (a,e,i) $\delta _{BL}=0.2r_0$, (b, f,j) $\delta _{BL}=0.1r_0$, (c,g,k) $\delta _{BL}=0.05r_0$ and (d,h,l) $\delta _{BL}=0.025r_0$. The colour scale levels range logarithmically from $10^{-7}$ to 2, from blue to red.
Periodically spaced spots are also observed on both sides of the shear layer in all cases. They look like standing-wave patterns resulting from interferences between upstream- and downstream-propagating waves, as mentioned above. The standing-wave wavelength decreases for a thinner nozzle-exit boundary layer.
At the inner edge of the shear layer, where the contributions of the guided jet waves and of the Kelvin–Helmholtz instability waves predominate, the standing-wave wavelength is approximately of  $\lambda _{sw}=0.53r_0$ for $\delta _{BL}=0.2r_0$, $0.23r_0$ for $\delta _{BL}=0.1r_0$, $0.16r_0$ for $\delta _{BL}=0.05r_0$ and $0.12r_0$ for $\delta _{BL}=0.025r_0$ for mode $n_{\theta }=0$, for instance. These wavelengths are significantly shorter than the wavelengths of $\lambda _{sw}\simeq 0.87r_0$, $0.43r_0$, $0.28r_0$ and $0.21r_0$ expected for a resonance occurring between downstream- and upstream-propagating guided jet waves inside the potential core (Schmidt et al. Reference Schmidt, Towne, Colonius, Cavalieri, Jordan and Brès2017; Towne et al. Reference Towne, Cavalieri, Jordan, Colonius, Schmidt, Jaunet and Brès2017), around the stationary points S $_{max}$ (or saddle points S2) of the dispersion curves of the guided jet waves, illustrated in Appendix A. The latter values are calculated from the wavenumbers given by the vortex-sheet model at the points $S_{max}$ for the guided jet modes $n_{\theta }=0$ and $n_r=2$, 4, 6 and 8 according to the numbers of the bands associated with the dominant peaks in figure 10(a). On the contrary, the standing-wave wavelengths in figure 12(a–d) are comparable to the wavelengths of $\lambda _{sw}=0.59r_0$, $0.28r_0$, $0.19r_0$ and $0.14r_0$, predicted by (3.1) using $v_{\varphi }^{u}=v_{\varphi }(S_{max})$ and $v_{\varphi }^{d}\simeq 0.5u_j$, as explained above. These results support the presence of interactions between Kelvin–Helmholtz instability waves and free-stream upstream-propagating guided jet waves. The differences in wavelength between the LES and the model may be due to the approximations made for $v_{\varphi }^{u}$ and $v_{\varphi }^{d}$. It has been, however, checked that the wavelength $\lambda _{sw}$ does not change much as $v_{\varphi }^{u}$ and $v_{\varphi }^{d}$ vary a little.
It can be pointed out that, compared with those at the inner edge of the shear layer, the standing-wave wavelengths at the outer edge are not necessarily identical. For the three jets with  $\delta _{BL}\leq 0.1r_0$, in particular, they appear shorter in the vicinity of the nozzle. In addition, they seem to increase in the axial direction as they are located farther from the mixing layer. These trends may be attributed to the fact that the standing waves outside the jet potential core involve sound waves propagating upstream at different velocities according to the radial distance. These waves can indeed be expected to travel at a velocity well below $c_0$ near $r=r_0$, but close to $c_0$ farther from the nozzle-lip line, providing shorter standing waves in the first case and larger ones in the second with respect to the standing waves due to free-stream guided jet waves whose phase velocities are slightly lower than $c_0$.
The spectral densities of the pressure fluctuations obtained for  $n_{\theta }=0$ for the jet with $\delta _{BL}=0.1r_0$, shown in figure 12(b), are plotted again in figure 13(a), along with those computed from the radial and axial velocity fluctuations in figure 13(b,c). Four stripes appear in the jet potential core and standing waves of similar wavelength are visible in the three figures. Thus, the presence of free-stream upstream-propagating guided jet waves and their interactions with the Kelvin–Helmholtz instability waves can be detected on the three flow fields. The maximum and minimum values are, however, not located at the same positions for the pressure and axial velocity in figure 13(a,c) and for the radial velocity in figure 13(b). On the jet axis, in particular, local maximum values are found in the first two cases, whereas minimum values are seen in the third one.

Figure 13. Power spectral densities of the fluctuations of (a) pressure, (b) radial velocity and (c) axial velocity at  $St_D=2.34$ for $n_{\theta }=0$, normalized by their peak values, for the jet at $M=0.90$ with $\delta _{BL}=0.1r_0$. The colour scale levels range logarithmically from $10^{-7}$ to 2, from blue to red.
Concerning the jet with  $\delta _{BL}=0.4r_0$, the power spectral densities of the pressure and radial velocity fluctuations obtained for $n_{\theta }=0$ at the two peak frequencies reported in figure 10(a) are shown in figure 14(a–d). For $St_D=0.484$, in figure 14(a,b), strong levels are observed in the potential core from $r=0$ to $r=r_0$, with no local minimum values in the pressure fields in figure 14(a). Standing-wave patterns of wavelength $\lambda _{sw} \simeq 1.25r_0$ can also be seen outside of the jet. This wavelength in very good agreement with the value of $\lambda _{sw}=1.27r_0$ obtained using (3.1) with $v_{\varphi }^{u}=v_{\varphi }(S_{max})$ for $n_{\theta }=0$ and $n_r=1$ and $v_{\varphi }^{d}= 0.48u_j$, that is the phase velocity of the most-amplified instability wave at $z=50 \delta _{\theta }(0)$. These features are indicative of free-stream upstream-propagating guided jet waves belonging to the first radial guided jet mode and of their interferences with the shear-layer instability waves. They are not surprising given that the value of $St_D=0.484$ is near the upper bound of the frequency range of these guided jet waves according to the vortex-sheet model.

Figure 14. Power spectral densities of the fluctuations of (a,c) pressure and (b,d) radial velocity at (a,b)  $St_D=0.484$ and (c,d) $St_D=0.62$ for $n_{\theta }=0$, normalized by their peak values, for the jet with $\delta _{BL}=0.4r_0$. The colour scale levels range logarithmically from $10^{-8}$ to 1, from blue to red.
For  $St_D=0.62$, in figure 14(c,d), high levels are also found in the potential core and standing-wave patterns appear on either side of the shear layer with wavelengths approximately of $\lambda _{sw}= 0.33r_0$ in the jet and $\lambda _{sw}=0.95r_0$ outside. Inside the jet, in the vicinity of the nozzle, the levels are very weak near the nozzle-lip line in both pressure and radial velocity fields. Therefore, the significant levels in the potential core can only result from duct-like guided jet waves. Despite of the very thick nozzle-exit boundary layer, this result is in line with the prediction of the vortex-sheet model that free-stream guided jet waves do not exist at $St_D=0.62$ for $n_{\theta }=0$. Regarding the duct-like guided jet waves, according to the dispersion curves shown in figure 20(b) for a vortex sheet, they can only be upstream-propagating waves of the first radial guided jet mode, with a wavenumber near $kD=-31.4$ yielding a phase velocity $v_{\varphi }=0.11c_0$. Outside the flow, given the absence of free-stream guided jet waves at the frequency considered, the upstream-propagating waves are necessarily sound waves travelling at a velocity close to $c_0$. Considering the above, $v_{\varphi }^{u}=0.11c_0$ and $v_{\varphi }^{u}=c_0$ are used in (3.1) with $v_{\varphi }^{d}=0.48c_0$ as previously, which provides $\lambda _{sw}=0.32r_0$ and $\lambda _{sw}=1.07r_0$. These values are consistent with the standing-wave wavelengths on the two sides of the mixing layer. The instability waves developing in the shear layer at $St_D=0.62$ thus appear to interact with duct-like guided jet waves inside the jet flow and sound waves outside. Although possibly less initially excited than those at $St_D=0.484$, they predominate at $z=100 \delta _{\theta }(0)$ because their frequency corresponds to that of the maximum instability growth rate as illustrated in figure 7(a).
3.3.3. Results for the jets at Mach numbers between 0.5 and 2
The development of instability waves in the jets at Mach numbers varying between 0.5 and 2 is now studied and analysed in light of the findings of the previous section. Spectra of radial velocity fluctuations computed at  $r=r_0$ and $z=z_{turb10\,\%}$ for the jets at $M=0.70$, 1.10 and 1.60 with different boundary-layer thicknesses are represented as a function of $St_D$ in figure 15(a) for $\delta _{BL}=0.2r_0$, in figure 15(b) for $\delta _{BL}=0.1r_0$ and in figure 15(c) for $\delta _{BL}=0.05r_0$. For clarity, only three Mach numbers are considered, as in figure 23 of Appendix B providing acoustic spectra obtained at $z=0$ and $r=1.5r_0$. These three values are chosen to illustrate the results for a subsonic Mach number below $M=0.90$ and two supersonic Mach numbers respectively close to $M=1$ and well above. For all jets, as for the jets at $M=0.90$ in figure 6(a), the velocity spectra show a broadband hump and several narrow peaks associated with growing Kelvin–Helmholtz instability waves. The hump moves to lower Strouhal numbers with increasing Mach number, which is in line with the linear stability analysis conducted in § 3.3.1. Regarding the peaks, they appear more clearly at $M=1.10$ than at $M=0.70$ and 1.60. At $M=1.10$, they are most tonal for the jet with $\delta _{BL}=0.1r_0$ in figure 15(b). These trends are consistent with those noted for the peaks in the near-nozzle pressure spectra in Appendix B, including, in particular, the emergence of weak screech tones for the jet mentioned above.

Figure 15. Power spectral densities of radial velocity fluctuations at  $r=r_0$ and $z=z_{turb10\,\%}$ for the jets with (a) $\delta _{BL}=0.2r_0$, (b) $\delta _{BL}=0.1r_0$ and (c) $\delta _{BL}=0.05r_0$ at $M=$ (black) 0.70, (red) 1.10 and (blue) 1.60.
The Strouhal numbers  $St_D$ and the levels of the dominant peaks in the spectra of radial velocity fluctuations at $r=r_0$ and $z=z_{turb10\,\%}$ are plotted in figures 16(a–c) and 16(d–f), respectively, as a function of the Mach number. The results obtained in figures 16(a,d), 16(b,e) and 16(c, f) for the three boundary-layer thicknesses look like each other. In figure 16(a–c), the peak Strouhal numbers do not change much from $M = 0.50$ up to $M \simeq 1$ and then significantly decrease with the jet velocity. They agree well with the most unstable frequencies predicted at $z=z_{turb10\,\%}/2$ by the linear stability analysis over the entire Mach number range. However, they do not vary monotonically and show noticeable oscillations around the theoretical curves, especially for the jets with $\delta _{BL}= 0.2r_0$ and $\delta _{BL}= 0.1r_0$ at $M \leq 1.20$. Similar oscillations are observed in figure 16(d–f) as the peak levels decrease, in average, with the Mach number.

Figure 16. Mach number variations of (a–c) the Strouhal numbers  $St_D$ and (d–f) the levels of the dominant peaks in the radial velocity spectra at $r=r_0$ and $z=z_{turb10\,\%}$ for the jets with (a,d) $\delta _{BL}=0.2r_0$, (b,e) $\delta _{BL}=0.1r_0$ and (c, f) $\delta _{BL}=0.05r_0$; – – – most unstable frequencies at $z=z_{turb10\,\%}/2$ for $n_{\theta }=0$.
To clarify the origin of these oscillations, the spectra of radial velocity fluctuations calculated for the jets with  $\delta _{BL}=0.2r_0$ are presented in figure 17(a) as a function of the Mach number using logarithmic scales. They are normalized by their respective peak values, yielding a maximum value of 1 for each jet. The contributions of the azimuthal modes $n_{\theta }=0$ and $1$ to the spectra are displayed in figure 17(b,c). Well-organized peaks, forming separate bands with central Strouhal numbers decreasing with the Mach number, emerge distinctly in the spectrograms. The bands resemble those found in the pressure spectra obtained near the nozzle of jets at varying Mach numbers in the experiments of Jaunet et al. (Reference Jaunet, Jordan, Cavalieri, Towne, Colonius, Schmidt and Brès2016) and Zaman et al. (Reference Zaman, Fagan and Upadhyay2022) and in the LES of Bogey (Reference Bogey2021a). However, contrary to the near-nozzle bands which extend from $M\simeq 0.60$ up to $M=2$ in the latter study, they only cover limited Mach number ranges and show discontinuities and energy jumps from one band to another. This staging behaviour is similar to that exhibited by the screech modes in supersonic shock-containing jets (Raman Reference Raman1998), establishing in the allowable frequency bands of the free-stream upstream-propagating guided jet waves (Edgington-Mitchell et al. Reference Edgington-Mitchell, Jaunet, Jordan, Towne, Soria and Honnery2018; Gojon et al. Reference Gojon, Bogey and Mihaescu2018; Mancinelli et al. Reference Mancinelli, Jaunet, Jordan and Towne2019).

Figure 17. Power spectral densities of (a) radial velocity fluctuations at  $r=r_0$ and $z=z_{turb10\,\%}$, normalized by their peak values, and contributions of modes (b) $n_{\theta }=0$ and (c) $n_{\theta }=1$, for the jets with $\delta _{BL}=0.2r_0$ as a function of $(M,St_D)$. The grey scale levels range logarithmically from $10^{-2}$ to $10$.
$10$.
The Strouhal numbers  $St_D$ of the dominant and second strongest peaks in the spectra of radial velocity fluctuations at $z=z_{turb10\,\%}$ in the shear layers of the jets with $\delta _{BL}=0.2r_0$, $0.1r_0$ and $0.05r_0$ are depicted as a function of the Mach number in figure 18(a–c) for $n_{\theta }=0$ and in figure 18(d–f) for $n_{\theta }=1$. The most unstable frequencies at $z=z_{turb10\,\%}/2$ and the frequency bands of the free-stream upstream-propagating guided jet waves according to the vortex-sheet model are also indicated. As observed in figure 10 for the jets at $M= 0.90$, apart from a few exceptions which will be discussed below, the peaks fall in or very near the bands of the guided jet waves and, for a given jet and azimuthal mode, the dominant peak is the one located closest to the most unstable frequency. These results further support the assertion that the free-stream upstream-propagating guided jet waves excite the instability waves in initially laminar jets at their allowable frequencies, which do not necessarily match the most unstable frequency of the jet shear layer, and that this generates peaks in the velocity spectra whose levels depend on the instability growth rates at these frequencies. Consequently, the Strouhal number of the dominant peak varies strongly and sometimes sharply with the jet velocity. As the Mach number increases, the peak Strouhal number decreases gradually as it remains in the frequency band of a particular radial guided jet mode until it deviates too much from the most unstable frequency and jumps to a higher or a lower radial mode. For instance, in figure 18(b), the dominant peak frequency obtained for the jets with $\delta _{BL}=0.1r_0$ for the axisymmetric mode is in the band of the guided jet mode $n_r=2$ for $M = 0.50$ and switches to the bands of modes $n_r=3$ for $M = 0.70$, $n_r=4$ for $M = 1.10$, $n_r=5$ for $M = 1.60$, $n_r=4$ for $M = 1.80$ and $n_r<4$ for $M = 1.90$. For a thicker boundary layer, fewer bands are crossed by the curve representing the most unstable frequencies, leading to a smaller number of mode jumps but also to larger discrepancies between the dominant peak frequency and the most unstable frequency and to higher jumps, in relative values. A strong change in the dominant peak frequency thus happens, for example, between $M = 0.85$ and 0.90 in figure 18(d) for the jets with $\delta _{BL}=0.2r_0$ for the mode $n_{\theta }=1$.

Figure 18. Mach number variations of the peak Strouhal numbers in the spectra of radial velocity fluctuations at  $r=r_0$ and $z=z_{turb10\,\%}$ for (a–c) $n_{\theta }=0$ and (d–f) $n_{\theta }=1$, for (a,d) $\delta _{BL}=0.2r_0$, (b,e) $\delta _{BL}=0.1r_0$ and (c, f) $\delta _{BL}=0.05r_0$: $\bullet$ dominant and $\circ$ second strongest peaks; (grey) frequency ranges of the free-stream upstream-propagating guided jet waves; – – – most unstable frequencies at $z=z_{turb10\,\%}/2$.
Regarding the few peaks which do not lie in the grey bands and hence cannot be related to free-stream upstream-propagating guided jet waves, two particular cases can be highlighted. In the first case, the peaks correspond to the harmonics of the dominant peaks, as can be seen in figure 18(d) for  $M = 0.55$ and $M = 0.80$, for example. In the second case, encountered in figure 18(a) for $0.60 \leq M \leq 0.70$ and $M = 0.95$, for instance, the peaks are located well outside the bands but very close to the most unstable frequency. As was explained for the peak at $St_D=0.62$ for the jet with $\delta _{BL}=0.4r_0$ at the end of previous section, they are most likely due to the fact that the growth rates of the instability waves are so low at the frequencies of the free-stream upstream-propagating guided jet waves that instability waves emerge not only at some of these frequencies but also at the frequency of maximum growth rate.
To exhibit again the staging behaviour of the instability waves dominating in the shear layers due to the coupling with the free-stream upstream-propagating guided jet waves, the Strouhal numbers  $St_{\theta }=f\delta _{\theta }(0)/u_j$ and the levels of the strongest peaks in the velocity spectra at $r=r_0$ and $z=z_{turb10\,\%}$ for $n_{\theta }=0$ and 1 are plotted in figures 19(a–c) and 19(d–f) as a function of $M$. Notable oscillations and discontinuities appear for all jets and azimuthal modes, but they are more marked for a thicker boundary layer and for Mach numbers below $M \simeq 1.10$ than above. They lead to significant and sudden variations of both the peak Strouhal numbers $St_{\theta }$ and of the predominant azimuthal mode. Thus, for the jets with $\delta _{BL}=0.2r_0$, as the Mach number increases from $M = 0.50$ up to 1.20, the peak Strouhal numbers range between $St_{\theta }=0.009$ and 0.018, and the predominant azimuthal mode is the mode $n_{\theta }=0$ up to $M = 0.55$ and then $n_{\theta }=1$ up to $M = 0.75$, again $n_{\theta }=0$ up to $M = 0.85$ and then $n_{\theta }=1$ up to $M = 1.10$ and finally $n_{\theta }=0$. These results provide an explanation for the strong scatter of the Strouhal numbers $St_{\theta }$ of the initial instability waves obtained experimentally for jets with laminar nozzle-exit conditions pointed out in Gutmark & Ho (Reference Gutmark and Ho1983). They also show that it is difficult, if not impossible, to predict a priori which azimuthal mode will predominate in the shear layers of these jets (Drubka et al. Reference Drubka, Reisenthel and Nagib1989).

Figure 19. Mach number variations of (a–c) the Strouhal numbers  $St_{\theta }$ and (d–f) the levels of the dominant peaks in the spectra of radial velocity fluctuations at $r=r_0$ and $z=z_{turb10\,\%}$ for (red) $n_{\theta }=0$ and (blue) $n_{\theta }=1$ for the jets with (a,d) $\delta _{BL}=0.2r_0$, (b,e) $\delta _{BL}=0.1r_0$ and (c, f) $\delta _{BL}=0.05r_0$.
4. Conclusion
In this paper, the near-nozzle interactions between upstream-propagating guided jet waves and shear-layer Kelvin–Helmholtz instability waves have been investigated for isothermal round free jets with laminar nozzle-exit boundary layers of different thicknesses over a wide range of Mach numbers using LES. The Mach numbers range between 0.50 and 2, and for the supersonic ones, the jets are nearly perfectly expanded at the nozzle exit. For all jets, intense narrow peaks associated with Kelvin–Helmholtz instability waves emerge in the velocity spectra in the mixing layers downstream of the nozzle near the location of the shear-layer rolling-up for the first azimuthal modes. The frequencies of the peaks are similar to that of the most amplified instability wave determined from the mean flow profiles using linear stability analysis. More unexpectedly, in most cases, they are shown to fall in or very near the frequency bands of the free-stream upstream-propagating guided jet waves predicted using a vortex-sheet model. Standing-wave patterns are also found in the power spectral densities of pressure and velocity fluctuations at these frequencies at the edges of the jet shear layers. Therefore, in initially laminar free jets containing no shocks, the free-stream upstream-propagating guided jet waves appear to excite the instability waves near the nozzle lip, in the same way as in impinging and screeching jets. Apart from a few rare exceptions when the shear-layer most unstable frequency is far from any frequency bands of the guided jet waves, this coupling governs the laminar–turbulent transition by imposing the frequency and the azimuthal structure of the instability wave dominating early on in the shear layers. It even leads to discontinuous changes in frequency and azimuthal mode with increasing Mach number, as encountered for the resonant modes of the jets mentioned above. In that case, the predominant instability wave is the one, among those excited by the free-stream upstream-propagating guided jet waves, with the highest amplification rate, regardless of its azimuthal mode number. Thus, its frequency is close but not necessarily identical to the frequency of the most amplified instability wave and its azimuthal structure cannot be known a priori. These results allow us to explain why the properties of the initial instability waves in laminar jets often differ from one experiment to another in the literature, as well as why they display a staging behaviour as the Mach number varies in the LES. In future studies, it will be interesting to investigate whether interactions between guided jet waves and Kelvin–Helmholtz instability waves also occur in free jets with highly disturbed nozzle-exit boundary layers.
Funding
This work was granted access to the HPC resources of PMCS2I (Pôle de Modélisation et de Calcul en Sciences de l'Ingénieur et de l'Information) of Ecole Centrale de Lyon, and P2CHPD (Pôle de Calcul Hautes Performances Dédiés) of Université Lyon I, and to the resources of CINES (Centre Informatique National de l'Enseignement Supérieur), IDRIS (Institut du Développement et des Ressources en Informatique Scientifique) and TGCC (Très Grand Centre de calcul du CEA) under the allocation 2021-2a0204 made by GENCI (Grand Equipement National de Calcul Intensif). It was performed within the framework of the LABEX CeLyA (ANR-10-LABX-0060) of Université de Lyon, within the program Investissements d'Avenir (ANR-16-IDEX-0005) operated by the French National Research Agency (ANR).
Declaration of interests
The author reports no conflict of interest.
Appendix A. Frequency bands of the free-stream upstream-propagating guided jet waves for a vortex-sheet model
The frequency bands of the free-stream upstream-propagating guided jet waves used in this work are defined in this first appendix. For that purpose, some characteristics of these waves in isothermal round jets at Mach numbers between 0.50 and 2 are presented using terms introduced in Towne et al. (Reference Towne, Cavalieri, Jordan, Colonius, Schmidt, Jaunet and Brès2017) and Bogey (Reference Bogey2021a). They are obtained from the dispersion relations and eigenfunctions of the guided jet waves predicted by a vortex-sheet model, following Tam & Hu (Reference Tam and Hu1989) and Morris (Reference Morris2010), among others. Since this model makes use of the assumption of an infinitely thin shear layer, differences can be expected with respect to the present LES results obtained for jets with mixing layers of finite width. They should, however, be small given the good agreement observed between the dispersion curves calculated for a vortex sheet and those computed in Tam & Ahuja (Reference Tam and Ahuja1990) for a Mach number 0.80 jet with a mixing-layer velocity profile of half-width equal to half of the jet radius and in Bogey (Reference Bogey2021a) for a tripped jet at  $M=0.90$ with $\delta _{\theta }=0.018r_0$. The limited effects of the shear-layer thickness on the guided jet waves are further supported by the fact that for the jets at $M=0.90$ with $0.025r_0 \leq \delta _{BL} \leq 0.4r_0$ considered in this study, the frequencies of the near-nozzle acoustic peaks, intrinsically linked with the free-stream upstream-propagating guided jet waves, do not vary appreciably with the boundary-layer thickness as shown in Bogey (Reference Bogey2021a).
The dispersion relations of the guided jet waves determined for the azimuthal modes  $n_{\theta }=0$ and $1$ at $M=0.70$, $0.90$ and $1.10$ are represented in figure 20(a–c) as a function of wavenumber $k$ and Strouhal number $St_D$. These Mach number values are chosen to illustrate the three types of results obtained, respectively, for subsonic Mach numbers below and above $M= 0.80$ and for supersonic Mach numbers. The guided jet waves are seen to exist only for specific values of $(k,St_D)$ and to belong to different radial modes, whose number $n_r\geq 1$ increases with the frequency. They propagate upstream when their group velocities $v_g={\rm d}\omega /{\rm d} k$ are negative and downstream when $v_g>0$, where $\omega =2{\rm \pi} f$. Thus, they can travel only in the upstream direction for $M=0.70$ but in both directions for $M=0.90$ and $1.10$. Particular points are marked on the dispersion curves in order to distinguish between various types of waves. These points are the limit points L on the line $k=-\omega /c_0$ for all Mach numbers, the stationary points S $_{max}$ associated with a local maximum where $v_g=0$ for $M=0.90$ and 1.10, corresponding to the saddle points S2 in Towne et al. (Reference Towne, Cavalieri, Jordan, Colonius, Schmidt, Jaunet and Brès2017), and the inflexion points I where ${\rm d} v_g/{\rm d} k=0$ for $M=0.70$. As proposed by the aforementioned authors, the dispersion curves of the acoustic modes in a cylindrical soft duct for $n_{\theta }=0$ and $1$ are also plotted. They allow us to identify two categories of guided jet waves, namely the duct-like waves and the free-stream waves. The duct-like waves, located roughly at the left of the points I or S $_{max}$ on the dispersion curves, are confined in the jet potential core, whereas the free-stream waves, at the right, have a non-negligible amplitude in the shear layer and outside the jet flow.

Figure 20. Dispersion relations of the guided jet waves obtained using a vortex-sheet model at (a)  $M=0.70$, (b) $M=0.90$ and (c) $M=1.10$ for (black lines) $n_{\theta }=0$ and (grey lines) $n_{\theta }=1$ as a function of $k$ and $St_D$; (black circles) L, (red circles) $S_{max}$ and (green circles) I; dispersion relations of the acoustic waves in a duct for (black dashed lines) $n_{\theta }=0$ and (grey dashed lines) $n_{\theta }=1$; – $\cdot$– $\cdot$ $k=\omega /(u_j-c_0)$; ${\cdot }{\cdot }{\cdot }{\cdot }{\cdot }$ $k=-\omega /c_0$. Only the waves with $k\leq 0$ are shown for $M=1.10$.
The duct-like or free-stream nature of the guided jet waves can be ascertained from the pressure eigenfunctions of the guided jet waves predicted by the vortex-sheet model (Tam & Hu Reference Tam and Hu1989). To this aim, for each radial mode, the amplitude of the guided waves determined at a given radial distance  $r\geq r_0$ can be plotted as a function of $St_D$. The results obtained in the shear layer at $r=r_0$, not shown for brevity, are very similar to those at $r=1.5r_0$ provided in Bogey (Reference Bogey2021a). For a given mode, for $M=0.90$ and $1.10$ for instance, the amplitude of the upstream-propagating waves outside the jet potential core is significant between points L and S $_{max}$ and falls to very low values, or even zero, above the frequency of $S_{max}$. For $M=0.70$, on the contrary, the wave amplitude decreases gradually and continuously with the frequency. However, the waves are strongest between point $L$ and the inflection point $I$. Therefore, the frequency bands of the free-stream upstream-propagating guided jet waves can be considered to extend between the frequencies of points $L$ and $S_{max}$ in the first two cases and between the frequencies of points $L$ and $I$ in the third one. The cutoffs at the band upper bounds $S_{max}$ and $I$ are sharp and smooth, respectively.
The allowable frequency bands of the free-stream upstream-propagating guided jet waves (Tam & Norum Reference Tam and Norum1992) can thus be specified. The bands predicted by the vortex-sheet model for isothermal jets between  $M=0.50$ and 2 for $n_{\theta }=0$, 1 and 2 are represented in figure 21(a–c) as a function of the Mach and the Strouhal number. It can be noted that they differ from those available in Bogey (Reference Bogey2021a) highlighting, using two shades of grey, the presence of upstream-propagating guided jet waves with or without downstream-propagating ones without taking into account their free-stream or duct-like natures. In figure 21, the bands of the free-stream upstream-propagating guided jet waves stand between points L and I for $M\lesssim 0.80$ and points L and $S_{max}$ for higher Mach numbers. At $M=0.50$, they are relatively broad and are found, except for the first axisymmetric mode, at $St_D>1.5$. For higher Mach numbers, they are narrower and decrease in Strouhal number. At a given jet velocity, in addition, they are smaller and appear at higher frequencies as the azimuthal mode number increases.

Figure 21. Mach number variations of (grey) the Strouhal number ranges of the free-stream upstream-propagating guided jet waves obtained using a vortex-sheet model for (a)  $n_{\theta }=0$, (b) $n_{\theta }=1$ and (c) $n_{\theta }=2$; points (black) L, (red) $S_{max}$ and (green) I on the dispersion curves.
Appendix B. Acoustic tones in the jet near-nozzle region
As shown by Towne et al. (Reference Towne, Cavalieri, Jordan, Colonius, Schmidt, Jaunet and Brès2017), Brès et al. (Reference Brès, Jordan, Jaunet, Le Rallic, Cavalieri, Towne, Lele, Colonius and Schmidt2018) and Bogey (Reference Bogey2021a), among others, the upstream-propagating guided jet waves generate peaks in the near-nozzle pressure spectra. The peaks are tonal above  $M\simeq 0.80$ and they are broader and weaker for lower Mach numbers. For the jets at $M=0.90$ and the jets with boundary-layer thickness $\delta _{BL}=0.2r_0$, their characteristics at $z=0$ and $r=1.5r_0$ are detailed in Bogey (Reference Bogey2021a). For the jets with $\delta _{BL}=0.1r_0$ and $\delta _{BL}=0.05r_0$, they are reported in this second appendix.
The Strouhal numbers of the strongest near-nozzle acoustic peaks obtained for the first two azimuthal modes for the jets with  $\delta _{BL}=0.2r_0$, $0.1r_0$ and $0.05r_0$ are represented in figures 22(a,d), 22(b,e) and 22(c, f) as a function of the Mach number. They are compared with the frequency bands of the free-stream upstream-propagating guided jet waves, defined in the previous appendix. In all cases, the peaks are located inside or very close to these bands, mostly near their upper limits. The dominant peaks lie near the bands of the first radial modes, except for $n_{\theta }=0$ at $M=1.10$ in figure 22(b) and at $M=1.20$ and $1.60$ in figure 22(c). The two exceptions at $M=1.10$ and 1.20 may be due to the generation of A-type screech tones (Edgington-Mitchell et al. Reference Edgington-Mitchell, Jaunet, Jordan, Towne, Soria and Honnery2018; Gojon et al. Reference Gojon, Bogey and Mihaescu2018), caused by the presence of weak shock cells in the jet core. For completeness, peaks can be noted at $St_D\simeq 0.70$ in figure 22(a,d) and $St_D\simeq 1$ in figure 22(e) for the jets at $M\simeq 0.50$ with $\delta _{BL}=0.2r_0$ and $0.1r_0$, respectively. As discussed in Bogey (Reference Bogey2021a), they seem to result from a feedback loop involving the Kelvin–Helmholtz instability waves and the upstream-propagating sound waves produced by the vortex pairings which happen in the initially laminar shear layers of the jets.
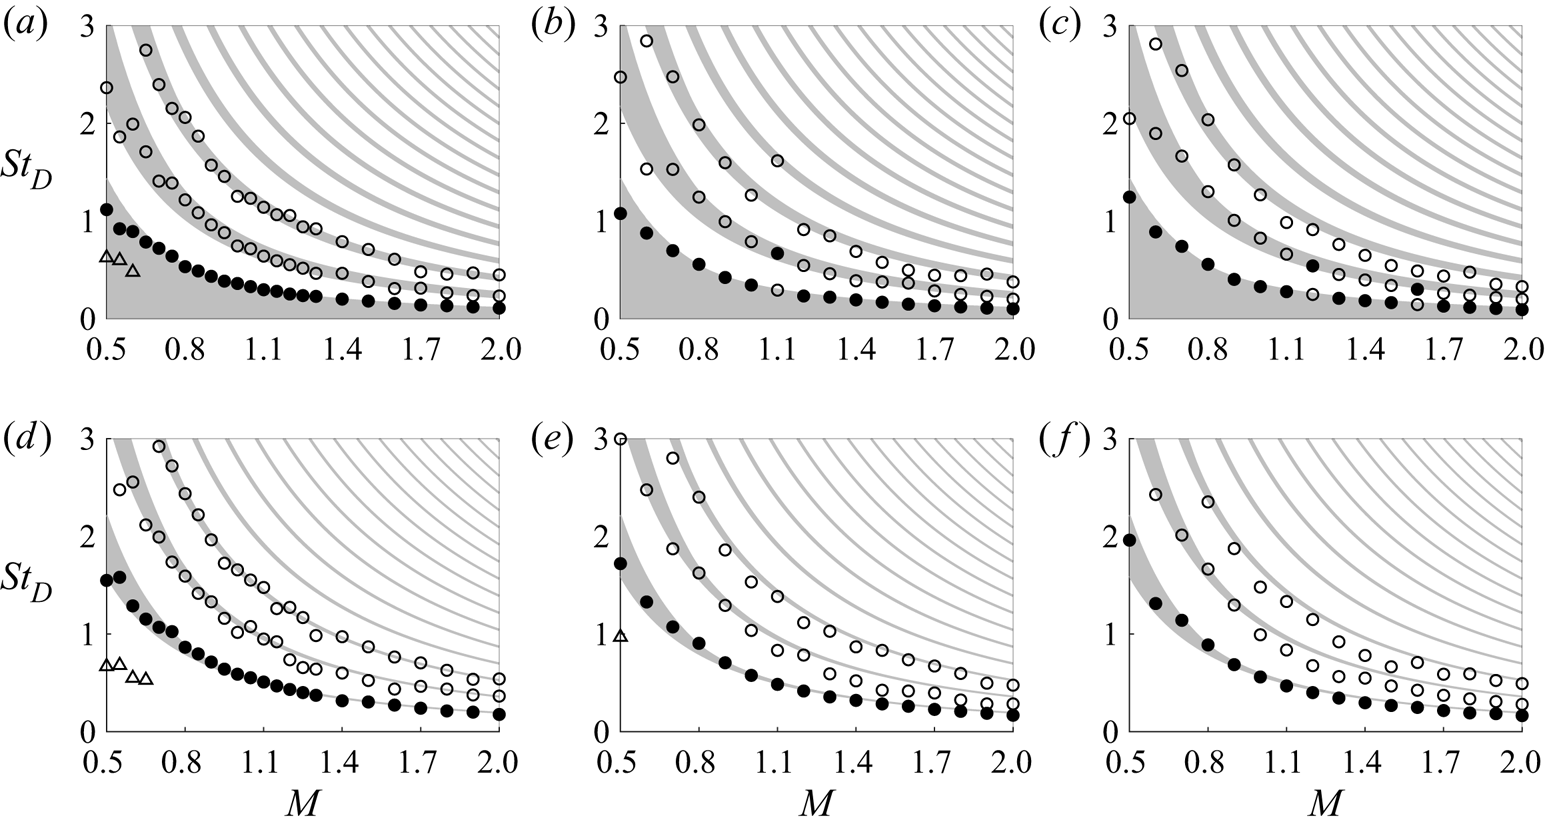
Figure 22. Mach number variations of the peak Strouhal numbers in the pressure spectra at  $z=0$ and $r=1.5r_0$ for (a–c) $n_{\theta }=0$ and (d–f) $n_{\theta }=1$ for the jets with (a,d) $\delta _{BL}=0.2r_0$, (b,e) $\delta _{BL}=0.1r_0$ and (c, f) $\delta _{BL}=0.05r_0$: $\bullet$ dominant and $\circ$ second and third strongest peaks associated with the guided jet modes; $\triangle$ peaks at the vortex-pairing frequencies; (grey) frequency ranges of the free-stream upstream-propagating guided jet waves.
For illustration, the sound pressure spectra computed at  $z=0$ and $r=1.5r_0$ for the jets at $M=0.70$, 1.10 and 1.60 are represented as a function of $St_D$ in figure 23(a–c) for $\delta _{BL}=0.2r_0$, in figure 23(d–f) for $\delta _{BL}=0.1r_0$ and in figure 23(g–i) for $\delta _{BL}=0.05r_0$. The contributions of the first two azimuthal modes are also displayed. Peaks appear in the full spectra as well as for the azimuthal modes, in agreement with Suzuki & Colonius (Reference Suzuki and Colonius2006) and Brès et al. (Reference Brès, Jordan, Jaunet, Le Rallic, Cavalieri, Towne, Lele, Colonius and Schmidt2018), for instance. They emerge more strongly at $M=1.10$ than at $M=0.70$ and 1.60. As the value of $\delta _{BL}/r_0$ decreases, the Strouhal numbers and the widths of the peaks do not change much. Their amplitudes, however, vary significantly. This is particularly true for $M=1.10$ in figure 23(b,e,h) where, for the axisymmetric mode, the dominant peak is the first one at $St_D\simeq 0.28$ for $\delta _{BL}=0.2r_0$ and $\delta _{BL}=0.05r_0$, but the second one at $St_D=0.67$ for $\delta _{BL}=0.1r_0$. This may be due to the establishment of A-type screech mode by the guided jet waves in the latter case (Edgington-Mitchell et al. Reference Edgington-Mitchell, Jaunet, Jordan, Towne, Soria and Honnery2018; Gojon et al. Reference Gojon, Bogey and Mihaescu2018; Mancinelli et al. Reference Mancinelli, Jaunet, Jordan and Towne2019) as mentioned above.

Figure 23. Power spectral densities of pressure fluctuations at  $z=0$ and $r=1.5r_0$ for the jets with (a–c) $\delta _{BL}=0.2r_0$, (d–f) $\delta _{BL}=0.1r_0$ and (g–i) $\delta _{BL}=0.05r_0$ at (a,d,g) $M=0.70$, (b,e,h) $M=1.10$ and (c, f,i) $M=1.60$: (black) full spectra, (red) $n_{\theta }=0$ and (blue) $n_{\theta }=1$.
Finally, the amplitudes, degrees of emergence and full widths at half-maximum of the dominant peaks at  $z=0$ and $r=1.5r_0$ are represented as a function of the Mach number in figure 24(a–c) for $\delta _{BL}=0.2r_0$, in figure 24(d–f) for $\delta _{BL}=0.1r_0$ and in figure 24(g–i) for $\delta _{BL}=0.05r_0$. The trends are similar in the three cases. They are discussed in length in Bogey (Reference Bogey2021a) in light of the properties of the guided jet waves. In figure 24(a,d,g), the peak levels increase roughly as $M^8$ for $M\leq 1$ and as $M^3$ for $M\geq 1$, following the scaling laws of aerodynamic noise for subsonic jets (Lighthill Reference Lighthill1952) and supersonic jets (Ffowcs Williams Reference Ffowcs Williams1963). A 3–6 dB excess is, however, observed between the circles and the trend line around $M= 0.80$, where resonant interactions between guided jet waves can happen in the jet potential core (Towne et al. Reference Towne, Cavalieri, Jordan, Colonius, Schmidt, Jaunet and Brès2017). Regarding the peak prominence in figure 24(b,e,h), it increases from $M=0.50$ up to $M\simeq 0.80$ and then decreases with the Mach number. The increase below $M= 0.80$ may be linked to the steepening of the cutoff of the free-stream upstream-propagating guided jet modes at their upper bounds (Bogey Reference Bogey2021a). The emergence of the dominant peak for the weakly screeching jet at $M=1.10$ with $\delta _{BL}=0.1r_0$ is also visible in figure 24(e). Finally, the peak widths in figure 24(c, f,i) decrease significantly between $M=0.50$ and 1, in accordance with the widths of the frequency bands of the free-stream guided jet modes, and then do not vary appreciably for $M\geq 1$.

Figure 24. Mach number variations of the characteristics of the dominant peaks associated with the guided jet modes in the pressure spectra at  $z=0$ and $r=1.5r_0$ for (red) $n_{\theta }=0$ and (blue) $n_{\theta }=1$: (a,d,g) peak levels, (b,e,h) ratios between the peak levels and the minimum values for higher $St_D$ and (c, f,i) peak widths, for the jets with (a–c) $\delta _{BL}=0.2r_0$, (d–f) $\delta _{BL}=0.1r_0$ and (g–i) $\delta _{BL}=0.05r_0$; ——– $M^8$; – – – $M^3$; – $\cdot$– $\cdot$ band width of the free-stream upstream-propagating guided jet mode ( $n_{\theta }=1$, $n_r=1$).
Appendix C. Most unstable frequencies downstream of the jet nozzle
In this third appendix, the variations of the frequencies of the most-amplified instability waves predicted in the jet shear layers downstream of the nozzle exit using linear stability analysis are illustrated. These variations may result from the change of the velocity profile during the boundary-layer/mixing-layer transition and to its thickening due to viscous effects, for instance.
The most unstable Strouhal numbers  $St_D$ obtained for $n_{\theta }=0$ for the jets at $M=0.90$ between the nozzle-exit plane at $z=0$ and the position $z=50\delta _{\theta }(0)$ where the linear stability analysis is performed in § 3.3.1 are represented in figure 25(a,b). For the five jets, they decrease with the axial distance, very weakly for $\delta _{BL}=0.4r_0$ and more strongly for a thinner boundary layer. As clearly shown in figure 25(b), the decrease is, however, limited in all cases, and is only of a few per cent between $z=10\delta _{\theta }(0)$ and $z=50\delta _{\theta }(0)$, for example. Therefore, the most unstable frequencies obtained at the latter position are fairly good approximations of those expected in the jet shear layers.

Figure 25. Axial variations of the most unstable Strouhal numbers  $St_D$ obtained for the jets at $M=0.90$ with $\delta _{BL}=$ (black) $0.4r_0$, (red) $0.2r_0$, (blue) $0.1r_0$, (green) $0.05r_0$ and (maroon) $0.025r_0$ for $n_{\theta }=0$ using linear stability analysis.
The most unstable Strouhal numbers calculated at  $z=z_{turb10\,\%}/2$ and $z=z_{turb10\,\%}/4$ for $n_{\theta }=0$ for the jets with $\delta _{BL}=0.2r_0$, $\delta _{BL}=0.1r_0$ and $\delta _{BL}=0.05r_0$ using linear stability analysis are plotted in figure 26(a–c) as a function of the Mach number. In the three cases, over the entire Mach number range $0.50 \leq M \leq 2$, the results at the two axial positions do not differ much from each other. This is particularly true at higher Mach numbers. These results support that the most unstable Strouhal numbers obtained at $z=z_{turb10\,\%}/2$ in § 3.3.1 are well representative of the frequencies of the most amplified instability waves in the jet shear layers.

Figure 26. Mach number variations of the most unstable Strouhal numbers  $St_D$ obtained at (black) $z=z_{turb10\,\%}/2$ and (red) $z=z_{turb10\,\%}/4$ for $n_{\theta }=0$ for the jets with (a) $\delta _{BL}=0.2r_0$, (b) $\delta _{BL}=0.1r_0$ and (c) $\delta _{BL}=0.05r_0$ using linear stability analysis.


 Open access