


1. Introduction
Increasingly stringent requirements on  ${\rm NO}_x$ emissions have driven a technology shift in modern power generation gas turbines towards lean premixed combustion systems. While lean premixed systems allow combustors to achieve significantly lower ${\rm NO}_x$ emissions, these flames are inherently less stable and hence more susceptible to acoustic disturbances, which can lead to combustion instability (Correa Reference Correa1998; Lefebvre Reference Lefebvre1998). Combustion instability arises from a coupling between the resonant acoustic modes of the combustor and the unsteady heat release rate of the flame. Occurrence of combustion instability is a limiting factor for engine performance and operability and, in extreme cases, can result in severe damage of engine hardware (Correa Reference Correa1998; Candel Reference Candel2002; Lieuwen & Yang Reference Lieuwen and Yang2005).
The acoustic modes of a combustor can couple with the unsteady rate of heat release through fluctuations in pressure, velocity and/or equivalence ratio (Lieuwen Reference Lieuwen2012). Velocity-coupling mechanisms can be driven by large-scale coherent structures in the flow that distort the flame and consequently alter the heat release rate (Poinsot et al. Reference Poinsot, Trouve, Veynante, Candel and Esposito1987; Paschereit, Gutmark & Weisenstein Reference Paschereit, Gutmark and Weisenstein1999; Gonzalez, Lee & Santavicca Reference Gonzalez, Lee and Santavicca2005; Kang, Culick & Ratner Reference Kang, Culick and Ratner2007; Shanbhogue et al. Reference Shanbhogue, Shin, Hemchandra, Plaks and Lieuwen2009). For instance, it has been shown that vortices in the flow can entrain fresh reactants and cause the flame to roll up, which sharply increases the flame surface area, thereby creating a heat release pulse. This coherent oscillation in heat release feeds back into the acoustic pressure fluctuations and creates a self-sustaining thermoacoustic instability (Poinsot et al. Reference Poinsot, Trouve, Veynante, Candel and Esposito1987; Ghoniem & Givi Reference Ghoniem and Givi1988; Lee et al. Reference Lee, Lee, Nye and Santavicca1993; Renard et al. Reference Renard, Rolon, Thévenin and Candel1999). A detailed review of the different mechanisms by which flames interact with vortical structures is provided by Renard et al. (Reference Renard, Thevenin, Rolon and Candel2000). Equivalence ratio fluctuations have also been shown to be drivers of combustion instabilities in lean premixed combustors (Lieuwen & Zinn Reference Lieuwen and Zinn1998; Auer, Hirsch & Sattelmayer Reference Auer, Hirsch and Sattelmayer2006; Kim et al. Reference Kim, Lee, Quay and Santavicca2010; Shreekrishna & Lieuwen Reference Shreekrishna and Lieuwen2010; Bluemner, Paschereit & Oberleithner Reference Bluemner, Paschereit and Oberleithner2019). Pressure oscillations in the combustor interact with the fuel supply and cause periodic oscillations in the equivalence ratio of the reactant mixture, which when convected to the flame, can cause pulsations in the heat release rate. Lee, Kim & Santavicca (Reference Lee, Kim and Santavicca2000) have shown, using an infrared absorption technique to measure equivalence ratio fluctuations, that the equivalence ratio fluctuations are strongly linked to the heat release rate fluctuations in an unstable combustor and can thereby play a significant role in driving the instability.
In partially premixed, swirl-stabilized systems used in gas turbine combustors, such as the combustor considered in this work (Stöhr et al. Reference Stöhr, Geigle, Hadef, Boxx, Carter, Grader and Gerlinger2019), complex hydrodynamic and thermo-chemical processes are involved, which may lead to multiple coupling pathways being present in the system. The dynamics of swirling flows are especially complex because they can exhibit several modes of hydrodynamic instability. These hydrodynamic instability modes can either be self-excited or globally stable but receptive to imposed forcing. Swirling flows are typically characterized by a non-dimensional parameter known as the swirl number ( $S$), which is the ratio of the axial flux of tangential momentum to the axial flux of axial momentum (Gupta, Lilley & Syred Reference Gupta, Lilley and Syred1984; Vignat, Durox & Candel Reference Vignat, Durox and Candel2022). Strongly swirling flows, such as those seen in gas turbine combustors, are characterized by the formation of a central recirculation zone, or a ‘vortex breakdown bubble’ (Harvey Reference Harvey1962; Hall Reference Hall1972). This recirculation zone constantly supplies hot products to the base of the flame, thereby enhancing its static stability.
Increasing the swirl number can cause this recirculation zone to precess about the axis of symmetry, forming what is known as the precessing vortex core (PVC) (Syred Reference Syred2006). PVCs are the manifestation of a global instability achieved through a supercritical Hopf bifurcation induced by vortex breakdown at a critical swirl number,  $S_{c}$ (Oberleithner et al. Reference Oberleithner, Sieber, Nayeri, Paschereit, Petz, Hege, Noack and Wygnanski2011; Manoharan et al. Reference Manoharan, Frederick, Clees, O'Connor and Hemchandra2020). Manoharan et al. (Reference Manoharan, Frederick, Clees, O'Connor and Hemchandra2020) showed, using experimental data and results from a weakly nonlinear stability analysis applied to the low Mach number governing Navier–Stokes equations, that the frequency and square of the amplitude of the PVC oscillation scale linearly with $S$. Importantly, the Strouhal number based on oscillation frequency, jet diameter and bulk flow velocity, associated with the PVC, is shown to depend only on $S$ and the time-averaged flow state at $S=S_{c}$. Ab initio estimates of the linear growth and nonlinear amplitude saturation coefficients of the Stuart–Landau equation for the PVC amplitude from the experimentally determined time-averaged flow fields at $S=S_{c}$ confirm that the PVC is a stable limit cycle flow oscillation that results from a supercritical Hopf bifurcation in the flow state at $S=S_{c}$. In combustor systems, the occurrence of a PVC is a function of swirl number, flame shape, fuel/air mixing, combustor configuration and equivalence ratio (Syred Reference Syred2006). PVC dynamics can significantly influence the flame and flow dynamics in a number of ways (Candel et al. Reference Candel, Durox, Schuller, Bourgouin and Moeck2014). The helical shear layer rollup from perturbation of the shear layers by the precession of the vortex breakdown bubble has been shown to interact with the flame and cause flame surface distortion (Stöhr et al. Reference Stöhr, Boxx, Carter and Meier2012; Stöhr, Arndt & Meier Reference Stöhr, Arndt and Meier2015). The occurrence of PVCs can also, in some cases, impact flame stabilization and macrostructure of swirl-stabilized flames (Moeck et al. Reference Moeck, Bourgouin, Durox, Schuller and Candel2012; Oberleithner et al. Reference Oberleithner, Stöhr, Im, Arndt and Steinberg2015; Taamallah, Shanbhogue & Ghoniem Reference Taamallah, Shanbhogue and Ghoniem2016; Datta et al. Reference Datta, Gupta, Chterev, Boxx and Hemchandra2021). It has also been shown that PVCs can enhance fuel/air mixing (Freitag et al. Reference Freitag, Klein, Gregor, Nauert, Geyer, Schneider, Dreizler and Janicka2005; Stöhr et al. Reference Stöhr, Arndt and Meier2015).
The primary focus of this study is to characterize the impact of the PVC on the thermoacoustic modes of the combustor in a partially premixed flame at elevated pressure. The interaction of hydrodynamic instabilities, such as the PVC, and symmetric acoustic modes is of significant interest as both these modes can be simultaneously observed in many combustor configurations. Hemchandra et al. (Reference Hemchandra, Shanbhogue, Hong and Ghoniem2018) proposed two possible coupling pathways between self-excited hydrodynamic instability modes and the combustor acoustic modes that can lead to combustion instability. These results indicate that the strength of the coupling between the hydrodynamic and acoustic modes depends on how close the instability frequency is to the combustor acoustic eigenfrequency, in addition to how effectively acoustic modes can excite the flow in the regions where hydrodynamic modes are receptive to forcing.
Steinberg et al. (Reference Steinberg, Boxx, Stöhr, Carter and Meier2010) showed that, in a case where both the PVC and thermoacoustic mode are simultaneously present, the PVC can undergo axial extension and contraction at the thermoacoustic frequency. Moeck et al. (Reference Moeck, Bourgouin, Durox, Schuller and Candel2012) and Steinberg et al. (Reference Steinberg, Boxx, Stöhr, Carter and Meier2010) reported the presence of a spectral peak at an interaction frequency that corresponds to the difference between the PVC and thermoacoustic frequencies and suggested that this interaction frequency is likely a consequence of nonlinear phenomena. Lückoff & Oberleithner (Reference Lückoff and Oberleithner2019) studied the impact of actuation of helical flow modes on thermoacoustic modes. Their results showed that, in the case of a partially premixed flame, this actuation can significantly reduce thermoacoustic instability. They suggested that this suppression of thermoacoustic instability modes is likely a consequence of suppression of equivalence ratio fluctuation due to enhanced mixing caused by the helical flow mode excited. By contrast, in some cases, the self-excited PVC mode is suppressed in reacting flows (Oberleithner et al. Reference Oberleithner, Terhaar, Rukes and Paschereit2013, Reference Oberleithner, Stöhr, Im, Arndt and Steinberg2015). Taamallah et al. (Reference Taamallah, Shanbhogue and Ghoniem2016) showed that the presence of a PVC in a premixed swirl-stabilized combustor can provide a low velocity path within the combustor flow field resulting in a flame shape change. This new flame shape, in turn, causes the combustor acoustic mode to couple with the flame, resulting in thermoacoustic oscillations. Mathews, Hansford & O'Connor (Reference Mathews, Hansford and O'Connor2016) showed, through a spectral analysis of time-resolved flow field measurements of a swirled jet, that response of the shear layers to acoustic forcing in an isothermal swirling jet can be suppressed in the presence of a PVC. A linear stability analysis using time-averaged base flows from the same data showed that the increased shear layer thickness due to the presence of the PVC leads to a progressive weakening of the receptivity of the axisymmetric Kelvin–Helmholtz mode of the shear layers to imposed forcing (Frederick et al. Reference Frederick, Manoharan, Dudash, Brubaker, Hemchandra and O'Connor2018) and, therefore, suggests an explanation for the suppression of the axisymmetric flow response.
Put together, the existing literature shows that the dynamics of the PVC can have a critical impact on the performance of swirl-stabilized combustion systems. Furthermore, the PVC can interact with the symmetric acoustic modes present in the combustor in a number of ways, depending on the operating conditions and combustor configuration. The goal of this study is to investigate the dynamics of the PVC and the thermoacoustic modes in a situation where they do not co-exist by thoroughly analysing both the non-reacting and reacting data to describe the dynamics of the PVC and the flame. Additionally, this study extends concepts previously described by these authors to a more realistic configuration with a dual-annular swirl injector, commonly found in gas turbine combustors (Joshi et al. Reference Joshi, Mongia, Leonard, Stegmaier and Vickers1998), partially premixed fuel injection and elevated pressures. Using an optically accessible model swirl-stabilized gas turbine combustor configuration, operating at an elevated pressure of 5 bar, we study the interaction between the dominant oscillation modes present in the system and observe the evolution of this interaction at a range of flow conditions. Our results show that, in the configuration studied, two dominant thermoacoustic modes and one PVC mode are present over different parts of the operating range. In cases where all three modes are simultaneously present, the PVC oscillation mode is generally the governing mode in the flow field. Furthermore, whenever the frequency of the PVC approaches that of either thermoacoustic mode, the thermoacoustic mode is subsequently suppressed. The presence of the PVC at the same flow condition in cold flow experiments shows that the thermoacoustic oscillations are not the cause of the PVC. Complex network analysis and a theoretical analysis provided in the supplementary material available at https://doi.org/10.1017/jfm.2022.610 suggest nonlinear modal coupling between the PVC and the flow response to the acoustic oscillation, resulting the suppression of the latter.
The rest of this paper is organized as follows. First, we provide an overview of the experimental methods, diagnostics and data analysis methods used in this study. Next, we discuss the velocity field results from the non-reacting flow study, followed by the velocity field results of the reacting flow study. A novel combination of spectral proper orthogonal decomposition and a complex network analysis is used to understand the source of oscillations in the feedback. A weakly nonlinear theoretical analysis supports the analysis of experimental results to suggest a mechanism by which the PVC and thermoacoustic modes interact, resulting in a suppression of the thermoacoustic oscillations. We then discuss the implications of the velocity field behaviour on the flame dynamics. Finally, we directly compare the non-reacting and reacting results, and discuss the impact that hydrodynamic instabilities can have on thermoacoustic instabilities more generally.
2. Experimental methods
2.1. Burner and operating conditions
The burner used in the current study is shown in figure 1; its geometry has been described in previous publications (Geigle et al. Reference Geigle, Köhler, O'Loughlin and Meier2015, Reference Geigle, Hadef, Stöhr and Meier2017). For completeness, it is briefly described again here. The injector consists of a pair of annular swirl nozzles separated by a ring of 60 fuel channels, each with an area of  $0.5\times 0.4\ {\rm mm}^{2}$, for the introduction of the gaseous fuel, ethylene. The central air nozzle has a diameter of 12.3 mm and a nominal geometric swirl number of 0.82 (Lefebvre Reference Lefebvre1998). The annular outer air nozzle measures 19.8 mm in diameter and has a nominal geometric swirl number of 0.79. The combustion chamber has a square cross-section measuring $68\times 68\ {\rm mm}^{2}$. It is 120 mm long and enclosed by 3 mm-thick quartz windows for optical access. The water-cooled dome of the combustion chamber has a cylindrical exhaust hole – diameter 40 mm, length 24 mm – linked to the combustion chamber by a curved tube. The combustor was mounted in an optically accessible pressure vessel.

Figure 1. Experimental setup.
The flows of air (central, annular and seeding) and fuel were supplied by separate mass flow controllers (Bronkhorst). The flow rate of air is 841.7 standard litres per minute (SLM) and flow rate of fuel is 37.9 SLM, resulting in a thermal power of 38.4 kW. In the non-reacting studies, no fuel is injected into the system but the air flow rate is the same. The flow controllers were calibrated in house, resulting in an accuracy of better than 1.0 % of the controllers’ maximum flow. The majority of the ethylene flow was bubbled through a temperature-controlled reservoir ( $T=25\,^{\circ }{\rm C}$, 298 K) filled with acetone, which provided an acetone-saturated ethylene flow of the desired composition. For the present study, the combustor was operated with ethylene/acetone fuel at a pressure of 5 bars and $\varPhi = 0.67$. The air split, defined as the fraction of air flow passing through the centre nozzle, was varied from 0 to 1 in the non-reacting cases and 0.2 to 0.5 in the reacting cases. The Reynolds number based on the diameter of the outer nozzle is $Re = 19\,490$.
2.2. Measurement techniques
Time-resolved stereo particle image velocimetry (sPIV), planar laser-induced fluorescence of OH (OH-PLIF) and acetone-PLIF were applied simultaneously with a repetition rate of 10 kHz to capture flame/vortex/fuel interaction. Data were obtained for 1 s in the technically premixed ethylene/air swirl flame stabilized in the model of the aero-engine combustor. This diagnostic system has been described previously in the scientific literature (Litvinov et al. Reference Litvinov, Yoon, Noren, Stöhr, Boxx and Geigle2021). For completeness, a brief description is included below.
2.2.1. Particle image velocimetry
Velocity fields were measured using a two-camera, sPIV system. The sPIV system used a dual-cavity, diode-pumped, solid-state laser (Edgewave, IS200-2-LD, up to  $9\ {\rm mJ}\ {\rm pulse}^{-1}$ at 532 nm) and a pair of high-speed CMOS cameras (Phantom V1212). The cameras were mounted on opposite sides of the laser sheet, looking down into the combustor. PIV image pairs were acquired at 10 kHz and $640\times 800$ pixel resolution. The PIV measurement domain spans across most of the width of the combustion chamber ( $-27\ {\rm mm} < r < 27\ {\rm mm}$). In the axial direction, the domain spans $5\ {\rm mm} < z < 27\ {\rm mm}$, as shown in figure 1. Time separation of the laser pulses was $\delta t = 10\ \mathrm {\mu } {\rm s}$. The beam was formed into a sheet using a pair of cylindrical lenses (with focal length $\,f = -38$ mm and 250 mm) and thinned to a waist using a third cylindrical lens ( $\,f = 700$ mm). Both combustion air flows were seeded with titanium dioxide ( ${\rm TiO}_2$) particles of nominal diameter $0.5\ \mathrm {\mu }{\rm m}$. Image mapping, calibration and particle cross-correlations were completed using a commercial, multi-pass adaptive window offset cross-correlation algorithm (LaVision DaVis 8.4). Final interrogation window size and overlap were $24\times 24$ pixels and 50 %, respectively, for a spatial resolution of 1.9 mm and vector spacing of 0.95 mm. The absolute values of uncertainty of instantaneous velocities based on the correlation statistics in DaVis were estimated to be $0.1\unicode{x2013}1.1\ {\rm m}\ {\rm s}^{-1}$ for the in-plane components and $0.3\unicode{x2013}2.3\ {\rm m}\ {\rm s}^{-1}$ for the out-of-plane component. On average, uncertainty values for the in-plane components are in the range of $0.04 \unicode{x2013}0.45\ {\rm m}\ {\rm s}^{-1}$ and the uncertainty values for the out-of-plane component are in the range of $0.10\unicode{x2013}0.9\ {\rm m}\ {\rm s}^{-1}$.
2.2.2. OH- and acetone-PLIF
The OH-/acetone-PLIF imaging system is based on a frequency-doubled dye laser, pumped by high-speed, pulsed Nd:YAG laser (Edgewave IS400-2-L, 135 W at 532 nm and 10 kHz) and a pair of intensified high-speed CMOS camera systems. The dye laser system (Sirah Credo) produced  $5.3\unicode{x2013}5.5\ {\rm W}$ at 283 nm and 10 kHz repetition rate ( $0.53\unicode{x2013}0.55\ {\rm mJ}\ {\rm pulse}^{-1}$). The dye laser was tuned to excite the Q1(9) and Q2(8) lines of the $A^{2} \varSigma ^{+} - X^{2} \varPi (v'=1,v''=0)$ band. These transitions merge at high pressure due to increased collisional line broadening, which mitigates to some degree fluorescence signal loss due to collisional line broadening. The laser wavelength was monitored continuously throughout the experiments using a photomultiplier tube mounted to a 10 cm monochrometer and a premixed, laminar reference flame. The 283 nm PLIF excitation beam is formed into a sheet approximately 40 mm (high) $\times$ 0.2 mm (thick) using three fused-silica cylindrical lenses (all anti-reflective coated to maximize transmission). The laser sheets of the OH-/acetone-PLIF and PIV systems were overlapped by passing the (green, 532 nm) PIV sheet through the final OH-PLIF turning mirror.
The same laser was used to excite fluorescence signal in both the OH- and the acetone-PLIF imaging systems. For acetone-PLIF, fluorescence signal was imaged via a CMOS camera (LaVision HSS8), an external two-stage intensifier (LaVision HS-IRO), equipped with 85 mm focal length, f/1.2 (Canon) objective and a band-pass interference filter. The filter (LOT, 450FS40-50) was centred at 450 nm for detection of the acetone fluorescence and had a bandpass of  ${\pm }20$ nm. OH-PLIF fluorescence signal was imaged using a similar highspeed CMOS camera (LaVision HSS8) and external two-stage intensifier (LaVision HS-IRO) from the opposite side of the combustor. The OH-PLIF camera was equipped with 64 mm focal length, f/2 (Halle) ultraviolet-capable objective and a high transmission bandpass interference filter. The OH-/acetone-PLIF measurement domain was slightly larger than that of the PIV system, spanning ( $-27\ {\rm mm}< r < 27\ {\rm mm}, 0\ {\rm mm}< z < 30\ {\rm mm}$), as shown in figure 1.
Previous studies have demonstrated the feasibility of using acetone as fuel tracer in a dual-swirl gas turbine model combustor similar to that used in the present study (Stöhr et al. Reference Stöhr, Arndt and Meier2015; Stöhr, Yin & Meier Reference Stöhr, Yin and Meier2017). These studies indicated that replacement of 10 % vol of the original (methane) fuel by acetone vapour did not significantly change the flame shape or dynamics. Although the present study uses ethylene rather than methane, it is expected to have a similarly negligible effect on the flame shape and dynamics. Data from the acetone PLIF signal are only considered until downstream distances of  $z=15$ mm, as the fuel is largely consumed by that point. Signal downstream of that point is likely the result of fluorescence of polycyclic aromatic hydrocarbons or even weak soot luminescence, and so is not analysed in the analysis discussed in § 5.
2.3. Data analysis
2.3.1. Spectral analysis
In this study, we predominantly use spectral proper orthogonal decomposition (SPOD) to characterize the frequency-domain behaviour of the flame and flow field. Proper orthogonal decomposition (POD) (Sirovich Reference Sirovich1987; Berkooz, Holmes & Lumley Reference Berkooz, Holmes and Lumley1993) is a data-driven modal decomposition that yields energy-ordered modes that can be used to extract coherent structures from a flow field. Spectral POD is derived for statistically stationary flows by applying the POD on flow snapshots determined at a given frequency by dividing the time-series data into ensembles and applying a Fourier transform (Towne, Schmidt & Colonius Reference Towne, Schmidt and Colonius2018). Thus, the SPOD determines the eigenspectrum of the cross-spectral density between flow oscillations in space at a given frequency rather than the full time correlation. This process yields optimal spatial modes analogous to those from snapshot POD but which are also frequency resolved and can therefore be interpreted as representative of coherent flow oscillations at the oscillation frequency considered. As a result, tonal but spatially uncorrelated or low-energy oscillations are not necessarily separated from other motions in the POD, but are naturally identified by SPOD. Towne et al. (Reference Towne, Schmidt and Colonius2018) also show rigorously that SPOD is an optimized dynamic mode decomposition (Schmid Reference Schmid2010) method for stationary flows. We have used the SPOD technique in several recent studies to extract spectrally resolved coherent modes corresponding to PVC oscillations (Manoharan et al. Reference Manoharan, Frederick, Clees, O'Connor and Hemchandra2020; Datta et al. Reference Datta, Gupta, Chterev, Boxx and Hemchandra2021; Gupta et al. Reference Gupta, Shanbhogue, Shimura, Ghoniem and Hemchandra2021). For the reacting results presented in this paper, SPOD results have been determined by dividing the time record of 10 000 velocity field snapshots into 38 ensembles of 512 snapshots each with 50 % overlap between ensembles. For the non-reacting conditions, SPOD results have been determined by dividing the time record of 9300 velocity field snapshots into 35 ensembles of 512 snapshots each with 50 % overlap between ensembles.
In addition to a flow field characterization, SPOD was also used to understand the correlation between motions in the velocity field and the flame. In order to find the motions that are correlated across the flame and the flow field, we perform the decomposition using snapshots that include both velocity data from the PIV measurement and flame data from the OH-PLIF measurements, since the two measurements were performed simultaneously. We crop the fields spatially to ensure the two measurements correspond to the same spatial locations and spatially down-sample the OH-PLIF images to match the spatial resolution of the PIV images. We then normalize the individual velocity and OH-PLIF signal values so that both normalized velocity and OH-PLIF oscillation amplitudes are quantitatively comparable. Finally, we perform spectral POD on this composite dataset. This result identifies flow and flame oscillation modes that are coherent, i.e. oscillating at the same frequency with a phase difference that is spatially varying but constant in time, relative to each other.
2.3.2. Complex network analysis
Coherent self-excited flow oscillations are generated due to internal feedback of flow oscillations within critical regions in the flow field. This feedback is generated by nonlinearity to leading order by the interaction of the flow oscillation with itself. These flow regions are referred to as wavemakers. They can be identified by regions of high structural sensitivity or receptivity of self-excited linear modes as determined from hydrodynamic stability analysis, as shown in several prior studies of self-excited bluff-body wakes (Giannetti & Luchini Reference Giannetti and Luchini2007; Marquet, Sipp & Jacquin Reference Marquet, Sipp and Jacquin2008; Juniper, Tammisola & Lundell Reference Juniper, Tammisola and Lundell2011) and swirl nozzles (Tammisola & Juniper Reference Tammisola and Juniper2016; Mukherjee et al. Reference Mukherjee, Muthichur, More, Gupta and Hemchandra2021). However, applying these approaches to analyse the present flow problem is challenging. Firstly, the highly turbulent and density stratified nature of the present flow field would introduce large quantitative uncertainties in a hydrodynamic stability analysis of the current flow since unambiguous quantitatively accurate density fields are not directly measured. Secondly, it is known that regions of receptivity for hydrodynamic modes are localized inside nozzles and close to burner lips where shear layers separate (Wang et al. Reference Wang, Kaiser, Meindl, Oberleithner, Polifke and Lesshafft2022). Determining time-averaged flow fields in these regions for the present nozzle using PIV is challenging. Also, optical access to determine time-averaged flows within the nozzle is not possible in the current experimental setup. Therefore, we adopt an alternate data-driven approach from complex network theory to determine the position and shape of critical regions associated with various flow field oscillations from time-series PIV data directly. These in turn yield insight into the position and spatial extent of wavemaker regions as will be described in this section.
Our approach closely follows the methods described in Krishnan et al. (Reference Krishnan, Manikandan, Midhun, Reeja, Unni, Sujith, Marwan and Kurths2019). They apply complex network analysis to identify the critical region driving shear layer instability in an axisymmetric bluff-body-stabilized turbulent combustor. They show experimentally that modifying the flow in this region stabilizes the shear layer and the flow instability. This result is analogous to the study of Mukherjee et al. (Reference Mukherjee, Muthichur, More, Gupta and Hemchandra2021), wherein traditional structural sensitivity analysis was used to guide a change in nozzle geometry to induce a self-excited PVC oscillation. While comparing estimates of critical regions from traditional physics-based stability analysis and data-driven complex network theory methods still remains an open question to the best of our knowledge, we apply the latter method due to the lower uncertainty in the results that it affords for the data analysed in this paper.
Following Krishnan et al. (Reference Krishnan, Manikandan, Midhun, Reeja, Unni, Sujith, Marwan and Kurths2019), we construct an undirected weighted spatial correlation network using the velocity fields obtained from the sPIV measurements as follows. The points where sPIV measurements are available are considered as nodes of the network. The strength of the connection between two nodes  $i$ and $j$ is established using the Pearson's correlation coefficient $R_{ij}$, defined using the in-plane transverse velocity component, $u_{r}$ as follows:
 \begin{equation} R_{ij} = \frac { \displaystyle\sum\limits_{n=1}^{N} (u^{n}_{r,i} - \langle u_{r,i} \rangle) (u^{n}_{r,j} - \langle u_{r,j} \rangle) } { \sqrt{ \displaystyle\sum\limits_{n=1}^{N} (u^{n}_{r,i} - \langle u_{r,i} \rangle)^{2} } \sqrt{ \displaystyle\sum\limits_{n=1}^{N} (u^{n}_{r,j} - \langle u_{r,j} \rangle)^{2} } }, \end{equation}
where the superscript ‘ $n$’ indexes time and subscripts ‘ $i$’ and ‘ $j$’ index spatial location in the PIV field of view. Angle brackets represent a temporal average computed over $N = 9300$ samples for the non-reacting cases, and $N = 10\,000$ samples for the reacting cases. The connectivity between nodes in the network, i.e. spatial locations, is then represented as an adjacency matrix, $A_{ij}$ defined as follows:
 \begin{equation} A_{ij} = \begin{cases} |R_{ij}|, & |R_{ij}| \geqslant R_t\ \mbox{and}\ i \neq j \\ 0, & \text{otherwise} \end{cases} \end{equation}
where we choose the threshold  $R_{t}=0.5$. Thus, the value of $A_{ij}$ for a given pair of nodes quantifies the magnitude of the correlation between flow motions at the two nodes and is taken as the strength of the link between these nodes. We have repeated the analysis using other velocity components (not shown). The resulting adjacency matrices are qualitatively and quantitatively similar in all cases.
We then compute the weighted closeness centrality of each node in the network as follows (Opsahl, Agneessens & Skvoretz Reference Opsahl, Agneessens and Skvoretz2010):
 \begin{equation} C_{i} = \sum\limits_{j=1,j \neq i}^{N} 2^{{-}d_{ij}}. \end{equation}
Here,  $d_{ij}$ is a the least costly path between two nodes defined as follows:
 \begin{equation} d_{ij} = \text{min} \left( \frac{1}{A_{ih}} + \frac{1}{A_{hk}} + \cdots + \frac{1}{A_{rs}} + \frac{1}{A_{sj}} \right), \end{equation}
where  $h,k,r,s,\ldots$ are the intermediary nodes on some path connecting nodes $i$ and $j$ in the network. The minimization in (2.2) is performed over all possible paths between nodes $i$ and $j$ as determined from $A_{ij}$ using Dijkstra's algorithm (Dijkstra Reference Dijkstra1959). From (2.3), it can be shown that $C_{i}$ is large when the node $i$ is connected to many nodes in the network by low cost paths. From (2.4) the cost of the path is determined by how closely velocity oscillations between two connected nodes are correlated.
Thus, the value of  $C_{i}$ defined by (2.3), measures how closely flow oscillations at node $i$ are strongly correlated with flow oscillations at all other points in the flow. Thus, a spatial region corresponding to a cluster of nodes with large $C_{i}$ values, suggests the presence of strong feedback coupling between flow oscillations at points in this spatial region and that this coupling is essentially responsible for the flow oscillations. Therefore, clusters of nodes with large values of $C_{i}$ in coherently self-excited flows, identify critical regions in the flow that are analogous to ‘wavemaker’ regions determined from traditional stability analysis. Similarly, these high $C_{i}$ clusters in forced flows essentially identify regions of high receptivity where the presence of significant amplitude of imposed forcing drives coherent unsteady flow oscillations. For the sake of simplicity, in this paper, we refer to all critical regions identified by closeness centrality as wavemakers because broadly speaking, flow oscillations in these regions drive flow oscillations in other regions of the flow. Further discussion of the complex network analysis implementation and its relevance to wavemakers is provided in the supplementary material.
2.3.3. Flame dynamics analysis
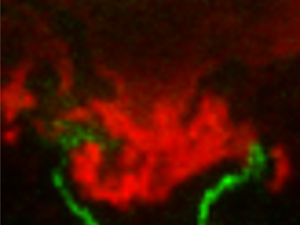
The signal measured from the OH-PLIF is used to characterize the flame at every instant. In order to observe the impact that the flame structure has on the flow field, we need to define a flame edge. Here, we assume that the flame edge can be defined at the edge of the OH-PLIF signal. In a fully premixed flame, the flame edge can be identified using a maximum gradient definition from an OH-PLIF image (Fugger et al. Reference Fugger, Roy, Caswell, Rankin and Gord2019). Even though the flame in the present experiment is nominally partially premixed, instantaneous acetone-PLIF images obtained concurrently with the OH-PLIF images show good mixing of fuel and air ahead of the regions with significant OH-PLIF signal intensity. Figure 2 shows a typical result that superimposes an instantaneous snapshot of the OH-PLIF signal intensity (red contour) with the corresponding concurrently measured acetone PLIF intensity (green contour) on the left, along with a time-averaged representation of both fields for the same air split condition ( $\text {air split}=0.25$). The drop off in intensity in the acetone-PLIF signal ahead of the regions of high OH-PLIF intensity justifies our use of a fully premixed flame edge definition based on the instantaneous OH-PLIF gradient. Further analysis of the two PLIF results and more detailed discussion of image processing can be found in Karmarkar, Boxx & O'Connor (Reference Karmarkar, Boxx and O'Connor2022).

Figure 2. (a) Instantaneous and (b) time-averaged images of superimposed OH-PLIF (red contour) and acetone-PLIF (green contour) signals.
We obtain time-averaged progress variable fields by binarizing every frame based on the flame instantaneous flame edges extracted from the instantaneous OH-PLIF field snapshots. The raw OH-PLIF images are first filtered using a bilateral filter to remove noise and smooth sharp gradients. The images are then binarized using a multi-level thresholding function, multithresh in MATLAB, where the reactant regions are assigned a value of zero and the products are assigned a value of one. The thresholds are calculated using Otsu's method and a maximum of four levels are used for the binarization. Finally, the binarized images are averaged in time to obtain the time-averaged progress variable fields,  $\bar {c}$, corresponding to every operating condition. We use $\bar {c}=0.5$ as a reference flame location at every condition to characterize the flame shape.
3. Non-reacting flow dynamics
3.1. Time-averaged flow profiles
The main operational parameter varied in this study is the air split, which is the ratio of the mass flow through the central portion of the nozzle to the total mass flow. At the non-reacting condition, 11 air splits were tested, varying from 0 (no air flow through the centre) to 1 (all air flow through the centre) in steps of 0.1. At all conditions, the total mass flow rate is held constant. No fuel flow is present through the slots between the inner and outer swirlers.
Figure 3 shows the time-averaged streamwise velocity contours for all non-reacting air split conditions obtained from the sPIV measurements. The streamlines are depicted using white curves and the red dotted curves are the zero contours of time-averaged streamwise flow velocity, i.e.  $\bar {u}_z=0$. As the air split increases, two features of the swirling jet change. First, as air split increases and more air flows through the central swirler, the annular jet becomes more compact. This change is because more flow is injected near the centreline and because the radial spread of the annular jet decreases as air split increases. Second, vortex breakdown results in the formation of a recirculation zone, which develops and becomes stronger and narrower as the air split increases.

Figure 3. Time-averaged streamwise velocity for all non-reacting conditions with streamlines depicted as white curves and the limits of the recirculation zone ( $\bar {u}_z=0$) depicted with dotted red contours.
The dynamic swirl number,  $S_{d}$, is determined from the ratio of the axial fluxes of azimuthal and axial momentum, radially integrated from the $\bar {u}_z=0$ contour at the outer boundary of the recirculation zone ( $r=r_c$) to the edge of the frame of data ( $r=R$) at each downstream distance as follows:
 \begin{equation} S_d=\frac{\displaystyle\int_{r_c}^{R} \bar{u}_{\theta}(z,r) \bar{u}_{z}(z,r) r\,{\rm d}r} {\displaystyle\int_{r_c}^{R} \bar{u}_{z}(z,r)^{2} r \,{\rm d}r}. \end{equation}
 We choose to integrate the momentum from the edge of the recirculation zone in order to capture only the swirling part of the flow. Figures 4(a) and 4(b) show the centreline variations of the time-averaged axial velocity ( $\bar {u}_z$) and $S_{d}$, respectively, at every air split condition. As the air split increases, the magnitude of the reverse velocity component increases, indicating an increase in the strength of recirculation. Note that the lowest three air splits have very little recirculation along the centreline, indicating that the central recirculation zone structure is largely determined by the flow through the central swirler. Furthermore, the swirl number, $S_d$, does not vary significantly across different air split conditions, especially close to the inlet. This invariance is likely due to the fact that the swirl number of the inner and outer swirlers is very similar.

Figure 4. (a) Centreline time-averaged axial velocity, (b) swirl number and (c) backflow ratio and swirl number at the downstream location of minimum mean centreline axial velocity for all air split conditions.
These flow profiles have been condensed into two parameters – the backflow ratio and the swirl number – in figure 4(c). The backflow ratio is defined as follows (Yu & Monkewitz Reference Yu and Monkewitz1990):
 \begin{equation} \varLambda = \frac{|\bar{u}_{z,o}|-|\bar{u}_{z,max}|}{|\bar{u}_{z,o}|+|\bar{u}_{z,max}|}, \end{equation}
where  $\bar {u}_{z,o}$ is the maximum streamwise reverse flow velocity magnitude on the axis, i.e. at $z\sim 8$ mm for all cases – see figure 4(a). The quantity $\bar {u}_{z,max}$ is the maximum off-axis streamwise velocity magnitude at this downstream distance. Therefore, values of $\varLambda$ close to zero or positive imply strong centreline reverse flow and thus strong recirculation.
Figure 4(c) shows the variation of  $\varLambda$ with air split. Note that $\varLambda$ is only calculated for air splits of 0.3 and above, as cases with lower air splits do not show a minimum in centreline axial velocity in the field of view – see figure 4(a). The corresponding variation of swirl number, $S_{o}$, at the same axial location is also plotted for reference. Together, these results show that increasing air split results in an increase in recirculation strength and swirl up to an air split value of 0.5. Beyond this value, both swirl intensity and recirculation strength stay constant. Previous studies of swirl flow stability using similar parameters (Oberleithner et al. Reference Oberleithner, Sieber, Nayeri, Paschereit, Petz, Hege, Noack and Wygnanski2011; Manoharan et al. Reference Manoharan, Hansford, O'Connor and Hemchandra2015) show that increasing swirl and recirculation strength causes flow profiles in a swirl flow to become locally absolutely unstable. As such, these two parameters play a key role on the global stability of the PVC to leading order (Monkewitz, Huerre & Chomaz Reference Monkewitz, Huerre and Chomaz1993). The nearly constant values of $\varLambda$ and $S_{o}$ for air splits larger than 0.5 in figure 4(c) indicate that the flow through the central nozzle essentially governs the coherent unsteady dynamics of the swirling flow field. The impact of the reduction in outer nozzle mass flow rate is not significant. We will show further evidence of the importance of the centre-nozzle flow from SPOD analysis of the non-reacting velocity fields.
3.2. Spectral characterization of non-reacting flow
The time-averaged velocity fields for the non-reacting flow conditions shown in figure 3 suggest that the flow through the centre nozzle governs the structure of the swirling flow field and its transition to vortex breakdown. This transition results in the emergence of a coherent hydrodynamic oscillation in the flow, as has been observed in several prior studies (Escudier & Keller Reference Escudier and Keller1985; Billant, Chomaz & Huerre Reference Billant, Chomaz and Huerre1998; Oberleithner et al. Reference Oberleithner, Sieber, Nayeri, Paschereit, Petz, Hege, Noack and Wygnanski2011; Manoharan et al. Reference Manoharan, Frederick, Clees, O'Connor and Hemchandra2020). Figure 5 shows the variation of modal energy with oscillation frequency, referred to hereafter as modal energy spectra, for all modes obtained from SPOD for all air split conditions. The red curves show the energy spectra for the most energetic mode and the grey curves are for modes in decreasing order of energy at each frequency. As the air split increases, a dominant coherent mode can be seen, starting at 254 Hz at an air split of 0.2. Both the frequency and amplitude of this mode increases with increasing air split; harmonics of the mode are also present in all cases.

Figure 5. Modal energy spectra from SPOD for non-reacting conditions varying air splits.
Figure 6 shows the variation of the peak frequency ( $\,f_{peak}$) with air split, along with the same data plotted as a non-dimensional Strouhal number $St=\,f_{peak} \bar {U}_b/D_{i}$, using the bulk velocity through the central nozzle as the reference velocity ( $U_{b}$) and the diameter of the central nozzle ( $D_{i}$) as the reference length scale. The frequency of the coherent mode increases linearly with increasing air split, while the Strouhal number remains constant. This Strouhal number behaviour is characteristic of hydrodynamic instability rather than an acoustic mode. The variation of the PVC frequency with flow split, and hence the velocity of the jet through the centre nozzle, is similar to results from several studies in a number of different experimental configurations (Syred & Beer Reference Syred and Beer1974; Martinelli, Olivani & Coghe Reference Martinelli, Olivani and Coghe2007; Oberleithner et al. Reference Oberleithner, Sieber, Nayeri, Paschereit, Petz, Hege, Noack and Wygnanski2011; Moeck et al. Reference Moeck, Bourgouin, Durox, Schuller and Candel2012; Manoharan et al. Reference Manoharan, Frederick, Clees, O'Connor and Hemchandra2020). In all these cases, the frequency scales with the nozzle flow velocity, resulting in a constant Strouhal number throughout. The length scale used in the Strouhal number is therefore the centre-nozzle diameter, rather than the effective diameter, since the flow through the centre nozzle determines the behaviour of the system. This trend was formally shown in the work of Manoharan et al. (Reference Manoharan, Frederick, Clees, O'Connor and Hemchandra2020), wherein the PVC frequency depends only on the time-averaged flow state at a critical swirl number $S_{c}$, where vortex breakdown is first initiated for a given fixed mass flow rate and the swirl number $S$. The PVC emerges as a result of a supercritical Hopf bifurcation, creating a stable limit cycle oscillation in the flow. For high $Re$ swirl flows, $S_{c}$ for a fixed inner nozzle mass flow rate is a weak function of $Re$ (Escudier Reference Escudier1988). Therefore, the nearly constant $St$ in figure 6 suggests that $S>S_{c}$ for the inner nozzle flow for all values of air split greater than 0.3. Further, the nearly constant values of $\varLambda$ and $S_{o}$ in figure 4(c) suggest that $S_{c}$ is the same for all values of air split beyond 0.3, i.e. where the onset of PVC is observed – see figure 5. Thus, analysis in Manoharan et al. (Reference Manoharan, Frederick, Clees, O'Connor and Hemchandra2020) shows that, for a fixed value $S_{c}$ and $S$, the PVC oscillation amplitude and frequency must scale linearly with inner nozzle bulk flow velocity yielding a constant $St$, consistent with the result in figure 6.

Figure 6. Peak frequency and Strouhal number of Mode 1 as a function of air split for non-reacting conditions.
To understand the structure of the spatial oscillation field of this mode, we reconstruct velocity SPOD modes corresponding to each frequency peak at every air split condition. Figure 7 shows the transverse velocity component from the SPOD mode at the first peak frequency for three air splits (0.3, 0.5 and 0.8), as well as the closeness centrality parameter,  $C_{i}$ (see (2.3)), for four air splits (0.1, 0.3, 0.5 and 0.8). In the SPOD modes, the black dotted line represents $\bar {u}_{z}=0$ and demarcates the limits of the recirculation zone. The cases shown all have a strongly coherent transverse velocity oscillation at the base of the vortex breakdown bubble, showing that the flow precesses about the inner nozzle centreline. The mode also shows helical rollup along the inner shear layer. This spatial SPOD mode structure is characteristic of a PVC oscillation seen in past studies of this instability (Tammisola & Juniper Reference Tammisola and Juniper2016; Manoharan et al. Reference Manoharan, Frederick, Clees, O'Connor and Hemchandra2020; Datta et al. Reference Datta, Gupta, Chterev, Boxx and Hemchandra2021; Gupta et al. Reference Gupta, Shanbhogue, Shimura, Ghoniem and Hemchandra2021). The coherent rollup along the shear layer is due to the helical forcing imposed on the shear layers, as has been argued in recent studies (Oberleithner et al. Reference Oberleithner, Terhaar, Rukes and Paschereit2013; Manoharan et al. Reference Manoharan, Frederick, Clees, O'Connor and Hemchandra2020). Also, the fact that the coherent structures in the transverse velocity field are are symmetric about the central axis indicates that the shear layer rollup is radially asymmetric and helical. Thus, the mode shape and the helically paired vortical structures seen along the edge of the recirculation zone confirm that the coherent mode associated with the frequency peak in the modal spectrum in figure 5 is the manifestation of a global hydrodynamic limit cycle oscillation in the form of a PVC.

Figure 7. Spectral POD mode shapes corresponding to the PVC frequency (a–d) with the critical region identified by the weighted closeness centrality measure (e–h) from the complex network analysis computed for the transverse velocity component at various air splits.
Figure 7(e–h) shows regions of large  $C_{i}$ in the flow at every air split value. The large region located at $z\sim 20$ mm at the lowest air split of 0.1 corresponds to turbulence with some residual level of correlation. We can conclude this because the SPOD results for this case show no evidence of narrowband tonal oscillations – see figure 5). We also verify this region of large $C_{i}$ is driven by turbulence by re-computing the closeness centrality parameter after removing the nodes from the upstream critical regions at the base of the bubble and along the shear layers. When the nodes from these critical regions are eliminated, the amplitude of the closeness centrality parameter in the central downstream region remains unchanged. This lack of change indicates that the nodes in this downstream region are not correlated with the nodes at the base of the bubble or along the shear layer, but rather well correlated with other nodes in the same downstream region, as would be expected for turbulence but not a coherent oscillation. A more detailed explanation of this method is provided in the supplementary material. The emergence of a PVC around air split value of 0.3 results in the emergence of a new compact large $C_{i}$ value region at the upstream end of the vortex breakdown region. As air split increases, this second large $C_{i}$ region becomes dominant with increasing air split. The prior studies of Tammisola & Juniper (Reference Tammisola and Juniper2016) and Mukherjee et al. (Reference Mukherjee, Muthichur, More, Gupta and Hemchandra2021) identify wavemaker regions in swirl nozzle flows from linear global hydrodynamic stability analysis. We note here that the cluster of large $C_{i}$ at air split values of 0.3–0.5 in figure 7 are located at a similar position relative to the central recirculation zone. Also, slightly smaller values of $C_{i}$ are observed along the shear layers that align closely with the shear layer oscillations in the corresponding SPOD result. This similarity leads us to conclude that the region upstream of high $C_{i}$ at the upstream end of the breakdown bubble corresponds to the wavemaker of the PVC oscillation in the flow, for reasons discussed earlier in § 2.3.2. Note also that figure 7 shows that the position and shape of the wavemaker remains largely unchanged with increasing air split. This result lends further support to the fact that the dynamics of the PVC in the present experiment is governed mainly by the flow through the centre nozzle.
The results for  $C_{i}$ from the non-reacting result in figure 7 have several important general implications that we can learn from and apply to the reacting flow data next. Similarity between the spatial distributions of $C_{i}$ and SPOD mode oscillation amplitudes is an important indicator of a critical motion in the flow. Regions where $C_{i}$ and the SPOD spatial mode amplitude at a prominent frequency in the modal spectrum have similar spatial distributions are evidence of high-energy, highly correlated motions like vortex precession in the present case. This result is especially true because the method used to construct $C_{i}$ is applied on raw time-series data and is, prima facie, not spectrally selective. For the same reason, regions with large values of $C_{i}$ that do not align with coherent motions identified by SPOD mode shapes may have strong correlation but are not narrowband oscillations, as shown by the 0.1 air split result in figure 7. Put together, the information in the SPOD modes (narrow-band, high-energy fluctuations) and the closeness centrality parameter (high spatial and temporal correlation in a given region of space) provide important complementary insight into the motions in a flow and their origins.
4. Reacting flow dynamics
4.1. Time-averaged flow and flame profiles
The time-averaged streamwise velocity contours with streamlines, obtained from the sPIV measurement, for all reacting air split conditions are shown in figure 8. In all cases, a region of negative axial velocity, the central recirculation zone (CRZ), can be seen close to the axis of symmetry, similar to the structure seen in the non-reacting cases. As air split increases, this recirculation becomes stronger and more well defined. As in the non-reacting data, the red dotted curve is the  $\bar {u}_{z}=0$ contour showing the extent of the central recirculation zone. As the air split increases and the flow velocity through the central nozzle increases, the recirculation zone becomes more compact – see figure 8. The CRZ is quite wide for air splits of 0.2 and 0.25, whereas the CRZ width and overall shape for air splits of 0.35–0.5 are similar with the change in shape occurring at an air split of 0.3.

Figure 8. Time-averaged streamwise velocity component with streamlines (white solid lines) with the mean flame location ( $\bar {c}=0.5$) depicted by the solid black lines and the limits of recirculation zone ( $\bar {u}_z=0$) depicted as dotted red lines.
The black contour in figure 8 is the time-averaged progress variable  $\bar {c}=0.5$, which is indicative of the most likely position of the flame. Thus, these results show that at all air splits, the flame is anchored at the base of the CRZ, near the centreline of the flow. For air splits of 0.2–0.3, the distinctive ‘M’-shape of the $\bar {c}=0.5$ contour suggests that the flame not only stabilizes in the shear layer around the CRZ, but also in the outer shear layer formed by the outer nozzle jet and the ambient fluid. In these cases, air flow through the outer nozzle is more substantial and the shear generated in that region possibly helps with flame stabilization. For air splits larger than 0.3, the $\bar {c}=0.5$ contour shape suggests that the flame is no longer attached at the outer lip of burner due to the decrease in the outer nozzle mass flow rate. Note that in all cases, however, the flame structure near the CRZ is somewhat insensitive to air split. The time-averaged flame near the centreline matches the base of the zero axial velocity contour in that region for all air splits above 0.2.
Figure 9 shows the variation of the time-averaged axial velocity along the centreline and swirl number  $S_d$, as defined in (3.1), with downstream distance at every air split condition. Similar to the non-reacting case, figure 9(a) shows that as air split increases, the strength of recirculation increases because more air flows through the centre nozzle. Note that the streamwise position of the recirculation zone stays largely constant with varying air split. Additionally, figure 9(b) shows that the swirl number remains nominally unchanged by air split. These results mirror the non-reacting case for the air split range (0.2–0.5), although strong recirculation is observed at a lower air split in the reacting case (0.2) than in the non-reacting case (0.3). Enhancement of reverse flow velocity in the presence of a flame has been shown in both experimental (Syred & Beer Reference Syred and Beer1974) and theoretical (Rusak, Kapila & Choi Reference Rusak, Kapila and Choi2002) studies.

Figure 9. (a) Centreline time-averaged axial velocity, (b) swirl number and (c) backflow ratio and swirl number at the downstream location of minimum mean centreline axial velocity for all air split conditions.
Figure 9(c) shows the backflow ratio ( $\varLambda$) (3.2) and swirl number ( $S_{o}$) at the maximum axial backflow velocity location on the centreline, as was shown for the non-reacting conditions in figure 4. The trends for $\varLambda$ and $S_{o}$ between the non-reacting and reacting cases are very similar, recognizing that the air split range in the reacting case is half that of the non-reacting case. In both cases, $\varLambda$ increases from the onset of vortex breakdown until an air split of approximately 0.45 or 0.5, and then plateaus. Note that it is difficult to extrapolate a trend past an air split of 0.5 for the reacting case, but the trend ahead of that point is very similar to the non-reacting cases. The value of $\varLambda$ is less negative as a result of both the increasing axial velocity in the jet and the centreline recirculation velocity.
The values of  $S_{o}$ are quite different for the non-reacting and reacting cases. In the non-reacting case, $S_{o}$ initially decreases with increasing air split because the location of minimum centreline axial velocity moves downstream. Figure 4(b) shows that the swirl numbers are decrease as a function of downstream distance for the first 15 mm downstream of the nozzle exit as a result of the shear-induced decay of the swirl velocity. In the reacting cases, however, flow expansion due to the presence of the flame makes the structure of the vortex breakdown bubble and the flow around it more uniform at air splits above 0.2.
4.2. Spectral characterization of reacting flow
The time-averaged flow profiles indicate that increasing air split leads to strengthening of recirculation in the vortex breakdown region. This increase in recirculation strength can lead to changes in the hydrodynamic instability characteristics of the flow. This may be attributed to several fundamental mechanisms that cause the onset of local absolute instability in the flow as shown by prior fundamental local hydrodynamic stability studies (Gallaire & Chomaz Reference Gallaire and Chomaz2003; Manoharan et al. Reference Manoharan, Hansford, O'Connor and Hemchandra2015; Oberleithner et al. Reference Oberleithner, Stöhr, Im, Arndt and Steinberg2015). A key difference between the reacting and non-reacting cases in the present study, however, is the presence of thermoacoustic instability in the reacting case.
Combustor acoustic pressure power spectral densities at each air split condition are shown in figure 10. Pressure is measured using a probe placed through the end cap of the combustion chamber, which is located 120 mm from the dump plane. The power spectral density shows multiple distinctive peaks at each condition, indicating the presence of multiple oscillations. The presence of multiple frequencies is characteristic of reacting systems exhibiting hydrodynamic and thermoacoustic instability. In the lower air split cases, a strong peak can be seen at around 600 Hz (marked by a circle), which is identified to be due to acoustic pressure oscillations resulting from thermoacoustic instability.

Figure 10. Acoustic pressure spectra at each air split condition.
Acoustic modelling of the combustor rig using COMSOL (not shown), shows two acoustic modes with strong coupling between the combustor and the inner passage of the injector at 570 and 960 Hz, similar to the frequencies measured in the data. The COMSOL model assumed only two temperatures in the system for reactants and products, where the air in the inlet plenum is at the reactant temperature and the air in the combustor and exhaust section is at the equilibrium flame temperature of products corresponding to the overall global equivalence ratio. Also, we have assumed the boundary conditions upstream of the injector plenum and downstream of the exhaust as hard wall. These simplifications were needed as no acoustic boundary conditions were characterized in the experiment. Still, the modes captured in the model are in reasonable agreement with the peak frequencies marked with circles and triangles in figure 10, showing that the latter are thermoacoustic in origin.
As air split increases, the peak at around 600 Hz persists, but decreases in amplitude. The second peak at around 850 Hz is identified as the second thermoacoustic mode, marked with a triangle. Furthermore, harmonics of the dominant peaks can also be seen. Note also that the two peaks do not change appreciably with air split, as would be expected of an acoustic, rather than hydrodynamic, oscillations. We refer to the coherent flow oscillation modes induced by thermoacoustic oscillations at  $\sim$600 Hz as TA mode 1 and those at $\sim$900 Hz as TA mode 2 in the remainder of this paper. The flow oscillation mode associated with the PVC will be referred to simply as the PVC mode.
The spatial distribution of coherent flow oscillations at these acoustic frequencies are determined from corresponding velocity field measurements using SPOD. The modal spectra of the velocity data at every reacting air split condition are shown in figure 11. As before, the red curve in each plot depicts the highest-energy mode and the grey curves depict subsequent modes in order of decreasing energy. In all cases, the coherent content in the flow field measurements at the peak frequencies is captured mainly by the first SPOD mode. Therefore, we restrict our analysis to the mode shapes of the first SPOD mode alone.

Figure 11. Modal spectra of velocity fields obtained from spectral POD at all air splits for the reacting conditions.
Similar to the acoustic pressure spectra, multiple peaks can be seen at each condition, which indicates that there are multiple coherent oscillations in the flow. In order to understand the nature of the oscillation corresponding to every peak, the SPOD mode shapes of the first mode at the respective peak frequencies are reconstructed at every air split; these shapes will be discussed at length in this section. Using the mode shapes, we determined the source of each peak, where the PVC is indicated with a black star, TA mode 1 with a pink circle, and TA mode 2 with a blue triangle. Several modes at frequencies corresponding to the difference between the TA modes and the PVC are also seen and have been marked with green squares. We will refer to these modes hereafter as interaction modes.
The variation of the frequencies and amplitudes of the three basic flow oscillation modes with air split from SPOD are depicted in figure 12. From the plots in figure 12 and the modal spectra in figure 11, two important characteristics of the flow oscillations in the system can be observed. First, figure 12(a) shows that, while the frequency of the PVC mode increases linearly with increasing air split, the thermoacoustic frequencies remain largely the same at all air split conditions; this is further confirmation that TA modes 1 and 2 are indeed due to thermoacoustic oscillations. Second, figure 12(b) shows that increasing amplitude of the PVC corresponds to decreasing amplitude of TA mode 1; TA mode 2 is relatively weaker at all conditions. A key observation from figure 12 is that as the air split is increased, the PVC mode frequency sweeps through those of the two TA modes, the amplitude of the flow oscillation associated with the thermoacoustic mode closest to the PVC mode frequency is suppressed. For TA mode 1, this occurs at air splits of 0.35 and 0.4, and for TA mode 2, this occurs at an air split of 0.45 and 0.5. This result indicates that when present, the PVC not only dominates the velocity response of the flow but can also suppress the response of the flow to forcing imposed by thermoacoustic oscillations when their frequencies overlap.

Figure 12. Frequency (a) and amplitude (b) characterization of the three oscillation modes seen at each air split condition from SPOD.
The mechanism of the thermoacoustic mode suppression is investigated in two ways: through complex network analysis of the time-series velocity data coupled with the SPOD spatial mode shapes and through a weakly nonlinear theoretical analysis. First, we analyse the SPOD modes of the velocity field along with the results of the complex network analysis discussed in § 2. Figure 13 shows the SPOD spatial mode shapes based on the radial velocity component at three frequencies for each of the air split cases: the PVC frequency, the dominant TA frequency and the interaction, or difference, frequency of those two modes. In addition to these mode shapes, we show  $C_{i}$ maps from complex network analysis. The first column of results shows the mode shapes for the PVC, whose frequency increases with air split and increasing flow velocity through the central nozzle. In these modes, a region of high-amplitude oscillation is located at the base of the recirculation zone, indicative of the precession of the vortex core around the nozzle centreline. Symmetric disturbances in the shear layers emanate from this region, where, because this mode shape depicts the radial velocity component, $u_r$, the symmetric disturbances indicate asymmetric oscillations. The structure of these oscillations is very similar to the structure of the PVC mode in the non-reacting case, shown in figure 7. The main difference between the two is that in the reacting case, the shear layers spread at a wider angle than in the non-reacting case, a result of the gas expansion from the flame. Similar differences can be seen in the structure of the recirculation zone from the time-averaged flow profiles in figures 3 and 8.

Figure 13. Spectral POD mode shapes at PVC, thermoacoustic and interaction frequencies, and weighted closeness centrality measures computed for the radial velocity component at all air split conditions.
The next two columns show the mode shapes at thermoacoustic mode frequencies, which stay relatively constant as a function of air split. These mode shapes have strong fluctuations in the shear layers and no fluctuation in the CRZ of the flow. The fluctuations in the shear layer look asymmetric, but because the transverse velocity component is pictured, this structure is indicative of symmetric oscillations in the shear layer. This symmetric motion is the expected hydrodynamic response of the flow when forced by a longitudinal acoustic field that is nominally axisymmetric near the burner lip, as shown in previous swirling flow studies by O'Connor & Lieuwen (Reference O'Connor and Lieuwen2012). We will refer to this response as an  $m=0$ response, where $m$ is the azimuthal wavenumber of the flow disturbance. Analysis of the wavelength of the velocity disturbance as well as the bulk velocity confirm that this is the $m=0$ mode at both thermoacoustic frequencies, rather than a higher-order axisymmetric mode. The wavelength of the convective disturbances in the shear layers is shorter in TA mode 2 than TA mode 1 because TA mode 2 has a higher frequency. The impact of the symmetric oscillations on flame behaviour is discussed in detail in § 5.
The fourth column shows the mode shape for the interaction frequency between the PVC and the dominant thermoacoustic mode; no interaction modes are shown where the PVC is not present. Interaction frequencies, particularly sum and difference frequencies, commonly occur in the presence of nonlinear interaction between two periodic oscillations. In this case, the interaction frequency is the difference frequency between the PVC mode and the dominant TA mode. Spatially, the interaction mode shows up in the shear layers when the thermoacoustic mode is present (air splits of 0.3 and 0.35) and in the shear layers and the CRZ, particularly near the base, when the PVC mode is dominant (air splits of 0.4–0.5).
The final column shows the results of the complex network analysis for the reacting flow. We use these results in concert with the SPOD modes to propose a mechanism by which the thermoacoustic oscillations are suppressed by the PVC. In the non-reacting flow, the complex network analysis clearly identified the region of the PVC wavemaker, i.e. the region of the flow driving the self-excited oscillation. In a field where multiple oscillations are present, however, this time-series method provides valuable insight into the interaction between modes. Since the Pearson correlation coefficient is calculated in time, it naturally identifies close nonlinear coupling of oscillations with multiple frequencies, as is seen in the coupling between the PVC mode and the thermoacoustic mode. In the air split 0.2 case, the only oscillation present in the flow is TA mode 1. The  $C_{i}$ field closely mimics the 664 Hz SPOD mode, indicating strong velocity oscillations in the shear layers. Both the SPOD mode and the centrality parameter identify the well-known velocity-coupled mechanism by which the longitudinal acoustic mode drives vortical oscillations in the shear layer, which in turn drive flame response; evidence of direct flame response is discussed next in § 5. The oscillations appear at the thermoacoustic oscillation frequency in the SPOD mode, as SPOD captures the location of high-energy fluctuations at a given frequency. The oscillations in the $C_{i}$ field now identify flow regions that drive the hydrodynamic response of the shear layers. Coherent, axisymmetric vortex shedding in the shear layer results in regions of high coherence where vortices are shed. These two regions of high SPOD amplitude and $C_{i}$ overlap spatially just as was the case in the non-reacting data with the PVC.
Figure 12(b) shows that, for the air split 0.3 case, both PVC and TA mode 1 modal energy amplitudes are comparable. Therefore, the spatial distribution of  $C_i$, as shown in figure 13, is the result of both PVC and TA mode 1 oscillations. The somewhat different qualitative structure of $C_{i}$ for this case when compared with those for air splits greater than 0.3 is because of the presence of these two modes with similar amplitudes. The large region of high $C_{i}$ on the centreline for the air split 0.3 case is due to the PVC. We show this by comparing results for the spatial distribution of $C_{i}$ for reduced datasets that selectively exclude time-series contributions from the PVC and TA mode 1. The details of how this analysis is performed is discussed in § 1.2 of the supplementary material. This analysis shows that the spatial distribution of $C_{i}$ for the raw dataset and the reduced dataset that excludes the TA mode 1 contributions show the closest qualitative and quantitative match. Physically, this means that the PVC wavemaker region identified by complex network analysis is located further downstream of the centre nozzle for the air split 0.3 case than for the higher air splits. This location is the result of the lower mass flow rate through the centre nozzle as compared with the outer nozzle and the impact of that this fact has on flame attachment and flow field structure in the air split 0.3 case.
At an air split of 0.35, the PVC oscillation is strong, the TA mode 1 amplitude is small and the TA mode 2 amplitude is at its peak, according to the SPOD spectra in figure 11. Additionally, a strong interaction frequency appears in the spectrum at 293 Hz. The fourth row of figure 13 shows the SPOD modes at 508 Hz (PVC), 859 Hz (TA mode 2) and 352 Hz (PVC/TA2 difference frequency). The PVC mode shape shows asymmetric oscillations in the shear layer and at the base of the CRZ, whereas the thermoacoustic mode shape symmetric oscillations in the shear layers. The interaction mode shows evidence of both, with oscillations in the shear layers where the PVC and TA modes overlap, as well as motions at the base of the recirculation zone. The  $C_{i}$ field at this condition shows oscillations, both at the base of the recirculation zone as well as in the shear layers. Oscillations in these regions are indicative of both thermoacoustic and PVC oscillations, as is the interaction SPOD mode shape at 352 Hz. The structure of the closeness centrality parameter for the higher air splits where there is significant interaction between the PVC and the TA modes are similar; closeness centrality is higher in shear layer regions where the PVC and the thermoacoustic mode could interact.
As the air split increases, the PVC oscillation increases in strength and the thermoacoustic oscillations decrease in strength, resulting in the emergence of a high  $C_{i}$ region at the upstream end of the CRZ. This result is similar to what was observed with the emergence of PVC oscillations in the non-reacting flow. For example, at an air split 0.5, the TA mode 1 amplitude is quite low and the coherence of the SPOD mode at 586 Hz is relatively low; the oscillations diffuse quickly with downstream distance as compared with the low air splits where the axisymmetric oscillations from the TA mode 1 acoustic oscillations retain high coherence throughout the flow field. TA mode 2 at 918 Hz has a relatively weak amplitude, although the spatial coherence of the axisymmetric vortex shedding is visible. The interaction mode at 176 Hz between the PVC and TA mode 2 shows oscillations along both the centreline at the base of the recirculation zone and in the shear layers. The $C_{i}$ parameter again has a similar structure to the interaction mode, displaying a region of strong coherence at the base of the recirculation zone, as well as oscillations in the shear layer, indicative of interaction between the PVC and TA mode 2. These structures in both the interaction mode and $C_{i}$ are indicative of nonlinear interaction between the PVC and the thermoacoustic mode.
The second way in which we can understand the suppression of the thermoacoustic mode by the PVC is from a weakly nonlinear analysis of the flow governing equations. This analysis is presented in full detail in the supplementary material and is a generalization of the analysis of Manoharan et al. (Reference Manoharan, Frederick, Clees, O'Connor and Hemchandra2020) to include weak axisymmetric harmonic forcing. Here, the term ‘weak’ implies that the amplitude of the response of the flow, e.g. velocity amplitudes in shear layers, to forcing by thermoacoustic oscillations is much larger than the amplitude of the forcing itself. Note that in the present study SPOD modes in figure 13 for TA modes 1 and 2 show large-amplitude velocity oscillations along shear layers when compared with the velocity amplitudes elsewhere. This suggests that the flow in the present study is weakly forced by the thermoacoustic oscillation.
In this weakly forced limit, (2.19) in the supplementary material shows the solution to leading order for the oscillating flow field. This solution is comprised of several components as follows:  $m=1$ PVC mode, the $m=0$ hydrodynamic response to forcing and $m=1$ interaction modes. This solution structure qualitatively reflects the nature of oscillations observed in the present SPOD results from reacting flow experiments. Further, (2.9) and (2.10) in the supplementary material show the governing equations for the amplitudes of the hydrodynamic response ( $A_{o}$) to forcing by thermoacoustics and the PVC ( $A_{1}$), respectively. From these equations, it is clear that $A_{1}$ is formally independent of the forcing, consistent with the present experiments because the PVC once established is always present. The amplitude of the hydrodynamic response, on the other hand, depends on the amplitude of the PVC and a coupling coefficient $\beta _{A_{o}A_{1}}$, determined by the interaction between the PVC and the axisymmetric hydrodynamic mode – see (2.11)–(2.15) in the supplementary material. The discussion corresponding to (2.15)–(2.18) in the supplementary material shows that the value of $\beta _{A_{o}A_{1}}$ has an inverse dependence on the difference between the PVC and thermoacoustic mode frequencies. Thus, (2.13) in the supplementary material can explain suppression of the TA modes by the PVC when their frequencies are close as being due to the suppression of the shear layer response and, thereby, heat release rate oscillations driving the thermoacoustic oscillations.
Put together, the complex network analysis and the weakly nonlinear analysis both show the direct interaction of the PVC  $m=1$ mode with the acoustically excited $m=0$ mode, suppressing the action of the $m=0$ oscillations. These results also show that the thermoacoustic modes are not eliminated as a result of the flame moving away from a region of the acoustic mode where the Rayleigh criterion could be met. Because the $m=0$ oscillations are evident in both the experimental data and their suppression is evident through the impact of the $\beta _{A_{o}A_{1}}$ term in the theory, there is evidence to conclude that the PVC is indeed suppressing the acoustically induced symmetric motions.
5. Impact of hydrodynamics on flame behaviour
Given the changes in the flow dynamics with air split, we now consider the impact that these flow oscillations have on the flame behaviour. Figure 14 shows instantaneous images of the flame, obtained from the OH-PLIF images (depicted by the red colour field), and the fuel distribution, obtained from the acetone-PLIF images (depicted by the green colour field), at a low air split of 0.25 and a high air split of 0.5.

Figure 14. Instantaneous images of superimposed OH-PLIF (red) and acetone-PLIF (green) profiles at air splits 0.25 (a) and 0.5 (b). Videos of these conditions are provided in the supplemental material.
The instantaneous images illustrate the transition from symmetric motion (resulting from the thermoacoustic oscillation) to asymmetric motion (resulting from the PVC) as the air split increases. In the low air split case, symmetric vortex rollup along the flame surface can be seen. The fuel jets interact with the symmetric vortical structures, leading up to the onset of thermoacoustic instability as a result of periodic fluctuations in both the air and fuel flow rates. The high air split case, on the other hand, shows an asymmetric flame structure due to the helical shear layer structures generated by the PVC. These instantaneous images illustrate the influence that the PVC has on the macroscopic flame structure and fuel distribution in the system. In the absence of the PVC, the symmetric thermoacoustic mode governs the flame response at low air splits. However, at air splits greater than 0.3, as the PVC amplitude increases, the PVC governs the behaviour of the flame. This transition would suggest that the flame response is strongly coupled to the velocity field in the flow, indicating that in the presence of a sufficiently strong global hydrodynamic instability, the flame is less receptive to thermoacoustic oscillations. A more detailed analysis of the fuel-coupled response can be found in Karmarkar, Boxx & O'Connor (Reference Karmarkar, Boxx and O'Connor2022).
The results from the frequency-domain characterization of the flow field show that as the air split is increased, the PVC strengthens and eventually dominates the flow field dynamics. The instantaneous flame structures indicate that the flame response is highly coupled with the velocity response. In order to draw conclusions about the impact of the PVC on the flame dynamics, a more quantitative analysis is needed. We perform spectral POD on a composite field generated by combining the velocity fields from the PIV measurements and OH-PLIF measurements to extract motions that are correlated between the flow field and the flame. The goal of this analysis is to identify similarities in the frequencies and structure of the oscillations in the PIV and OH-PLIF fields rather than gain any quantitative insight into the correlated fields. The details of the method are described in § 2. The modal spectra obtained from this decomposition of the composite field are shown in figure 15 for every air split condition. The peak frequencies in the modal spectra of composite field are very similar to those seen in the velocity-only decomposition; the PVC, the thermoacoustic modes, and the difference frequency mode generated as a consequence of nonlinear interactions are marked using the same markers as figure 11. This similarity with the velocity-only field indicates that the dominant coherent oscillations are correlated across the flame and flow field since coherent oscillations in the flow field are strongly linked to the structure of the flame and, consequently, the nature of heat release. When the PVC mode is present, it is the strongest oscillation in the field that shows strong correlation between the flow field and the flame. Furthermore, in cases where the PVC mode approaches the thermoacoustic mode frequency, the amplitude of the thermoacoustic mode is significantly damped.

Figure 15. Modal energy spectra obtained from spectral POD on the composite velocity and OH-PLIF field.
To illustrate the nature of the correlated motions between the flame and flow field, we extract the spatial mode shapes at the peak frequencies for the velocity and flame motions. Figure 16 shows the spatial mode shapes associated with the radial velocity component ( $u_r$) and the OH-PLIF signal ( $\psi _{OH}$) extracted at the frequency of the dominant peak for air splits of 0.2 and 0.4. In the low air split case (air split of 0.2), the dominant mode is the first thermoacoustic mode at a frequency of 664 Hz and the mode shapes corresponding to this mode are symmetric in both the velocity field and the OH-PLIF field. The wavelength of oscillation in the velocity field and flame are the same, and oscillations are both concentrated around the shear layer where vortex rollup is present in the velocity field and the flame stabilizes. The interaction between the shear layer oscillations and the flame are evident from the comparisons of these mode shapes. As an air split of 0.4, the strongest mode is now the PVC at a frequency of 605 Hz (see spectra in figure 15), and the mode shapes corresponding to this mode are predominantly asymmetric in both the flow field and flame oscillations. Again, the wavelength of oscillation in the velocity field and the flame are the same, and the flame oscillations are centralized at the base of the recirculation zone where the flame is anchored and the PVC wavemaker is located. Like the instantaneous snapshots shown in figure 14, these mode shapes illustrate that the flame and the flow field are strongly coupled. As the strength of the PVC increases with increasing air split, the oscillations in the flame transition from predominantly symmetric to predominantly asymmetric.

Figure 16. Spatial mode shapes for the radial velocity field and the OH-PLIF signal field obtained from composite spectral POD at the peak frequencies of leading modes for two air split conditions.
6. Discussion
Analysis of both the non-reacting and reacting data shows that the PVC has a controlling influence on the dynamics of the flow, including the strength of other modes of the system. Comparison between the non-reacting and reacting flow structure and dynamics indicates that both behave similarly with air split and that the velocity through the central jet controls the flow behaviour. First, comparison of figures 3 and 8 shows that the flow structure is similar in both cases, although offset in ‘air split space’ because of the impact of heat release on the structure of the CRZ (Rusak et al. Reference Rusak, Kapila and Choi2002). At lower air splits, the CRZ is wide and recirculation strength is relatively low, but then after a critical air split (0.6 for non-reacting and 0.35 for reacting), the structure of the recirculation zone is relatively unchanged. Furthermore, as seen in figure 17, the spatial structure of the PVC oscillation mode is very similar between the reacting and non-reacting conditions for the air split of 0.4.

Figure 17. Transverse velocity mode shapes of the first SPOD mode and the weighted closeness centrality fields for both reacting (red) and non-reacting (blue) conditions at the air split of 0.4. The black dotted line represents the limits of the recirculation zone ( $\bar {u}_z=0$).
Figure 17 shows a direct comparison between reacting and non-reacting conditions at the first SPOD mode at an air split of 0.4. From the modal spectra of the leading mode, it can be seen that the dominant peak frequencies of the reacting and non-reacting cases are very close and the first harmonics overlap as well. From the transverse velocity mode shapes, shown on the right, it can be seen that the mode shape represents a predominantly asymmetric oscillation mode, with a strong coherent centre at the base and helical paired vortical structures, which are indicative of a PVC mode. Two key differences between the mode shape corresponding to the non-reacting case (top), and the mode shape corresponding to the reacting case (bottom) are evident. First, the vortical structures in the reacting case are more spatially diffuse, whereas the structures in the non-reacting case are more compact. This difference is presumably a consequence of gas expansion, causing vortex dilatation in the reacting case. Second, the spatial wavelength in the reacting case is greater than in the non-reacting case. This effect is also a consequence of gas expansion created by the presence of a flame since the spatial wavelength is dependent on the velocity with which the vortical structures are convected, and gas expansion leads to higher convection velocities. Further conclusions can be drawn by comparing the closeness centrality parameter from the complex network representation of the flow, computed from time-series data in both non-reacting and reacting cases at this same air split condition. In both cases, there is a region of high closeness centrality at the base of the recirculation zone, which is where the wavemaker for the PVC would be expected to be located. Additionally, coherent oscillations in the shear layer are present in both cases as a result of the shear layer oscillations excited by the PVC.
This similarity in flow structure between the non-reacting and reacting cases has significant implications for understanding the dynamics of the PVC. Figure 18(a) shows the PVC frequencies for each air split condition for both reacting and non-reacting measurements. In both cases, the PVC frequency increases linearly with air split, while the Strouhal number stays constant; this result is consistent with previous studies. Further, the frequencies are almost identical in the non-reacting and reacting cases at each air split where data are available for both conditions. Comparisons show that the backflow ratio (figure 18b) and swirl number at the maximum backflow velocity location (figure 18c) are similar, but not identical, in these two cases. Trends in the backflow ratio are similar, but the backflow ratio of the reacting case is higher, a result of the gas expansion due to the flame. Put together, these results indicate that, in this configuration, the frequency of the PVC is controlled only by the stability of the base flow and is independent of the thermoacoustic modes that are present.

Figure 18. (a) Variation of PVC frequency with air split, (b) variation of backflow ratio with air split and (c) variation in swirl number at the minimum centreline velocity location for both reacting and non-reacting conditions.
The similarity of the PVC dynamics in the non-reacting and reacting flows differs from existing literature that showed either a significant change in or complete suppression of PVC oscillations in the presence of a flame. For example, Selle et al. (Reference Selle, Lartigue, Poinsot, Koch, Schildmacher, Krebs, Prade, Kaufmann and Veynante2004) showed in a large eddy simulation (LES) study validated with experimental results on a swirling combustor, that while a strong PVC is observed in cold flow, the PVC disappears when combustion occurs. Roux et al. (Reference Roux, Lartigue, Poinsot, Meier and Bérat2005) showed, also using LES, that a PVC is suppressed in the presence of combustion and acoustic modes dominate the flow field oscillations. Oberleithner et al. (Reference Oberleithner, Terhaar, Rukes and Paschereit2013) and Manoharan et al. (Reference Manoharan, Hansford, O'Connor and Hemchandra2015) discuss the suppression of a PVC in the presence of a flame and suggest that the density gradient in the inner shear layer suppresses local absolute instability of helical modes and can therefore cause a helical global instability such as the PVC to be suppressed. However, other studies show the PVC is unaffected by the presence of a flame (Steinberg et al. Reference Steinberg, Boxx, Stöhr, Carter and Meier2010; Moeck et al. Reference Moeck, Bourgouin, Durox, Schuller and Candel2012; Taamallah et al. Reference Taamallah, Shanbhogue and Ghoniem2016), similar to the present study. Together with the fact that the PVC wavemaker is located at the upstream end of the bubble, these facts suggest an alternative explanation that the suppression of the PVC by the flame depends on how strongly the gas expansion and baroclinic torque imposed by the flame-induced density gradient is able to interfere with the internal flow feedback processes in the wavemaker region. This mechanism would also explain why PVCs arise in reacting flows when density gradients are sufficiently separated from the wavemaker region. This separation typically happens when the flame is completely or partially lifted from the dump plane and, thus, the flow region at the upstream end of the bubble behaves essentially like it would in a non-reacting flow. Therefore, if the non-reacting flow in this configuration has a PVC, so would the reacting flow when the flame is clear of the wavemaker region. This observation is consistent with the emergence of the PVC in a reacting flow reported by Oberleithner et al. (Reference Oberleithner, Stöhr, Im, Arndt and Steinberg2015) and Datta et al. (Reference Datta, Gupta, Chterev, Boxx and Hemchandra2021) when flames are lifted and stabilized downstream of the wavemaker region at the upstream end of the bubble.
7. Conclusions
This study considers the behaviour of a PVC in both non-reacting and reacting flows. The PVC dynamics is not substantially different between these two cases and a complex network representation of the flow field is used to identify the wavemaker region at both conditions. In the non-reacting case, the flow structure and PVC dynamics are governed by the air split, which is indicative of the flow velocity through the centre nozzle. As the air split increases, the PVC frequency and strength increase, although the Strouhal number stays constant throughout. The flow structure and PVC dynamics are similar in the reacting case. However, when the PVC frequency approaches that of the thermoacoustic instability, a nonlinear coupling between the helical PVC motion and the axisymmetric shear layer response leads to suppression of the axisymmetric mode and hence the velocity-coupled thermoacoustic instability. The appearance of critical regions associated with flow motions other than the PVC wavemaker in the complex network representation as well as a more traditional weakly nonlinear theory that provides results showing this this nonlinear coupling suggests the above mechanism for the suppression of thermoacoustic oscillations.
In addition to this main conclusion, this work has contributed a number of new results in the PVC literature. First, the non-reacting and reacting PVC dynamics are similar because the flame does not directly intersect the wavemaker region driving the PVC. Furthermore, we show that the flame structure is significantly instantaneously impacted by the presence of a PVC. In particular, the flame surface oscillation transitions from symmetric to asymmetric motions in the presence of a strong PVC, and a combined SPOD analysis of the velocity field and OH-PLIF imaging showed strong correlation between the velocity field and flame motions.
Second, the impact of the PVC on shear layer behaviour is consistent with many previous studies (Frederick et al. Reference Frederick, Manoharan, Dudash, Brubaker, Hemchandra and O'Connor2018; Moeck et al. Reference Moeck, Bourgouin, Durox, Schuller and Candel2012; Oberleithner et al. Reference Oberleithner, Sieber, Nayeri, Paschereit, Petz, Hege, Noack and Wygnanski2011; Manoharan et al. Reference Manoharan, Frederick, Clees, O'Connor and Hemchandra2020), where the shear layers surrounding the vortex breakdown region respond to the flow helical flow oscillations driven by the wavemaker region at the base of the CRZ. The use of a complex network representation of the flow and identification of the wavemaker by identifying nodes with high weighted closeness centrality (Opsahl et al. Reference Opsahl, Agneessens and Skvoretz2010) is a new result. The location and shape of the wavemaker region thus identified qualitatively matches prior results for wavemaker regions identified using traditional stability analysis in other swirl nozzle flow studies (Tammisola & Juniper Reference Tammisola and Juniper2016; Mukherjee et al. Reference Mukherjee, Muthichur, More, Gupta and Hemchandra2021). While stability analysis can be challenging to apply to complicated reacting flows in industrially relevant scenarios, the present results suggest that complex network representation of the flow constructed using available time-resolved measurements of LES simulations of these flows can provide similar insight.
Finally, the insights obtained from this analysis have significant implications for the suppression of thermoacoustic oscillations in gas turbine combustors. Work by first Mathews et al. (Reference Mathews, Hansford and O'Connor2016) and then Frederick et al. (Reference Frederick, Manoharan, Dudash, Brubaker, Hemchandra and O'Connor2018) showed, in a non-reacting, variable swirl number jet configuration, that the presence of the PVC suppressed the response of the shear layer to external forcing. Calculation of the spatial growth rate of the axisymmetric shear layer instability in Frederick et al. (Reference Frederick, Manoharan, Dudash, Brubaker, Hemchandra and O'Connor2018), indicated that the PVC caused the growth rate to become negative, resulting in no response at the forcing frequency. This result is generally supported by our more recent formal nonlinear asymptotic analysis of the dynamics of a forced axisymmetric jet with a helical self-excited instability, as well as recent experimental results from Lückoff et al. (Reference Lückoff, Kaiser, Kaiser, Paschereit and Oberleithner2021). We had suggested in Frederick et al. (Reference Frederick, Manoharan, Dudash, Brubaker, Hemchandra and O'Connor2018) that the results therein may be extended to reacting situations as long as the PVC could be sustained. The present results and theoretical analysis, further support this hypothesis by showing that the nonlinear coupling between the PVC and axisymmetric hydrodynamic modes can lead to axisymmetric forced response suppression, and hence suppression of the velocity-coupling pathway for thermoacoustic instability. This result suggests that ‘designing’ a PVC in a combustor flow field at frequencies close to those of a longitudinal thermoacoustic mode could provide one possible passive mechanism to suppress thermoacoustic oscillations.
Supplementary material and movies
Supplementary material and movies are available at https://doi.org/10.1017/jfm.2022.610.
Funding
This work was supported by National Science Foundation grant CBET-1749679 and Air Force Office of Scientific Research grant FA9550-16-1-0044. Any opinions, findings and conclusions or recommendations expressed in this material are those of the authors and do not necessarily reflect the views of the National Science Foundation or the Air Force Office of Scientific Research. The assistance of Dr J. Yoon (ADD, Republic of Korea), Dr C. Noren (AFRL, USA), Dr C. Carter (AFRL, USA) and Dr K.-P. Geigle (DLR, Germany) with the set-up and operation of the experimental apparatus described in this paper are gratefully acknowledged. Thanks to E. Snelling (Penn State) for helping with the COMSOL model set-up.
Declaration of interests
The authors report no conflict of interest.


 Open access