


1. Introduction
The growth and flow onset of bubbles in a yield stress fluid are studied in this paper. In such fluids the material flows only if the imposed stress surpasses the yield stress (Balmforth, Frigaard & Ovarlez Reference Balmforth, Frigaard and Ovarlez2014). In the context of bubbles, one might expect that stresses arise from both surface tension and buoyancy effects, and are resisted by the yield stress of the material. The shape and position of the yield surfaces, i.e. the boundaries between the yielded and unyielded regions, at the onset of motion are a priori unknown, and hence determining the onset of motion is non-trivial (Dubash & Frigaard Reference Dubash and Frigaard2004).
Applications are many. Bubble formation and consequent gas emission are common in natural geological materials such as flooded soils and terrestrial sediments via biodegradation, but also in man-made ponds such as oil sands tailings ponds (Valentine Reference Valentine2011; Boudreau Reference Boudreau2012; Small et al. Reference Small, Cho, Hashisho and Ulrich2015; Johnson et al. Reference Johnson, Fairweather, Harbottle, Hunter, Peakall and Biggs2017). Gas bubble generation and accumulation occurs in nuclear waste slurries, through radiolysis (Gauglitz et al. Reference Gauglitz, Rassat, Bredt, Konynenbelt, Tingey and Mendoza1996; Corkhill & Hyatt Reference Corkhill and Hyatt2018). Gas bubbles in cosmetic and pharmaceutical products can often be undesirable due to effects on emulsion stability, visual appearance and in some cases, due to triggering microbial growth (Lin Reference Lin1970). In the food industry, bubble entrapment is exploited to slow down the process of melting of frozen desserts, as well as to modify the texture and consequently the flavour of food products (Luyten, Plijter & Van Vliet Reference Luyten, Plijter and Van Vliet2004; Sofjan & Hartel Reference Sofjan and Hartel2004). Entrapment of bubbles in concrete increases freeze–thaw durability and improves its workability (Kosmatka, Panarese & Kerkhoff Reference Kosmatka, Panarese and Kerkhoff2002). A common aim in the above applications is to achieve a controlled bubble entrapment or release. A single bubble in a yield stress fluid can be considered as the simplest idealization of this entrapment–release scenario.
The material used here is a Carbopol gel, widely known as a model yield stress fluid with negligible thixotropic behaviour. Below the yield stress, elastic deformation occurs: a creep test is a common method for evaluating the yield stress. This material has been used in the majority of experimental studies of bubble propagation in yield stress fluids (Dubash & Frigaard Reference Dubash and Frigaard2007; Sikorski, Tabuteau & de Bruyn Reference Sikorski, Tabuteau and de Bruyn2009; Mougin, Magnin & Piau Reference Mougin, Magnin and Piau2012; Lopez, Naccache & de Souza Mendes Reference Lopez, Naccache and de Souza Mendes2018; Zare & Frigaard Reference Zare and Frigaard2018; Pourzahedi, Zare & Frigaard Reference Pourzahedi, Zare and Frigaard2021). However, it should be pointed out that both elastic and viscoplastic descriptions of bubble entrapment exist in the literature. Broadly speaking, the former have been used more for materials that may be considered weak solids, such as soils and thick sediments, e.g. Algar, Boudreau & Barry (Reference Algar, Boudreau and Barry2011), Valentine (Reference Valentine2011) and Boudreau (Reference Boudreau2012). In these models, often fracture of the gel occurs and is associated with onset of motion. In other applications, the material used is a colloidal suspension or polymeric gel that is fluid-like: it does not fracture, but yields plastically and flows. Carbopol is a model fluid for the latter behaviour.
The specific motivation of this work stems from gas emissions from oil sands tailings, which are a by-product of the oil sands production process. During the bitumen froth treatment process, naphthenic solvents are added to the bitumen. A significant fraction of the naphtha cannot be removed during naphtha recovery. Thus, a mixture of coarse sand, fine clays, slit, residual bitumen and naphtha is transported to the tailing ponds. Coarse silica sands capture a portion of the fines and settle easily to form the bottom layer of the tailing ponds. The remaining fines suspend in the pond water and form a suspension termed fine fluid tailings (FFT). Over several years, this layer of fines degrades into mature fine tailings (MFT), which is expected to remain stable up to 150 years (Small et al. Reference Small, Cho, Hashisho and Ulrich2015). Anaerobic microorganisms contribute to degrading residual naphtha hydrocarbons and naphthenic acids within the FFT/MFT layers leading to the generation of gas bubbles (Chi Fru et al. Reference Chi Fru, Chen, Walshe, Penner and Weisener2013; Small et al. Reference Small, Cho, Hashisho and Ulrich2015). Growth of the bubbles due to continuous microbial degradation and/or daily/seasonal cycles of temperature/pressure eventually leads to the release of the bubbles and gas emission from these ponds. Rheologically, the FFT/MFT layers have been characterized as yield stress fluids (Derakhshandeh Reference Derakhshandeh2016), which explains focus of this study.
During the last decades, many theoretical and computational studies have been performed focused at determining the yielding surfaces around moving objects in yield stress fluids (Chhabra Reference Chhabra2006). The majority of this work addresses non-zero flow around solid objects. However, a few papers have directly addressed the question of flow onset and trapping (Beris et al. Reference Beris, Tsamopoulos, Armstrong and Brown1985; Putz & Frigaard Reference Putz and Frigaard2010; Chaparian & Frigaard Reference Chaparian and Frigaard2017), wherein the theoretical framework is similar to that for bubbles. For simple yield stress fluids, onset and trapping are the same, determined by a critical dimensionless yield number  $Y=Y_c$. Here $Y$ reflects the balance of fluid yield stress to buoyancy generated stresses. The critical value $Y_c$, can be interpreted as indicative of the related force balance: the yield stress acts over the yield surface at the onset of motion and the buoyancy force is that of the enclosed material. Chaparian & Frigaard (Reference Chaparian and Frigaard2017) and subsequent studies suggest that the yield surface positions and $Y_c$ are strongly dependent on particle shape.
While the theoretical picture for bubble onset/trapping is similar (Dubash & Frigaard Reference Dubash and Frigaard2004), surface tension must now be accounted for. In a non-zero flow the bubble shape changes. Tsamopoulos et al. (Reference Tsamopoulos, Dimakopoulos, Chatzidai, Karapetsas and Pavlidis2008) and Dimakopoulos, Pavlidis & Tsamopoulos (Reference Dimakopoulos, Pavlidis and Tsamopoulos2013) studied the transient flow around an axisymmetric bubble rising in a yield stress fluid, and determined the evolution of the shape and velocity of the bubble. They reported the steady shape and rise velocity of bubbles as a function of governing dimensionless parameters including Archimedes, Bond and yield numbers. From the steady flows they managed to approximate the static limits by assessing when the steady flow velocity approached zero. Tripathi et al. (Reference Tripathi, Sahu, Karapetsas and Matar2015) studied similar flows, but explicitly focused on the transients. An alternative to the transient computation, for the onset/trapping question, is to specify a fixed shape and compute whether or not the bubble is static. On adjusting the yield or buoyancy stress,  $Y$ is adjusted to find the limit $Y_c$ for the specific shape. The advantage of such an approach is speed and the consequent ease of using numerical methods that directly compute static regions. Pourzahedi et al. (Reference Pourzahedi, Chaparian, Roustaei and Frigaard2022) performed a comprehensive study of the yield limit for bubbles with fixed elliptical shapes. The thinner and longer the bubble is (i.e. prolate), the larger is $Y_c$. The role of surface tension on onset/trapping was also studied for the same range of shapes. For both extreme prolate and oblate shapes, surface tension becomes dominant near the tips (maximal curvature), leading to local yielding (Pourzahedi et al. Reference Pourzahedi, Chaparian, Roustaei and Frigaard2022). While such studies allow broad parametric study of onset/trapping for $Y < Y_c$, the computed flows around the bubbles have little relevance, due to changes in bubble shape, in contrast to the case for solid particles.
Experimentally, deviation from ideal viscoplastic behaviour is always present (Balmforth et al. Reference Balmforth, Frigaard and Ovarlez2014; Frigaard Reference Frigaard2019; Daneshi et al. Reference Daneshi, MacKenzie, Balmforth, Martinez and Hewitt2020), and not accounted for in the above studies. Experimental observations find fore-and-aft asymmetries in flowing bubbles, even at low  $Re$, characterized by an inverted teardrop shape of the bubble as it rises and a negative wake at the rear of the bubble (Dubash & Frigaard Reference Dubash and Frigaard2007; Sikorski et al. Reference Sikorski, Tabuteau and de Bruyn2009; Mougin et al. Reference Mougin, Magnin and Piau2012; Lopez et al. Reference Lopez, Naccache and de Souza Mendes2018; Zare & Frigaard Reference Zare and Frigaard2018; Pourzahedi et al. Reference Pourzahedi, Zare and Frigaard2021). These features are attributed to viscoelastic behaviour of the fluid around the bubble (Moschopoulos et al. Reference Moschopoulos, Spyridakis, Varchanis, Dimakopoulos and Tsamopoulos2021a). For Carbopol, small amplitude oscillatory shear tests confirm the elastic behaviour of the material below the yield point. At very low strains the elastic modulus is insensitive to the deformation and the material exhibits linear elastic behaviour (Gutowski et al. Reference Gutowski, Lee, de Bruyn and Frisken2012). At larger deformations and in particular near the yield point, the material shows a more complex behaviour in terms of hysteresis and irreversibility (Uhlherr et al. Reference Uhlherr, Guo, Tiu, Zhang, Zhou and Fang2005; Putz et al. Reference Putz, Burghelea, Frigaard and Martinez2008; Poumaere et al. Reference Poumaere, Moyers-González, Castelain and Burghelea2014; Daneshi et al. Reference Daneshi, MacKenzie, Balmforth, Martinez and Hewitt2020). Nonlinear elastic behaviour of the material precedes yielding. Recent rheological studies of Carbopol gels highlight unrecoverable strains below the yielding point, and link these to either viscous contributions in the viscoelastic regime below the yielding point or to plastic contributions in the intermediate solid–fluid coexistence regime (Donley et al. Reference Donley, Singh, Shetty and Rogers2020; Kamani, Donley & Rogers Reference Kamani, Donley and Rogers2021). Another complexity of Carbopol gel (and similar fluids) arises from residual stresses stored in the material in relaxation after flow cessation (Lidon, Villa & Manneville Reference Lidon, Villa and Manneville2017).
Flow onset is most easily studied experimentally using trapped bubbles. Bubble growth may be physically or chemically instigated, with bubble rise (flow onset) occurring as the buoyancy becomes sufficiently dominant over restraining forces. This implies that the growth of trapped bubbles and their shape at the onset of motion are linked to the rheology of the gelled material, as reported in Sun et al. (Reference Sun, Pan, Zhang, Zhao, Zhao and Wang2020). Thus, theoretical descriptions and associated numerical calculations (based on ideal viscoplastic fluids), may or may not be adequate to quantify the flow onset. Although (non-ideal viscoplastic) rheological behaviours in this gelled regime have been well documented in the literature, their effects on bubble growth and onset of motion have not been studied, which is addressed here. The main focus of this study is on determining the shape and size of the bubble at the onset of motion and investigating how these parameters are linked to the rheology of the gel. A vacuum chamber system equipped with an imaging set-up is used to control the size of bubbles trapped in the fluid. First, motion onset as a result of bubble size increase is studied. Then the dynamic response of the gel to cyclic growth and retraction of the bubble is examined. Aside from the question of bubble motion, this provides further insight into understanding the complex rheological behaviour of the gel below the yielding point.
An outline of the paper is as follows. The experimental methodology is detailed in § 2. The rheological properties of Carbopol gels and details of the experimental set-up used in this study as well as a systematic assessment of the validity and reliability of the results are included in this section. The experimental results for the onset of motion of bubbles in gels with different concentrations are outlined in § 3.1. The results obtained for the dynamic response of the bubble and the gel to the cyclic variation of the vacuum pressure are reported in detail in § 3.2. The study is wrapped up with some concluding remarks regarding the findings and future directions (§ 4).
2. Methodology
As discussed in § 1, the objective of the paper is to explore the mechanism governing onset of motion of bubbles in yield stress fluids. The basic method is to start with a small static bubble and systematically increase its volume by controlling the ambient pressure, until the bubble rises. Carbopol solutions are used as a model yield stress fluid. These have high optical transparency and negligible thixotropic or ageing behaviour.
2.1. Fluids and rheometry
Aqueous suspensions of Carbopol 940 with various weight concentrations ranging from 0.1 % to  $0.4\,\%$ were used. Mixing yield stress fluids and preparing a homogeneous solution in large volumes can be challenging, particularly for higher yield stresses. Hence, we prepared individual batches of 5 l using the following protocol, before combining the batches.
First, Carbopol powder was dispersed in 5 l of distilled water. The mixture was stirred gently with a propeller mixer until a homogeneous dispersion was obtained. As the Carbopol powder is dissolved in the water it causes the release of  ${\mathrm {H^{+}}}$ ions and the ${\mathrm {pH}}$ of the solution drops. The dispersion is neutralized by adding an appropriate amount of 5 % aqueous sodium hydroxide ( ${\mathrm {NaOH}}$) to it.
Second, to homogenize the Carbopol solution, it was mixed for 48 hours at a mixing rate that depended on the gel concentration: 350 r.p.m. for  $0.1\,\%\,{(\mathrm {wt}\,\mathrm {wt}^{-1})}$ Carbopol; 400 r.p.m. for $0.15\,\%\,{(\mathrm {wt}\,\mathrm {wt}^{-1})}$; 500 r.p.m. for $0.2\,\%\,{(\mathrm {wt}\,\mathrm {wt}^{-1})}$; 600 r.p.m. for $0.3\,\%\,{(\mathrm {wt}\,\mathrm {wt}^{-1})}$; 650 r.p.m. for $0.4\,\%\,{(\mathrm {wt}\,\mathrm {wt}^{-1})}$. The mixing rate was adjusted such that the material is drawn from the top to the bottom of the bucket and vice versa, to provide full and efficient mixing. The mixing impeller we used is a three-bladed propeller stirrer with soft blades which provided an up and down flow pattern with minimum cutting. Note that mixing the solution at a high mixing intensity using sharp blades may cut the polymers strongly and lead to a permanent decrease in the final viscosity of the solution, as well as significant unwanted thixotropic behaviour (Dinkgreve et al. Reference Dinkgreve, Fazilati, Denn and Bonn2018; Daneshi et al. Reference Daneshi, MacKenzie, Balmforth, Martinez and Hewitt2020). For each set of tests, around 10 l of Carbopol solution was required, i.e. two batches.
The rheological properties of the Carbopol solutions were measured using a Kinexus Ultra $^+$ rotational rheometer (Netzsch) with the angular resolution of $0.01\, {\mathrm {mrad}}$ and torque resolution of $0.1\,\mathrm {n}\,\mathrm {Nm}$. All the rheological measurements were performed using a parallel plate geometry with a diameter of $60\,\mathrm {mm}$ and a gap width of $1\,{\mathrm {mm}}$. Carbopol, like many other yield stress fluids, exhibits wall-slip behaviour which might significantly affect its rheological measurements (Bonn et al. Reference Bonn, Denn, Berthier, Divoux and Manneville2017; Daneshi et al. Reference Daneshi, Pourzahedi, Martinez and Grecov2019). To minimize slip, the surfaces of the parallel plates were covered with sandpaper with an average roughness of $46\,\mathrm {\mu }{\rm m}$. To ensure a reproducible initial state, prior to each test the material is presheared at $30\,\mathrm {s}^{-1}$ for $100\,{\mathrm {s}}$ followed by a rest period of $100\,{\mathrm {s}}$.
Two types of rheological tests were performed: a stress-controlled ramp-up and ramp-down test and a controlled strain amplitude sweep test. A representative flow curve for  $0.15\,\%\,(\mathrm {wt}\,\mathrm {wt}^{-1})$ Carbopol gel is shown in figure 1. The decreasing stress part of the flow curve can be modelled well by the Herschel–Bulkley constitutive law. The rheological parameters of the fluids, as obtained by fitting the Herschel–Bulkley equation to the downward curve, are reported in table 1. A comparison between the ramp-up and down data does not reveal any discernible sign of hysteresis except at low strain rates, near the yielding point. This is indicative of significant elastic behaviour below the yield point.

Figure 1. Rheological curves for  $0.15\,\%\,{(\mathrm {wt}\,\mathrm {wt}^{-1})}$ Carbopol, from a shear-rate ramp-up (black dots) and then ramp-down (red dots) in a roughened parallel-plate rheometer. There is no discernible thixotropic behaviour over most of the range of strain rate. It is only at stresses very close to the yield stress that any rheological hysteresis is visible. The inset shows the elastic modulus, $G^\prime$ (black triangles), and viscous modulus, $G^{\prime \prime }$ (red triangles), as functions of strain amplitude for Carbopol. The data were obtained from an amplitude sweep at frequency of $2\,{\mathrm {rad}\,\mathrm {s}^{-1}}$. Approximately below $\gamma =0.1\,\%$ both the elastic and viscous moduli remain constant and the material shows linear behaviour. The waiting time for each point on the curve is one minute.
Table 1. Herschel–Bulkley fits of the Carbopol solutions. Also listed are shear storage and loss moduli ( $G'$ and $G''$) measurements taken from small amplitude oscillatory rheometry at a frequency of 2 Hz and a strain amplitude of $\gamma =1\,\%$. Below $\gamma =1\,\%$ the two moduli are found to be independent of $\gamma$.

An amplitude strain sweep test was used to characterize the dynamic response of the gels. Storage and loss moduli are shown in the inset of figure 1 also for  $0.15\,\%\,{(\mathrm {wt}\,\mathrm {wt}^{-1})}$ Carbopol. As is clear from this figure, the material shows a linear viscoelastic response over small strains where both the storage and loss moduli remain constant. The averaged values of these moduli over this linear region are listed in table 1 for the different Carbopol gels used in our tests. Over the linear regime the storage modulus is an order of magnitude larger than the loss modulus. This suggests a linear viscoelastic relaxation time below one second over this linear regime. On increasing the strain amplitude beyond 1 %–2 %, the simple linear elastic model becomes invalid and the loss modulus becomes more significant.
2.2. Experimental design
An acrylic chamber with length and width of  $L,W =18\,{\mathrm {cm}}$ and height of $H = 56\,{\mathrm {cm}}$, partially filled with a Carbopol solution, was used in our experiments. The chamber was equipped with a pressure control unit including a vacuum pump, a pressure sensor, air-inlet and air-exhaust solenoid valves. The vacuum pump was used to depressurize the chamber, thus increasing the size of bubbles. The pressure transducer was used to monitor the static air pressure above the Carbopol column, and electric solenoid valves were used to close the chamber and minimize leakage once the desired pressure is reached. The visualization used two high-speed CCD cameras (FLIR Oryx $\circledR$ 10GigE) and a white-light LED panel with a softbox diffuser (see figure 2a). The cameras view the bubble from two perpendicular angles on a $14 \times 16.5 \, {\mathrm {cm^2}}$ area with a spatial resolution of $67\,\mathrm {\mu }{\rm m}\,{\rm pixel}^{-1}$. All components of this set-up are controlled using a National Instruments DAQ system automated with LabVIEW-NXG Software.

Figure 2. (a) Schematic diagram of the experimental set-up. (b) A schematic diagram of the bubble-injection device.
The experimental protocol we used is as follows. First the chamber was cleaned with water and then filled partially with the Carbopol solution (typically 70 % filled). The fluid was degassed in several pressure stages in order to ensure removal of all the air initially dissolved in the solution, as well as any bubbles generated during the filling process. Prior to each test, the fluid in the chamber was presheared to minimize memory effects of the fluid. This was done by mixing the gel at a similar mixing rate to that which it was mixed during its preparation, for a total of  $40\,{\mathrm {min}}$ ( $20 \,{\mathrm {min}}$ for the top half and $20\,{\mathrm {min}}$ for the bottom half).
Then, a small static bubble is inserted into the gel at the centre of the chamber using a thin needle (outer diameter,  $d = 1\,{\mathrm {mm)}}$ whose position was controlled using two linear actuators. To minimize disturbances the needle has a tilted tip section (see figure 2b), which does not cross the fluid above the bubble during insertion and removal of the needle. This set-up enables us to control the position and size of the initially injected bubble. There was no evidence of the bubble migrating towards the needle pathway once bubble motion was initiated, nor evidence of wall effects.
The above procedures are in response to our experience with bubble propagation experiments in Carbopol, where preshear mixing is needed to avoid ‘damaging’ the fluid after the passage of a first bubble. Memory effects (believed viscoelastic), can strongly affect the path taken by successive bubbles, by changing the local rheology and/or residual stress distributions (Dubash & Frigaard Reference Dubash and Frigaard2007; Lopez et al. Reference Lopez, Naccache and de Souza Mendes2018; Zare, Daneshi & Frigaard Reference Zare, Daneshi and Frigaard2021).
After removing the needle, the chamber was sealed. The pressure inside the chamber was then decreased in a stepwise manner while the bubble was imaged using both cameras. At each pressure step, the system was allowed to equilibrate over a specific time interval (referred to as the time step,  $\Delta t_{step}$). The time step duration was set to one hour, although the main response of the bubble to the pressure step occurred over the first few minutes. Since the exact pressure at which the bubbles will begin to rise is not known a priori, the pressure was reduced in smaller decrements as it decreases, i.e. to better capture the flow onset. An example that illustrates the variation of absolute pressure at the surface of the Carbopol column with time, is shown in figure 3(a).

Figure 3. Experimental protocol. (a) The absolute air pressure on the surface of the Carbopol column, which is adjusted by the vacuum system, versus time. (b) Position of the top (blue), centroid (green) and bottom (red) of the bubble versus time. Onset of motion of the bubble, when the position of the rear of the bubble changes, is shown by a dashed line.
The growth of the bubble and evolution of its shape was monitored over time using both cameras. An edge-detection MATLAB code was developed and used to postprocess the images from the experimental tests. This provides the details of the bubble geometry and its dynamics over time. The edge data is processed to give positions of the top, bottom and centroid velocity and aspect ratio of the bubble. After each step change in the pressure, the system shows a relatively rapid transient response followed by slow decay to equilibrium, during which the bubble shape changes only marginally. The bubble elongates while the position of the bottom of the bubble also slightly shifts upwards, see figure 3(b) as an example. Eventually, a low pressure threshold is crossed at which equilibrium is not attained and the bubble rises indefinitely. This represents the onset of motion, shown by the broken vertical line in figure 3(b). In defining the onset, we monitor when the bottom of the bubble starts to move indefinitely, as the bottom of the bubble is the last to move.
Given the profile of the bubble, its three-dimensional shape is reconstructed under the assumption that its profile is axisymmetric with respect to its major axis. Using this, the volume of the bubble and its equivalent spherical radius,  $R$, are calculated. This process was implemented for the images taken by both cameras, viewing the bubble from two orthogonal angles. In the case that the bubble shape is not perfectly axisymmetric with respect to the direction of gravity, there is a slight difference in the bubble diameter obtained from two images taken from different angles, which is included in the standard deviation of the bubble radius. As well as $R$, we measure the bubble aspect ratio, $\chi$, which is defined as the ratio of the major axis of the bubble to that of its minor axis.
2.2.1. Dimensionless groups
From theoretical considerations (Pourzahedi et al. Reference Pourzahedi, Chaparian, Roustaei and Frigaard2022), we expect that the onset of motion is dictated by a balance between the yield stress and the stresses arising from buoyancy and surface tension. This inelastic theory gives rise to the following dimensionless groups:
 \begin{equation} Y=\frac{\tau_Y}{\Delta \rho g R}, \end{equation}
and a scaled surface tension,
 \begin{equation} \varGamma=\frac{\sigma}{\Delta \rho g R^2}, \end{equation}
(the inverse of the Bond number). Here  $\tau _Y$, $\Delta \rho$, $g$ and $\sigma$ are, respectively, the yield stress of the gel, the density difference between the gel and the gas, gravitational acceleration and the surface tension coefficient.
In addition, the shape of the bubble before it starts to rise, during the pressure ramp-down process, should be controlled by the elastic deformation. The shape is characterized by the aspect ratio  $\chi$. Elasticity is represented by the elastic modulus, estimated from the linear regime storage modulus $G^\prime$ (see table 1). A fourth dimensionless group can be defined as yield strain $\gamma _{Y}=\tau _Y/G^\prime$, which is representative of the extent of elastic deformation the gel sustains below the yielding point.
Lastly, it is acknowledged that viscosity might be considered as an additional influencing parameter. Certainly, in the linear elastic regime  $G^{\prime \prime} /G^{\prime}$ is non-negligible (10 %–15 %). This indicates that viscosity is active in dissipating energy from the fluid motion, resulting from the expansion. However, the bubble is observed to adopt its new shape relatively quickly and the main contribution is to an increased elastic strain. The viscous effect grows as the nonlinear regime is entered (i.e. elastic creep & local yielding), but remains a short-lived transient until onset of the bubble rise. Thus, due to the long pressure time steps in our pressure ramp, we believe that the yield onset is largely non-viscous, represented by $\gamma _{Y}$.
2.3. Validation of the experimental method
Before proceeding to the main results of this paper, various comments on reproducibility and experimental design should be made. The question raised here is whether the bubble shape and size at the onset of motion are uniquely defined for a gel, using our protocols. To answer this question, two sets of complementary experiments were performed to investigate the effect on the onset of motion of both the initial size of the bubble and the ramp rate.
In the first set of experiments, spherical bubbles with different initial sizes were inserted in a  $0.1\,\%\,{(\mathrm {wt}\,\mathrm {wt}^{-1})}$ Carbopol solution. The size and shape of bubbles at the onset of motion, and consequently their critical yield number, were measured. The results are shown in figure 4(a). Regardless of their initial sizes, the bubbles deformed to an approximately fixed shape and size at the onset of motion and there is not a discernible difference in their critical yield numbers.

Figure 4. Examining the generality of experimental findings. (a) Onset of motion for bubbles in  $0.1\,\%\,{(\mathrm {wt}\,\mathrm {wt}^{-1})}$ Carbopol with different initial sizes. The initial shape of the bubbles and their shape at the onset of motion are shown at the left-hand side and right-hand side of the figure, respectively. Bubbles with different initial radii, $R_{0}$, are shown with different colours here. The inset of this figure represents the critical yield number for the bubbles. (b) Effect of experimental time scale on the onset of motion. The figure represents the onset of motion for bubbles in $0.15\,\%\,{(\mathrm {wt}\,\mathrm {wt}^{-1})}$ Carbopol. The results correspond to three different pressure ramp-down tests with three different time intervals, i.e. $\Delta t_{step}$. The inset of this figure represents the critical yield number for bubbles. The solid and dashed lines in the insets indicate the average and standard deviation of the yield number.
The second set of experiments, investigated the effect of the ramp rate during which the pressure decreases. The time step duration of the pressure ramp  $\Delta t_{step}$, was varied from $2\,{\mathrm {min}}$ to $40\, {\mathrm {min}}$. The onset of motion for bubbles with the same initial size was measured for a $0.15\,\%\,{(\mathrm {wt}\,\mathrm {wt}^{-1})}$ Carbopol gel. As indicated in figure 4(b), the shape and size of the bubble at the onset of motion, and its critical yield number, are relatively insensitive to the ramp rate at which pressure is decreased in the chamber.
Overall, these experiments demonstrate that bubbles with different initial sizes deform and evolve to a fixed shape and size at the onset of motion, regardless of how steep the pressure ramp is. It implies that the onset of motion of a bubble is controlled by the rheology of the gel. This not only guarantees the repeatability of our experiments, but also confirms the generality of our results for the critical yield number of bubbles in a Carbopol gel. Of course, we have not considered extreme ramp rates as in any case there are transients associated with the step change in pressure and dynamics of our experimental set-up.
Although the critical  $Y$ is relatively insensitive to $\Delta t_{step}$, the onset of motion is obtained at a lower absolute air pressure for shorter $\Delta t_{step}$. This might be associated with the transient response of our system, or is potentially due to time-dependent changes in the rheology of the gel, e.g. long-time creep behaviour near the yield point. Since the initial size of the bubble is small, i.e. of the order of a few millimetres and the rate of growth of the bubble is slow, i.e. at most a few millimetres per minute, the role of inertia in the bubble evolution is assumed to be negligible.
Other questions relate to the pressure control method and what is actually happening within the bubble. Firstly, note that we control pressure above the surface of the Carbopol. For a yield stress fluid, the static pressure increase can in theory be partially compensated by the yield stress when stationary. For this to happen in a systematic way would require a flow direction to generate the stress (e.g. a porous bottom plate might induce downwards motion resisted by the yield stress), but we believe such effects are absent and that residual stresses would be homogenized by the preshear mixing. In pretests we have also seen that bubbles inserted at different depths in the gel start to rise at similar size, so that any effect on static pressure is minimal. Fluid yield stresses ( ${\sim }10\,{\mathrm {Pa}}$) correspond to static pressure changes of a few centimetres at most, whereas the individual pressure steps are of kilopascal size.
Gas dissolution is not explicitly accounted for, but believed to be negligible. The initial degassing of our fluids results in pressures well below the later onset pressure. Thus, the fluids are relatively gas-free at the start of the experiment. There will be some dissolution into the surrounding fluid at the initial injection. The change in gas solubility (Henry's law) is then minimal on each pressure ramp step. Some diffusion of dissolved gas may occur. In viscous fluids the molecular diffusivity often scales inversely with viscosity. For a gel we therefore expect this effect to be negligible. No significant bubbles were observed during the experiment apart from that inserted.
3. Results
Our results are presented in two principal sections. In § 3.1 we characterize the bubble growth and onset of flow, both descriptively and quantitatively. Section 3.2 probes the elastic response of the bubble prior to onset.
3.1. Bubble growth before the onset of motion
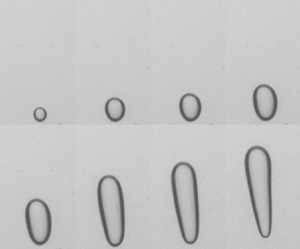
We have studied the expansion and onset process of a single bubble, within the Carbopol gels listed in table 1, during a decreasing pressure ramp test. Figure 5 presents the growth and evolution of the shape and size with decreasing pressure steps (as marked). The initial pressure for all is atmospheric pressure,  $101\,{\mathrm {kPa}}$. The initial radius of the inserted bubble, $R_0$, was set to be around $1.7\,{\mathrm {mm}}$, with the exception of that in $0.4\,\%\,{(\mathrm {wt}\,\mathrm {wt}^{-1})}$ Carbopol, which is slightly elliptical with an equivalent radius of $2\,{\mathrm {mm}}$. Controlling the initial shape and size of the inserted bubble in a high concentration gel is more challenging.

Figure 5. The growth of the bubble and evolution of its shape in Carbopol gels with different concentrations and during the pressure ramp-down test. The results are shown for four different Carbopol concentrations. The absolute pressure ( ${\mathrm {kPa}}$) (black) and the yield number (red) corresponding to each profile are mentioned next to it. The red profiles represent the shape of the bubble at the onset of motion.
As shown in figure 5 with decreasing pressure steps the bubble expands and elongates in the gravity direction such that it deforms to a quasiellipsoidal shape before the onset of motion. The anisotropic growth of the bubble which leads to its fore-and-aft asymmetrical shape is noticeable, in particular at lower pressures. This elongation is mostly attributed to the static pressure difference in the fluid at the top and bottom of the bubble. This effect increases as the bubble grows. As this happens before the onset of motion we assume that growth and elongation of the bubble are opposed primarily by elastic stresses produced by the gel deformation around the bubble. As noted earlier, in a typical experiment the deformation at the top of the bubble is greater than that at the bottom during these pressure steps (figure 3). Above a critical point, the strains around the top of the bubbles change from the elastic to the plastic regime as the bubble starts to rise. The elastic regime is explored later.
As seen in figure 5, by increasing the concentration of the gel, i.e. the yield stress and elastic modulus of the gel, a more expanded and elongated bubble forms at the onset of motion. This implies that the maximum deformation the gel can sustain below the yielding point. This is characterized by the nominal yield strain of the gels,  $\gamma _{Y}=\tau _{Y}/G^\prime$, which grows significantly with concentration (see table 1). A quantitative analysis of the results reported in figure 5 shows that the characteristic deformation at the onset of motion, defined via the relative growth of the bubble radius $(R-R_0)/R_0$, increases monotonically from $1.2$ to $2.4$ with the concentration of the gel. It is hard to infer more from such crude measurements and parameters such as $\gamma _{Y}$. The strain is clearly not radially symmetric, but larger around the top of the bubble. Equally, $G^\prime$ is a measured shear modulus whereas the strains in the gel are only partly shear.
During the expansion process, the symmetry of the bubble profile along the vertical axis is also broken, and more so in the high concentration gels, i.e.  $0.3\,\%\,{(\mathrm {wt}\,\mathrm {wt}^{-1})}$ and $0.4\,\%\,{(\mathrm {wt}\,\mathrm {wt}^{-1})}$ Carbopol. The broken symmetry may arise from residual stresses in the gel. For higher yield stress fluids, it is more difficult to remove the shear history by mixing. Hence, we expect that for $0.3\,\%\,{(\mathrm {wt}\,\mathrm {wt}^{-1})}$ and $0.4\,\%\,{(\mathrm {wt}\,\mathrm {wt}^{-1})}$ Carbopol, even after mixing of the gel within the chamber, there can be localized zones in the gel with internal stress history that have not fully relaxed. These imperfections are not systematic from experiment to experiment, and do not change the volume and aspect ratio of the bubble at the onset of motion significantly.
The shape of the bubble at the onset of motion is roughly ellipsoid but with a noticeable fore-and-aft asymmetry, increasing with concentration. The rear of the bubbles is rounded at flow onset, see figure 5. However, as the bubble starts to rise and accelerates, its shape evolves to an inverted teardrop shape with a sharp tip in its trailing pole (see figure 6). This feature of the shape has been observed in most experimental studies of bubble propagation within Carbopol (Dubash & Frigaard Reference Dubash and Frigaard2007; Sikorski et al. Reference Sikorski, Tabuteau and de Bruyn2009; Mougin et al. Reference Mougin, Magnin and Piau2012; Lopez et al. Reference Lopez, Naccache and de Souza Mendes2018; Zare & Frigaard Reference Zare and Frigaard2018; Pourzahedi et al. Reference Pourzahedi, Zare and Frigaard2021), and is a feature of bubble propagation in viscoelastic fluids. The phenomenon is explained mechanically by Moschopoulos et al. (Reference Moschopoulos, Spyridakis, Varchanis, Dimakopoulos and Tsamopoulos2021b). Our experiments clearly show that significant motion is required for this feature to develop.

Figure 6. Evolution of the shape of a bubble after it starts to rise ( $0.15\,\%\,{(\mathrm {wt}\,\mathrm {wt}^{-1})}$ Carbopol gel). (a) Profile of the bubble at different times. (b) The position of the centre of the bubble normalized by its position at the onset of motion versus time. Here $t=0\,{\mathrm {s}}$ represents the onset of motion.
At the lower concentrations the onset shapes are reminiscent of some of the computed arrest shapes of Tsamopoulos et al. (Reference Tsamopoulos, Dimakopoulos, Chatzidai, Karapetsas and Pavlidis2008), but not at higher concentrations. The evolving onset shape with Carbopol concentration is a novel observation, again attributable to elasticity but now in the subyield range. As the stresses in the gel are not directly measurable, this outlines a new computational challenge, to model and predict this behaviour.
3.1.1. Critical yield number
Given the bubble shape at the onset of motion, the critical yield number was computed according to the procedure explained in § 2.2. The critical yield numbers obtained for Carbopol gels with different concentrations are shown in figure 7(a). The recent computational study of Pourzahedi et al. (Reference Pourzahedi, Chaparian, Roustaei and Frigaard2022) explores the variation of  $Y_c$ as a function of the aspect ratio $\chi$ and the dimensionless surface tension, $\varGamma$. In order to provide a comparison between theoretical findings and our experimental results, the same parameters are used. With increasing gel concentration, a larger and more elongated bubble forms at the onset of motion, thus $\chi$ and the measured radius both increase. A larger critical yield number is also obtained for the higher concentration. Since the bubbles are elongated before the onset of motion, their aspect ratios $\chi$, are typically between one and seven, i.e. prolate. The increase in bubble size means that the effect of surface tension in contributing to the onset, decreases with size and concentration: $\varGamma$ ranges approximately between $0.1$ and $0.5$ as the concentration increases. This is under the assumption that the surface tension of the material does not change noticeably with its concentration, being slightly less than that of water (see Boujlel & Coussot (Reference Boujlel and Coussot2013)).

Figure 7. Onset of motion of a single bubble in Carbopol solutions. (a) Critical yield number for different Carbopol concentrations. For each Carbopol concentration, the profile of the bubble at the onset of motion is also depicted. (b) Yield-capillary number versus aspect ratio of the bubble profile at the onset of motion. The blue and red dots represent the numerical results obtained for  $\varGamma =0.1$ and $\varGamma =0.5$, respectively (Pourzahedi et al. Reference Pourzahedi, Chaparian, Roustaei and Frigaard2022). The inset of this panel indicates yield-capillary number against surface tension.
The variation of computed critical capillary-yield number,  $Ca_Y = Y/\varGamma$, with respect to the aspect ratio $\chi$, is plotted in figure 7(b) and compared with the experimental values. As seen, the experimental data transition between the two computed critical curves as the concentration varies, agreeing surprisingly well. The relation between $Ca_Y$ and $\varGamma$ for the experiments is shown in the inset figure. This suggests that although the elasticity of the gel plays an important role in defining the shape of the bubble at the onset of motion, it does not necessarily affect the yield limit for a fixed bubble shape, i.e. the inelastic theory and computations remain useful in this regard.
3.2. Elastic response of the bubble
In the regime before yielding/onset, the time-dependent rheological behaviour of the gel suggests a viscoelastic response, which leads to natural questions regarding the reversibility of these dynamic effects. There has also been much recent interest in characterizing yield stress fluid rheology (before yielding) in terms of elastic and non-recoverable strain (N'gouamba, Goyon & Coussot Reference N'gouamba, Goyon and Coussot2019; Coussot & Rogers Reference Coussot and Rogers2021; Kamani et al. Reference Kamani, Donley and Rogers2021). This revives a train of thought that can be traced back to Oldroyd (Reference Oldroyd1947). Much of the recent research in this direction concerns shear rheometry, or occasionally extensional. In our initial experiments described below, it soon became apparent that early stages of our experiments might offer an interesting alternate rheometric technique, in that the initial bubble expansion/contraction is primarily radially symmetric.
3.2.1. Pressure ramp test
To explore the behaviours associated with flow onset, a series of pressure ramp-down/ramp-up tests were performed in order to investigate both elastic deformation and possible hysteretic behaviour. Firstly memory effects on the equilibrium size of a bubble trapped in a  $0.1\,\%\,{(\mathrm {wt}\,\mathrm {wt}^{-1})}$ Carbopol gel, were addressed. Static bubbles were injected into the gel and the air pressure reduced $68.9\,{\mathrm {kPa}}$ to start the experiment. Starting from this equilibrium point, we decreased the pressure in a stepwise manner to reach a target minimum pressure. We then inverted the pressure set point and stepped up the pressure to regain the initial pressure. During both ramp-down and ramp-up processes, each pressure step lasted one hour to ensure that the system reaches its equilibrium.
The procedure was repeated for two different target minimum pressures. In case  ${\rm A}$ the final pressure was $31\,{\mathrm {kPa}}$, which was not low enough for the bubble to move. In case ${\rm B}$ the pressure is reduced to a smaller target pressure ( $24\,{\mathrm {kPa}}$) such that the bubble eventually starts to rise. In case ${\rm B}$, the pressure was kept constant at the lowest target pressure value just for a few minutes, such that the bubble rise does not lead to any significant change in the position or average hydrostatic pressure around the bubble. The pressure ramp-up then arrests the bubble motion in case ${\rm B}$.
The equivalent radius of the bubble and its yield number have been computed, when the system reaches its equilibrium state on each pressure step. The results are shown in figure 8. There is a noticeable discrepancy between the data obtained during the ramp-down (red) and ramp-up (black) data. The bubbles do not regain their initial size during the ramp-up process. This hysteresis in  $R$ (and $Y$) is more evident in case ${\rm A}$ than in case ${\rm B}$.

Figure 8. Radius data for two different sets of ramp-up and ramp-down tests ( ${\rm A}$ and ${\rm B}$) with different lower bounds for the absolute pressure. In case ${\rm A}$ the bubble remain trapped in the gel during the test, while in case ${\rm B}$ the bubble rises slightly at the lowest absolute pressure. Each set of tests includes a pressure ramp-down test (black symbols) followed by a pressure ramp-up test (red symbols). The inset shows the yield number versus absolute pressure, on the top of the column of $0.1\,\%\,{(\mathrm {wt}\,\mathrm {wt}^{-1})}$ Carbopol. The critical yield number and its error bar is shown by the horizontal solid and dashed lines, respectively. (b) The profiles of the bubble during the ramp-down (black) and ramp-up (red) test, for cases ${\rm A}$ and ${\rm B}$.
Given that the bubble pressure is reversible, this suggests the presence of residual stresses remaining in the gel around the bubble after the pressure ramps, i.e. unrecoverable strain. Some part of the discrepancy may also reflect viscous losses during the deformation. A nominal unrecoverable strain at the end of the test, can be defined as  $\Delta R/R_0$. This is around $30\,\%$ for case ${\rm A}$ while it decreases to around $10\,\%$ for case ${\rm B}$. Unrecoverable strain is not surprising, but why this should be larger in ${\rm A}$ than ${\rm B}$ is not clear. One plausible explanation is that the onset of bubble rise is associated with yielding of the gel around it, which allows the residual stresses to relax. In the other words, the strain history of the gel is mostly removed after it yields and the bubble starts to rise.
The test was repeated for  $0.15\,\%\,{(\mathrm {wt}\,\mathrm {wt}^{-1})}$ Carbopol, now with two different step durations for the pressure ramp, see figure 9. The low target pressure was now $17\,{\mathrm {kPa}}$, resulting in $Y$ values above $Y_c$, due to the increased yield stress. In case ${\rm A}$ the pressure was kept constant for one hour at each pressure step. This guarantees that the bubble evolves to its equilibrium shape and that the gel around it undergoes the maximum possible deformation at each pressure step. However, in case ${\rm B}$, the step duration is reduced to 5 min which limits the growth of the bubble at each pressure step. Consequently, the gel is able to creep much less in case ${\rm B}$ than in case ${\rm A}$. Although the results obtained for both cases present noticeable hysteresis, it is less pronounced in case ${\rm B}$. It might be argued that the gel experiences less unrecoverable deformation during the pressure ramp-down in case ${\rm B}$. This leads to the creation of relatively small residual stresses as the pressure returns to its initial value.

Figure 9. The figure shows data for two different sets of ramp-down (black) and ramp-up (red) tests ( ${\rm A}$ and ${\rm B}$) with different time intervals for step change in the pressure. Test ${\rm A}$ represents data for time interval of $5\,{\mathrm {min}}$, while ${\rm B}$ represents data for time interval of $1\,{\mathrm {h}}$. The inset shows the yield number versus absolute pressure on the top of the column of $0.15\,\%\,{(\mathrm {wt}\,\mathrm {wt}^{-1})}$ Carbopol. The critical yield number and its error bar are shown by horizontal solid and dashed lines, respectively. (b) The profiles of the bubble during the ramp-down (black) and ramp-up (red) test.
It is suggested that the pressure ramp method, in particular for case  ${\rm A}$, leads to an interesting technique for quantifying unrecoverable strain in such materials, i.e. with the caveat of limiting the radius range, so as to avoid bubble motion. Unlike conventional shear rheometry, we have a radially symmetric expansion/contraction. With variation of the step length, one also has a different way to control strain recovery while keeping $Y > Y_c$ (see the insets of these figures).
3.2.2. Cyclic pressure variations
Considering, the results reported in figures 8 and 9 it is evident that cyclic changes in the vacuum pressure lead to a noticeable variation in bubble size and yield number. This leads to both rheometric and application-driven questions. From the rheometric perspective, is the single pressure ramp the best diagnostic tool or would cyclic variation lead to a cyclic response, akin to small-amplitude oscillatory shear/large-amplitude oscillatory shear (SAOS/LAOS) techniques? From the application perspective, a practical question associated with this is whether repeated cyclic atmospheric pressure (and/or temperature) variations might play an important role in the release of small bubbles from tailings ponds, e.g. diurnal or seasonal. To shed more light on these questions, a series of time-dependent tests were performed during which the vacuum pressure was varied periodically between a minimum and a maximum value. The pressure variation range is designed so as to maintain  $Y$ above $Y_c$ during each cycle, i.e. so that the deformation remains in the elastic regime. The position and size of a bubble initially injected into the gel are measured during the tests.
The results for a single bubble in  $0.1\,\%\,{(\mathrm {wt}\,\mathrm {wt}^{-1})}$ Carbopol and $0.15\,\%\,{(\mathrm {wt}\,\mathrm {wt}^{-1})}$ Carbopol are reported in figures 10 and 11, respectively. In each figure, the panel (a) shows the pressure cycle. Panel (b) marks the heights of the centre, top and bottom of each bubble. Panel (c) records the yield number at the two pressures, which is essentially a variation in the effective radius of the bubble. Panel (c) indicates in both cases that there is an incremental decrease in $Y$, due to the change in measured bubble size, over each cycle. In panel (b) is observed an interesting upwards migration of the bubbles, even though $Y>Y_c$ throughout the cycling. In each pressure cycle, the bubble expands and contracts. However, the contraction at the top and bottom of the bubble is not the same. In figure 10 the centre remains approximately constant while in figure 11 it reduces slightly below the low-pressure limit. In contrast, the bottom of the bubble appears to rise significantly (red pentagrams) on each cycle. As the new cycle of expansion–contraction starts, the tail is at a higher position. Note too that the material surrounding the bubble changes on each cycle. The top of the bubble is continually faced with new gel that has not been deformed. The tail of the bubble is, however, surrounded by material that has deformed/weakened and flowed around the bubble.

Figure 10. Dynamic response of a bubble in a  $0.1\,\%\,{(\mathrm {wt}\,\mathrm {wt}^{-1})}$ Carbopol gel to the periodic vacuum pressure. (a) Absolute air pressure on the top of the Carbopol column versus time. The absolute pressure oscillates between $69\,{\mathrm {kPa}}$ and $34\,{\mathrm {kPa}}$ periodically, with the time interval of $5\,{\mathrm {min}}$. Panel (b) shows the position of the centre (circle), top (triangle) and rear of the bubble (pentagram). The averaged yield number for each interval is shown in panel (c). The critical yield number and its error bar are shown by solid and dashed horizontal lines, respectively. In this panel the black and red symbols represent the data corresponding to $69\,{\mathrm {kPa}}$ to $34\,{\mathrm {kPa}}$ absolute pressure, respectively. Panel (d) presents the actual images the bubble in sequence. The upper row and lower row correspond to the upper bound and lower bound of the pressure, respectively.

Figure 11. Dynamic response of a bubble in a  $0.15\,\%\,{(\mathrm {wt}\,\mathrm {wt}^{-1})}$ Carbopol gel to the periodic vacuum pressure. (a) Absolute air pressure on the top of the Carbopol column versus time. The absolute pressure oscillates between $69\,{\mathrm {kPa}}$ and $17\,{\mathrm {kPa}}$ periodically, with the time interval of $5\,{\mathrm {min}}$. Panel (b) shows the position of the centre (circle), top (triangle) and rear of the bubble (pentagram). The averaged yield number for each interval is shown in panel (c). The critical yield number and its error bar are shown by solid and dashed horizontal lines, respectively. In this panel the black and red symbols represent the data corresponding to $69\,{\mathrm {kPa}}$ to $17\,{\mathrm {kPa}}$ absolute pressure, respectively. Panel (d) presents the actual images the bubble in sequence. The upper row and lower row correspond to the upper bound and lower bound of the pressure, respectively.
The inherent asymmetry evident in figures 10 and 11 (due to buoyancy and upwards motion), probably makes repeated cycling less valuable rheometrically. This behaviour is reminiscent of fatigue tests in solid mechanics, i.e. the weakening of a solid material due to repeatedly applied loads. Recent rheological studies (Perge et al. Reference Perge, Taberlet, Gibaud and Manneville2014; Gibaud, Divoux & Manneville Reference Gibaud, Divoux and Manneville2020) revealed similar behaviour for gels when subjected to cyclic deformation or stress. Perge et al. (Reference Perge, Taberlet, Gibaud and Manneville2014) studied fatigue dynamics in a colloidal gel and showed that submitting the gel to a long-time large amplitude oscillatory shear stress, with the stress amplitude below the yield stress, the gel eventually exhibits fatigue and progressively yields. Here we feel that the bubble rise is due rather to local yielding behaviour, which is limited on each cycle. The bubble rise also continually replaces the material close to the bubble at the top, whereas in a rheometer the material is fixed. Whether such periodic upwards motion might occur in a tailings pond, in response to atmospheric fluctuations is an interesting question.
3.2.3. Pressure and strain deficit
As noted, elastic effects are evident in the subyield regime and manifest through local deformation, some of which is recoverable and some not. Although the shape changes observed and the slightly different rise behaviour of bubble top and bottom indicate that the elastic deformation varies locally, it is of value to understand the bulk effect of elasticity. To this end bulk pressure and strain deficits, can be calculated as follows. First note that in the experiment the pressure at the surface in the vacuum tank is varied and the volumetric bubble radius is measured from the images. Both the pressure sensor and the visualization method can be calibrated independently to minimize measurement errors. Each measurement can, however, also be used to predict the other.
For this comparison, it is assumed that the temperature variation is negligible and that the mass of gas in the bubble is fixed. From the surface pressure measurement, we may add the static pressure increase to the bubble centre, add a jump due to surface tension and then use the ideal gas law to predict the bubble volume. In reverse, from the measured and initial radii, we may infer the bubble pressure from the ideal gas law, subtract the static pressure and surface tension term, and then predict the gas pressure  $P_g$. Figure 12 presents these comparisons for experiments with a $0.1\,\%\;({\rm wt}\,{\rm wt}^{-1})$ Carbopol gel. In figure 12(a) the red markers are essentially horizontal on each pressure step, which follows because the tank pressure is controlled and the bubble position change is minor before flow onset. In contrast, the radius measured (black) is larger. Conversely, figure 12(b) has near constant pressure measured, whereas that predicted from the measured bubble radius is systematically lower. These two effects are self-consistent, i.e. the smaller bubble implies a higher pressure and vice versa. However, there is a notable discrepancy between prediction and measurement, i.e. a deficit in pressure and size.

Figure 12. Comparisons between direct experimental measurements and results obtained from the ideal gas law. The results shown here are for  $0.1\,\%\,{(\mathrm {wt}\,\mathrm {wt}^{-1})}$ Carbopol gel and associated with those reported in figure 3. The red circles represent data obtained using the ideal gas law, while the black circles show those obtained via experimental measurements directly. Panel (a) presents the ratio of the radius of the bubble to its initial radius versus time. The variation of gas pressure inside the bubble, $P_g\,{\mathrm {(kPa)}}$, with time is depicted in panel (b). Note that experimentally measured pressure, denoted by black circles, are obtained by subtracting the hydrostatic pressure and surface tension from the absolute pressure measured at the surface of Carbopol column.
The pressure steps in our experiments are in the range of 1–10  ${\mathrm {kPa}}$. The static pressure at the initial position adds ${\approx }2\,{\mathrm {kPa}}$. Before onset, the change in static pressure due to bubble rise on each step amounts to ${\sim } 1\,{\mathrm {Pa}}$. The pressure jump due to surface tension, estimated from $R$, can be of magnitude ${\sim }10\,{\mathrm {Pa}}$, but the change in this quantity on each pressure step is typically 0.1–0.5 ${\mathrm {Pa}}$. Thus, the bubble pressure estimation on each step should contain the main effects. Solubility of air in water is relatively low and reduces with decreasing the internal bubble pressure according to Henry's law. Thus, the reduction in internal bubble pressure during bubble expansion should diminish the driving force for mass transfer of air from the bubble to the ambient gel. Furthermore, it is expected that the molecular diffusivity of air in Carbopol gel is much lower than that in water. Additionally, under the experimental protocol followed the gel has been degassed to lower pressures before insertion of the test bubble, so there is little dissolved gas available. Thus, the disparity between the evolution in the observed bubble radius and that predicted by the ideal gas law does not appear to be adequately explained by mass transport between the bubble and the aqueous gel. Therefore, it is believed that the cause of the deficits in figure 12 is mechanical: the pressure deficit is indicative of residual stresses within the gel, i.e. those not recovered. The bubble pressure is transmitted to the gel surrounding, where it creates elastic stresses and strain. Similarly, the deficit between measured and predicted radii can be interpreted as indicating unrecovered strain. Perhaps the deficit in radii, compared with the mean increase in radius, could indicate the percentage of irreversible strain.
4. Discussion and summary
This paper presented an experimental study of the onset of motion of bubbles in a yield stress fluid. An individual bubble was injected into a column of Carbopol gel. The pressure at the gel surface was controlled by a vacuum pressure system, which directly affects the volume of the bubble and consequent buoyancy force. Direct visualization of the bubble in the gel was exploited to determine the bubble profile and therefore the bubble growth and motion.
The current study follows on from a theoretical study by Pourzahedi et al. (Reference Pourzahedi, Chaparian, Roustaei and Frigaard2022), that calculated the yield limit as a function of the shape of the bubble and the surface tension of the gel, using ideal viscoplastic fluid models, i.e. inelastic. Experiments show a very similar trend to theoretical data for the static yield limit, with respect to the aspect ratio of bubbles. Both experiments and theory show that at a fixed bubble volume, the thinner the bubble is the larger is the yield stress required to hold it static. However, the link between the shape of the bubble at the onset of motion and the rheology of the material is missing in the theoretical work.
In the theoretical framework of Pourzahedi et al. (Reference Pourzahedi, Chaparian, Roustaei and Frigaard2022), the yield limit is calculated for any specified bubble shape. Ideal viscoplastic fluid models do not allow deformation below the yield stress, so this approach is self-consistent. However, the experiments presented here show that growth and evolution of the shape of the bubbles is dictated by the creep and deformation of the gel during its expansion (in the subyield regime). The results indicate that for a fixed concentration of Carbopol, the bubble evolves to a unique shape and volume at the onset of motion. Interestingly, at lower concentrations where elastic effects are smaller, the onset shapes are ellipsoidal. This is similar to the shapes computed using transient computations with classical inelastic models, e.g. Tsamopoulos et al. (Reference Tsamopoulos, Dimakopoulos, Chatzidai, Karapetsas and Pavlidis2008), but for higher Carbopol concentrations elasticity is important in determining the onset shape and this is a new computational challenge.
One might expect that the degree of the deformation in the gel, which is limited to the yield strain of the gel, dictates the bubble shape and volume before it starts to rise. Hence, larger and thinner bubbles may indeed be expected to form in higher concentration gels, which resist larger deformation before the yielding point. However, according to our experimental results, the degree of bubble expansion before the onset of motion is beyond the usual yield strain of the material. This suggests that local yielding of the material also occurs during the bubble growth and is very important in allowing the bubble to deform to a shape that remains stationary, up until its final size and shape at the onset of motion.
The hysteresis tests, performed by subjecting a bubble to a pressure ramp-down followed by a pressure ramp-up, highlight the irreversibility of the gel deformation during the bubble growth. This implies that (residual) stresses form in the gel during the bubble expansion that do not relax within the time scale of our experiments, roughly a couple of hours. This might be associated with either the nonlinear elastic creep behaviour of the gel below the yielding point or to local yielding events occurring during the bubble expansion.
To further strengthen this interpretation, we performed a series of tests to examine the bubble response to cyclic variation in the vacuum pressure. In addition to the irreversibility of the response, which is manifested by the residual deformation retained in the gel after each pressure cycle, the results may be affected by fatigue behaviour of the gel. The bubble rises slightly in the gel after a few cycles, which is indicative of the weakening of the gel structure around the bubble. However, in contrast to typical mechanical testing protocols, bubble rise means that the deformed fluid is continually replaced.
The signature of residual stresses, irreversible deformation and fatigue have been observed in recent rheological studies of yield stress fluids (Perge et al. Reference Perge, Taberlet, Gibaud and Manneville2014; N'gouamba et al. Reference N'gouamba, Goyon and Coussot2019; Gibaud et al. Reference Gibaud, Divoux and Manneville2020; Coussot & Rogers Reference Coussot and Rogers2021; Kamani et al. Reference Kamani, Donley and Rogers2021). These complex rheological effects might explain the non-trivial response of the gel to the growth of the bubble in our problem. Equally, there are aspects of our experimental procedure that might be useful in probing rheological behaviour, complementing conventional rheometer tests. In particular, for small strains our flows might be approximated as a spherically symmetric expansion, which is quite different from viscometric shear (steady torsional flow) in a rotational rheometer.
Lastly, returning to the field setting that formed the initial motivation for our study, we remark that diurnal atmospheric pressure variations are typically very much smaller than those explored in our experiments. Thus, cyclic fatigue of tailings pond fluids due to these fluctuations is probably unrealistic as a cause of emissions. More relevant perhaps in the Canadian oil sands context would be seasonal changes. Maximal atmospheric pressure variations in Fort McMurray, Alberta, amount to  $\approx 6\,{\mathrm {kPa}}$ (highest in winter). Peak summer and winter surface temperatures can vary over $-35^{\circ}{\rm C}$ to $40^{\circ}{\rm C}$, but this would be a much smaller range deeper within a tailings pond. In the context of our experiments, the time period of annual fluctuations is much longer and would presumably allow for equilibration. Thus, the relevant part of our results are those of the critical yield number and how that varies with bubble size/shape at onset. We may expect some form of elastic deformation, as here, but perhaps also modified by the composition of the FFT/MFT slurries. Changes in bubble size, however, are probably slow, and are due to a combination of seasonal temperature and pressure fluctuations and to continuing microbial degradation/gas generation.
Acknowledgements
We thank the reviewers for their critical and interesting comments.
Funding
This research was made possible by collaborative research funding from NSERC and COSIA/IOSI (project numbers CRDPJ 537806-18 and IOSI Project 2018-10).
Declaration of interests
The authors report no conflict of interest.


 Open access