


1. Introduction
Microfluidic channels are widely used to produce droplets with controlled size and low polydispersity index, which are important in applications such as emulsification, inkjet printing, cosmetics and healthcare (Lawrence & Rees Reference Lawrence and Rees2000; Yang et al. Reference Yang, Kapur, Wang, Fiesser, Bierbrauer, Wilson, Sabey and Bain2018; Park, Kim & Kim Reference Park, Kim and Kim2021). Surfactants are commonly added during drop formation to modify the interfacial properties and improve the stability of the emulsions. The presence of surfactant molecules significantly affects the nonlinear drop formation process and thus the final size (Chen, Xu & Luo Reference Chen, Xu and Luo2015). In the common dripping regime, drop formation depends on the balance between the interfacial tension and the drag forces, with the latter being the combination of shear and pressure forces (Xu et al. Reference Xu, Luo, Li and Chen2006). As a result, a lower interfacial tension caused by surfactant addition will result in smaller and more rapidly forming drops. As seen in previous work, the small characteristic time scales that are present in microfluidics can lead to interfacial tension values different from the equilibrium ones, which are often used in the calculation of capillary numbers  $Ca$ (Kalli & Angeli Reference Kalli and Angeli2022) and in predictive equations for drop size. Additionally, shear stresses from high continuous phase velocities can redistribute surfactant molecules at the interface, which will cause interfacial tension gradients and thus Marangoni stresses (Kovalchuk & Simmons Reference Kovalchuk and Simmons2021). For surfactants that result in a large decrease in interfacial tension, the effect of interface retardation at low surfactant concentrations can be sufficiently large to change the velocity fields close to the interface and inside the drop, due to Marangoni stresses in the opposite direction to the flow. At high concentrations, surfactant exchange between the bulk and the interface is fast and interface remobilisation is seen at high velocities (Martin & Hudson Reference Martin and Hudson2009). Since both observations will greatly impact the final surfactant transport, it is important to study the behaviour of such surfactants at different concentrations, below and above the critical micelle concentration (CMC).
As first reported by Garstecki, Stone & Whitesides (Reference Garstecki, Stone and Whitesides2005), drop formation in the dripping regime is typically divided into three stages called expansion, necking and pinch-off. Following drop detachment, the interface pulls towards the inlet before recoiling in the downstream direction. At this stage, drop growth is mainly in the streamwise direction forming a parabolic interface profile and is dominated by interfacial tension. Once the pressure builds up due to restriction of the inlet from the forming drop, the drag force overcomes the interfacial tension force and a reversal of the interface curvature is observed, which indicates the beginning of the necking stage. The neck width decreases until the drag force is large enough to cause drop detachment and thus pinch-off. In recent studies (Wang et al. Reference Wang, Lu, Xu and Luo2009; Xu et al. Reference Xu, Dong, Zhao, Tostado and Luo2012), it was found that high dispersed phase flow rates enhance convection and surfactant mass transfer from the continuous phase to the interface, which explain the reduced interfacial tension values at short formation times. Furthermore, it was found that absorption and mass transfer rates can compete with drop formation times (Kalli, Chagot & Angeli Reference Kalli, Chagot and Angeli2022). Investigating the transport of surfactants during each phase of the drop formation process is vital in understanding the impact on the final drop size.
Improvements in experimental techniques allow the accurate visualisation of flows inside microchannels, which can be used to explore the effects of surfactant transport. Kiratzis et al. (Reference Kiratzis, Kovalchuk, Simmons and Vigolo2022) used ghost particle velocimetry to study the effect of surfactant concentration, continuous phase velocity and viscosity on drop formation in rectangular channels. Results revealed smaller velocities at the interface when a surfactant of the same family but with a slower adsorption rate (lower CMC) was present, suggesting the presence of Marangoni stresses. In addition, larger internal circulation inside the drops was seen at higher continuous phase viscosity during the expansion stage. Roumpea et al. (Reference Roumpea, Kovalchuk, Chinaud, Nowak, Simmons and Angeli2019) used an innovative two-colour micro-particle image velocimetry ( $\mu$PIV) technique to study velocity fields in a flow-focusing microchannel in the presence of two cationic surfactants of the same family but different adsorption kinetics (C $_{12}$TAB, dodecyltrimethylammonium bromide and C $_{16}$TAB, hexadecyltrimethylammonium bromide). Addition of surfactant in the dispersed phase resulted in higher velocities at the tip and more uniform velocity fields inside the drop, which was attributed to surfactant accumulation at the tip that increases the interface rigidity in that area. A second observation was the decrease in the circulation inside the drop, which was again attributed to Marangoni effects that caused the interface to move in the opposite direction to the flow and opposed circulation. Similar effects were seen when a non-ionic surfactant (Span80) was added in the continuous oil phase, in a T-junction channel (Riaud et al. Reference Riaud, Zhang, Wang, Wang and Luo2018). A stagnant cap was observed in this case near the drop tip that split the forming drop interface into a mobile and a rigid region. The resulting Marangoni force in the opposite direction of the forming drop resisted the flow circulation. Studies on drop formation in a flow-focusing microchannel by Carrier et al. (Reference Carrier, Ergin, Li, Watz and Funfschilling2015) revealed a flow inversion during pinch-off and weaker recirculation at the base of the drop compared with its front, upon addition of SDS (sodium dodecylsulphate) surfactant. Changes in circulation within surfactant-laden drops using $\mu$PIV were investigated in emulsions produced in a tapered microchannel leading to a geometrical constriction (Leong, Gai & Tang Reference Leong, Gai and Tang2018). It was found that vortical structures forming when the drops passed the constriction, increase circulation up to 2.5 times compared with droplet mixing at the channel constriction.
Despite the work reviewed above, there are still important limitations to be addressed in order to fully understand the effect of surfactant on the drop formation process. As previously mentioned, it is essential to know the surfactant distribution at the interface as it can accumulate at the tip and cause Marangoni flows as the drop forms. The surfactant concentration at the interface is very challenging to obtain experimentally (Dussaud, Matar & Troian Reference Dussaud, Matar and Troian2005), especially during flow. Even if a fluorescent surfactant is used, the powerful intensity of the laser needed for visualisation can cause photobleaching (Eggeling et al. Reference Eggeling, Widengren, Rigler and Seidel1998), which is non-reversible. Another issue is self-quenching (Aicolina, Leaver & Stapleton Reference Aicolina, Leaver and Stapleton1989; Li et al. Reference Li, Zhou, Yu, Pu, Sun, Zhou and Zhang2022), where the total emitted intensity can change upon temperature, pressure or pH fluctuations. Additionally, most fluorescent surfactants are soluble in solvents such as chloroform and dimethylformamide, which can be toxic. Since most fluorescently tagged surfactants are synthesised by adding a fluorescent group to the amphiphilic structure of the surfactant, they usually result in heavier molecules that exhibit low interfacial activity (i.e. small reduction in interfacial tension with concentration) or slow adsorption kinetics, especially when compared with the fast drop formation process. Dong, Weheliye & Angeli (Reference Dong, Weheliye and Angeli2019) used planar laser induced fluorescence to capture the spatio-temporal distribution of a fluorescent surfactant during the coalescence of a mm size drop with a flat surface, using a laser sheet with 1 mm thickness. This dimension is an order of magnitude larger than typical microchannel length scales. On the other hand, the volume illumination used for microchannel laser induced fluorescence studies is not ideal when tracing molecules at a three-dimensional interface.
The complex phenomena of drop formation in microchannels have also been investigated through numerical approaches. Computational fluid dynamics (CFD) simulations in particular are a powerful tool to overcome most of the above-mentioned experimental limitations and extract useful information related to the dynamics of the flow. Numerous CFD investigations based on volume-of-fluid and level-set methods have been conducted to determine the role of operating conditions on the drop formation process in surfactant-free systems. These studies have revealed the interplay between capillarity, inertia and viscosity for different microfluidic junction geometries and their effects on drop formation (Van der Graaf et al. Reference Van der Graaf, Nisisako, Schroën, Van Der Sman and Boom2006; Li et al. Reference Li, Li, Yang, Kinoshita, Oishi and Oshima2012; Lan et al. Reference Lan, Li, Wang and Luo2014; Ngo et al. Reference Ngo, Dang, Byon and Joo2015; Zhao et al. Reference Zhao, Riaud, Luo, Jin and Cheng2015; Soh, Yeoh & Timchenko Reference Soh, Yeoh and Timchenko2016; Kahouadji et al. Reference Kahouadji, Nowak, Kovalchuk, Chergui, Juric, Shin, Simmons, Craster and Matar2018; Filimonov, Wu & Sundén Reference Filimonov, Wu and Sundén2021). Recent studies in the presence of surfactants have provided a detailed description of the heterogeneous distribution of surfactant concentration at the interface and the effect on drop formation time and drop size. Riaud et al. (Reference Riaud, Zhang, Wang, Wang and Luo2018) performed numerical simulations inside a T-junction microchannel for a Span80-octane/water mixture and compared the results against  $\mu$PIV experiments. The authors found that the interfacial distribution of surfactants on growing droplets is not uniform but surfactants tend to concentrate at the droplet tip. They also reported that surfactant adsorption is faster than drop formation at low velocities and low $Ca$. As $Ca$ is increased, either by lowering the interfacial tension or by increasing the inlet velocity, the characteristic drop formation time is reduced and thus adsorption becomes slower than formation time. The authors showed that droplet volume increases with increasing dispersed phase flow rate and decreasing $Ca$; both parameters are therefore necessary to predict the drop size. Jin, Gupta & Stebe (Reference Jin, Gupta and Stebe2006) studied the effect of soluble surfactants on drop necking and used a nonlinear model to relate interfacial tension to surfactant concentration at the interface, by accounting for maximum surfactant packing at the interface. The analysis revealed that a family of necks formed, as a result of a primary and a secondary thinning rate of the neck, depending on the local accumulation of surfactants, and demonstrated that drop detachment behaviour can be used to quantify surfactant dynamics. Antonopoulou et al. (Reference Antonopoulou, Harlen, Rump, Segers and Walkley2021) performed experimental and numerical studies on the flow behaviour during inkjet printing and explained the effect different surfactants have on pinch-off during jetting.
This paper combines unique experimental and numerical approaches to investigate surfactant transport in the bulk, distribution at the interface and Marangoni phenomena during the fast drop formation process in a microfluidic channel. A non-ionic (CMC $_{TX100} = 3.5$ mM) surfactant is used in the dispersed aqueous phase at concentrations below and above the CMC. A novel high-speed $\mu$PIV system is able to follow all stages of the fast drop formation process, which is a key improvement compared with previous works (Riaud et al. Reference Riaud, Zhang, Wang, Wang and Luo2018; Roumpea et al. Reference Roumpea, Kovalchuk, Chinaud, Nowak, Simmons and Angeli2019). The CFD simulations include the exchange of surfactant between the bulk of the drop and the interface, as opposed to previous works that considered only transport at the interface (Riaud et al. Reference Riaud, Zhang, Wang, Wang and Luo2018; Antonopoulou et al. Reference Antonopoulou, Harlen, Rump, Segers and Walkley2021). The effect of surfactant on the vortical structures and velocity fields are discussed for the different stages of drop formation. The CFD simulations provide information on surfactant concentrations at the interface that cannot be obtained experimentally. In addition, they reveal the vortical structures very close to the interface where measurements are not accurate because of the low concentration of the PIV tracer particles in this region (i.e. at the neck region just before pinch-off). They also enable investigations of the drop in three dimensions, which are very challenging to obtain experimentally. The experiments on the other hand provide data on the effect of the surfactant at high concentrations above the CMC, which is beyond the capabilities of the current model. The Marangoni stresses at the interface are calculated and presented as a function of time, space, and dispersed phase flow rate for the first time during the whole drop formation process.
2. Experimental methods
2.1. Droplet generation
The experiments were performed in a glass flow-focusing microchannel from Dolomite Microfluidics (Part No. 3000436) already used in previous works (Kovalchuk et al. Reference Kovalchuk, Roumpea, Nowak, Chinaud, Angeli and Simmons2018; Roumpea et al. Reference Roumpea, Kovalchuk, Chinaud, Nowak, Simmons and Angeli2019). At the cross-junction the inlet dimensions are  $195\,{\rm \mu}{\rm m}\times 190\,{\rm \mu}{\rm m}$ (width $\times$ depth) and the dimensions of the main channel are $390\,{\rm \mu}{\rm m} \times 190\,{\rm \mu}{\rm m}$ (width $\times$ depth). The continuous phase was introduced via the side channels and then the aqueous phase via the central channel of the junction (see figure 1a). For all configurations, silicone oil (Clearco, density: $\rho _c = 920$ kg m $^{-3}$, viscosity: $\mu _c = 4.6$ mPa s at 20 $^\circ$C) was used as the continuous phase and a mixture of 52 % w/w glycerol and 48 % w/w water (Sigma Aldrich, $\geq$99.5 %, density: $\rho _d = 1132$ kg m $^{-3}$, viscosity $\mu _d = 6.8$ mPa s at 20 $^{\circ }$C) with and without surfactant was selected as the dispersed phase. Based on the work of Kalli et al. (Reference Kalli, Chagot and Angeli2022), the flow rates were selected to form drops in the dripping regime. Using syringe pumps (KDS Scientific, ${\pm }5\times 10^{-9}$ ml min $^{-1}$), the continuous phase was introduced with a total flow rate $Q_c=0.12$ ml min $^{-1}$, while the dispersed phase had a flow rate of $Q_d=0.01,0.02$ ml min $^{-1}$. To observe the impact of interfacial tension on the drop formation, several concentrations of the non-ionic surfactant Triton X-100 (TX100), (Acros organics, $M_w = 646.85$ g mol $^{-1}$, $\ge$95 %) were dissolved in the dispersed phase at concentrations of $(0.1, 0.2, 0.6, 1.0, 1.4, 2.1, 2.9, 4.3, 5.7, 8.6)\times {\rm CMC}$. Figure 1(b) shows the equilibrium interfacial tension values ( $\sigma$), normalised by the final equilibrium interfacial tension value at ${\rm CMC} = 3.5$ mM ( $\sigma _{\varGamma =\varGamma _{\infty }} = 2.9$ mN m $^{-1}$) as measured using a Du Noüy ring attached to a Force K100 Tensiometer (Krüss GmbH).

Figure 1. (a) Numerical configuration, and an illustrative snapshot of a top view of the interface (top), and the corresponding high-speed image from experiments (bottom); (b) interfacial tension isotherm for TX100 surfactant showing the variation of equilibrium interfacial tension,  $\sigma$. Black points represent dimensionless $\tilde {\sigma }$ (normalised by the surfactant-free value of interfacial tension, $\sigma _s$) with the semi-log variation of the dimensionless surfactant bulk concentration $\tilde {C}$ (normalised by the CMC). Red points represent the dimensionless interfacial surfactant concentration, $\tilde {\varGamma }$ (normalised by $\varGamma$ saturation value, $\varGamma _{\infty }$) obtained using (3.7) and $\varGamma = \varGamma _{\infty }K_L C/(1+K_L C)$. The blue dashed line represents the fitting of $\tilde {\sigma }=1+0.1\ln (1-\tilde {\varGamma })$; (c) geometrical details of the microfluidic channel decomposed into $240=30 \times 8 \times 1$ subdomains. Each subdomain contains an equal and structured mesh resolution of $32^3$, for a total of $960\times 256 \times 32$ cells.
2.2. Optical techniques
The experimental set-up is shown in figure 2. Two different illumination modes were used for the  $\mu$PIV or the high-speed imaging (HSI). To allow full optical access for all measurements and avoid optical distortions, in particular close to the channel wall, both phases were selected to match the refractive index of the glass microchannel ( $n_i = 1.39$). For both modes, the images were taken with a 12-bit high-speed camera (Phantom v1212, $1 280 \times 800$ pixels resolution). In the HSI experiments, the acquisition frequency was 10 000 Hz and the camera was equipped with a Nivatar $\times$20 zoom lens and an LED backlight for illumination. Results were averaged for at least 15 drops (drop size polydispersity $\leq$1.2 %). The experimental error is 3 ${\rm \mu}$m per pixel for the spatial resolution and 0.1 ms for the time resolution.

Figure 2. Experimental set-up of the HSI and  $\mu$PIV techniques.
The high-speed  $\mu$PIV experiments were performed by switching modes from the LED light (2) to the laser source (1) as shown in figure 2. The laser illumination was generated with a high-speed 60 W pulsed Nd-Yag (Litron), which allows the observation in time of the droplet generation. The dispersed phase was seeded with 1 ${\rm \mu}$m carboxylate-modified microspheres FluoSpheres, with an absorbance of 542 nm and an emission of 612 nm. For the PIV image pairs, the camera was equipped with a $\times$20 microscope lens (Mitutoyo Ltd) and focal depth of 1.6 ${\rm \mu}$m. The lens was mounted with a high-pass filter ( ${>}565$ nm) to eliminate reflections from the channel walls. Moreover, to be able to follow the interface during the PIV measurements, a small amount of rhodamine B (with absorbance of 510 nm and emission of 610 nm) was added in the dispersed phase (0.05 ppm). The high-speed $\mu$PIV allows measurements in the channel centre during drop formation, which follow the whole process from the expansion $t=t_{exp}$ to the pinch-off stage $t=t_{pin}$. For each measurement, 2000 image pairs were acquired at a frequency of 3000 Hz which represent $\sim$20 drop formation cycles. The measurements were performed in the entire channel width ( $y/l_c\in [-1, 1]$, with $y$ the transverse direction) and around the droplet emergence area ( $x/l_c\in [-2,2]$, with $x$ the streamwise direction). The local coordinate system is defined in figure 1(a) where $(x,y)=(0,0)$ is the centre of the cross-junction. All velocity fields were computed with the free PIV software CPIV-IMFT developed at IMFT. It is based on an FFT cross-correlation method with peak-locking reduction schemes and parallelisation. In the processing, $16\times 16$ pixels interrogation boxes and 50 % overlap were used, yielding a grid resolution of 1.4 ${\rm \mu}$m.
3. Numerical formulation, scaling and validation
3.1. Numerical formulation and problem statement
As mentioned in § 2, the microfluidic channel used in this study consists of a combination of both cross-junction and flow-focusing devices. Its computational representation and dimensions are illustrated in figure 1(c). The four branches of this device are identical with an oval cross-section shape of length  $l_c = 390\,{\rm \mu}$m and width $w_c = 190\,{\rm \mu}$m. This cross-section is comprised a rectangular piece of dimensions $w_{c} \times (l_{c} - w_{c})$ connected to two semicircles of diameter $w_{c}$. Figure 1(c) also shows the three-dimensional computational domain and its decomposition into $240=30\times 8\times 1$ sub-domains used for the message passing interface computing protocol. The numerical construction of this device follows a similar approach as that used in Kahouadji et al. (Reference Kahouadji, Nowak, Kovalchuk, Chergui, Juric, Shin, Simmons, Craster and Matar2018). This approach bypasses the typical obstacles in construction and meshing that arise when handling complex geometries by employing a static distance function for several primitive objects (e.g. cylinders, planes, and tori), and simple algebraic operations between them, such as ‘union’ and ‘intersection’.
The flow is considered incompressible and both the continuous and dispersed phases are assumed to be Newtonian. The following scaling is adopted to non-dimensionalise the equations governing the flow dynamics coupled to the surfactant transport in the bulk of the dispersed phase and at the interface:
 \begin{equation} \left.\begin{gathered}
\tilde{\boldsymbol{x}}=\frac{\boldsymbol{x}}{l_c},\quad
\tilde{\boldsymbol{u}}=\frac{\boldsymbol{u}} {U_{sc}},\quad
\tilde{t}=\frac{t}{l_c/U_{sc}},\quad
\tilde{p}=\frac{p}{\mu_{c}U_{sc}/l_{c}},\quad
\tilde{\sigma} = \frac{\sigma}{\sigma_s},\\
\tilde{\varGamma}=\frac{\varGamma}{\varGamma_\infty},\quad
\tilde{C}=\frac{C}{CMC},\quad
\widetilde{C_s}=\frac{C_s}{CMC}. \end{gathered}\right\}
\end{equation}
\begin{equation} \left.\begin{gathered}
\tilde{\boldsymbol{x}}=\frac{\boldsymbol{x}}{l_c},\quad
\tilde{\boldsymbol{u}}=\frac{\boldsymbol{u}} {U_{sc}},\quad
\tilde{t}=\frac{t}{l_c/U_{sc}},\quad
\tilde{p}=\frac{p}{\mu_{c}U_{sc}/l_{c}},\quad
\tilde{\sigma} = \frac{\sigma}{\sigma_s},\\
\tilde{\varGamma}=\frac{\varGamma}{\varGamma_\infty},\quad
\tilde{C}=\frac{C}{CMC},\quad
\widetilde{C_s}=\frac{C_s}{CMC}. \end{gathered}\right\}
\end{equation}
Here, the tildes designate dimensionless quantities, and  $\boldsymbol {x}$, $t$,
$t$,  $\boldsymbol {u}$ and $p$ are the spatial coordinate, time, velocity and pressure, respectively; the interface surfactant concentration is represented by $\varGamma$, $C$ and $C_{s}$ are the concentrations at the bulk and the bulk sub-phase, located immediately adjacent to the interface, respectively (Shin et al. Reference Shin, Chergui, Juric, Kahouadji, Matar and Craster2018; Batchvarov et al. Reference Batchvarov, Kahouadji, Magnini, Constante-Amores, Shin, Chergui, Juric, Craster and Matar2020; Constante-Amores et al. Reference Constante-Amores, Kahouadji, Batchvarov, Shin, Chergui, Juric and Matar2020, Reference Constante-Amores, Batchvarov, Kahouadji, Shin, Chergui, Juric and Matar2021a,Reference Constante-Amores, Kahouadji, Batchvarov, Shin, Chergui, Juric and Matarb), and $\sigma$ is the local interfacial tension varying as function of $\varGamma$. The length scale $l_c$, the average surface velocity of the continuous phase in the main portion of the channel, $U_{sc} = Q_{c}/A$ ( $A = l_c w_c + ({\rm \pi} /4 -1)w_c^2$), the interfacial tension in a surfactant-free system, $\sigma _{s}$, the saturation interfacial concentration, $\varGamma _{\infty }$, and the CMC, are used as the characteristic length, velocity, interfacial tension and interfacial and bulk surfactant concentration scales, respectively; $\rho _c$ and $\mu _c$ are the continuous phase density and dynamical viscosity, respectively. The dimensionless governing equations for the flow and surfactant transport are formulated in (3.2)–(3.7):
 \begin{gather} \boldsymbol{\nabla}\boldsymbol{\cdot} \tilde{\boldsymbol{u}}=0,\quad \tilde{\rho}Re\left(\frac{\partial \tilde{\boldsymbol{u}}}{\partial \tilde{t}}+ \tilde{\boldsymbol{u}} \boldsymbol{\cdot}\boldsymbol{\nabla} \tilde{\boldsymbol{u}}\right) =- \boldsymbol{\nabla} \tilde{p} + \boldsymbol{\nabla}\boldsymbol{\cdot} \left [ \tilde{\mu} (\boldsymbol{\nabla} \tilde{\boldsymbol{u}} +\boldsymbol{\nabla} \tilde{\boldsymbol{u}}^{\rm T}) \right ] \nonumber\\ +\,\frac{1}{Ca} \int_{\tilde{A}} \left(\tilde{\sigma} \tilde{\kappa} \boldsymbol{n}+ \boldsymbol{\nabla}_s \tilde{\sigma} \right)\delta \left(\tilde{\boldsymbol{x}} - \tilde{\boldsymbol{x}}_{_f} \right) {\rm d}\tilde{A}, \end{gather}
 \begin{gather} \left.\begin{gathered} \tilde{\rho}\left( \boldsymbol{x},t\right)=\frac{\rho_d}{\rho_c} + \left(1-\frac{\rho_d}{\rho_c}\right) \mathcal{H}\left( \boldsymbol{x},t\right),\\ \tilde{\mu}\left( \boldsymbol{x},t\right)=\frac{\mu _d}{\mu _c}+ \left(1-\frac{\mu _c}{\mu _d}\right) \mathcal{H}\left( \boldsymbol{x},t\right), \end{gathered}\right\} \end{gather}
 $$\begin{gather} \frac{\partial \tilde{\varGamma}}{\partial \tilde{t}}+\boldsymbol{\nabla}_s \boldsymbol{\cdot} (\tilde{\varGamma}\tilde{\boldsymbol{u}}_t)=\frac{1}{Pe_s} \nabla^2_s \tilde{\varGamma}+ Bi \left ( k \widetilde{C_s} (1-\tilde{\varGamma})- \tilde{\varGamma} \right ), \end{gather}$$
 $$\begin{gather}\frac{\partial \tilde{C}} {\partial \tilde{t}}+\tilde{\boldsymbol{u}}\boldsymbol{\cdot} \boldsymbol{\nabla} \tilde{C}= \frac{1}{Pe_c} \boldsymbol{\nabla}\boldsymbol{\cdot}(\boldsymbol{\nabla} \tilde{C}), \end{gather}$$
 $$\begin{gather}\boldsymbol{n}\boldsymbol{\cdot}\boldsymbol{\nabla} \tilde{C} |_{interface}=-Pe_c Da Bi \left ( k \widetilde{C_s} (1-\tilde{\varGamma})- \tilde{\varGamma} \right ), \end{gather}$$
 $$\begin{gather}\tilde{\sigma}=\max\left(\epsilon_{\sigma}, 1 + \beta_s \ln{\left(1 -\tilde{\varGamma}\right)}\right), \end{gather}$$
with  $\epsilon _{\sigma }$ set to 0.05, a numerical threshold to avoid non-physical negative values for $\tilde {\sigma }$. The dimensionless numbers shown in the above equations are defined by
 \begin{equation} \left.\begin{gathered} Re=\frac{\rho_cU_{sc} l_c}{\mu _c};\quad Ca=\frac{\mu _cU_{sc}}{\sigma_s};\quad Pe_c=\frac{U_{sc} l_c}{D_c};\quad Pe_s=\frac{U_{sc} l_c}{D_s};\quad Bi=\frac{k_d l_c}{U_{sc}}; \\ Da=\frac{\varGamma_\infty}{l_c CMC};\quad k=\frac{k_a CMC}{k_d}, \end{gathered}\right\} \end{equation}
where  $Ca$ and $Re$ are the liquid capillary and Reynolds numbers, respectively; in which $\mu _c$ is the continuous phase viscosity; $Pe_c$ and $Pe_s$ are the bulk and interfacial Péclet numbers that represent the interplay between convective and diffusive forces for the surfactant species at the bulk and interface, respectively, in which $D_c$ and $D_s$ are the (constant) surfactant diffusion coefficients in the bulk continuous phase and the plane of the interface, respectively. The Biot number, $Bi$, represents the competition between the time scales of desorption and convection, characterised by $k_d^{-1}$ and $l_c/U_{sc}$, respectively. Finally, $k$ represents the competition between adsorption and desorption time scales, characterised by $(k_{a}CMC)^{-1}$ and $k_{d}^{-1}$, respectively. Lastly, the Damköhler number, $Da$, provides a dimensionless measure of interfacial saturation with surfactant.
The continuity and momentum equations (3.2) are written in a three-dimensional Cartesian domain using a single-fluid formulation.  $\mathcal {H}( \tilde {\boldsymbol {x}},\tilde {t})$ represents a smoothed Heaviside function that takes the value of zero in the continuous phase and unity in the dispersed phase. The normal and tangential components of the interfacial tension force are expressed by the last two terms on the right-hand side of (3.2), respectively. The latter term representing the interfacial tension gradients across the interface, which give rise to Marangoni stresses; $\tilde {\kappa }$ corresponds to the interface curvature and $\delta (\tilde {\boldsymbol {x}}-\tilde {\boldsymbol {x}}_f)$ is the three-dimensional Dirac delta function equal to unity at the interface ( $\tilde {\boldsymbol {x}} = \tilde {\boldsymbol {x}}_f$) and zero elsewhere. In (3.4), $\boldsymbol {\nabla }_s = (\boldsymbol {I} - \boldsymbol {n}\boldsymbol {n})\boldsymbol {\cdot }\boldsymbol {\nabla }$ is the surface gradient operator, $\boldsymbol {n}$ is the outward-pointing unit normal to the interface, and $\boldsymbol {I}$ is the identity tensor; $\tilde {\boldsymbol {u}}_t=(\tilde {\boldsymbol {u}}_s \boldsymbol {\cdot }\tilde {\boldsymbol {t}})\tilde {\boldsymbol {t}}$ corresponds to the tangential velocity, where $\tilde {\boldsymbol {u}}_s$ is the surface velocity, and ${\boldsymbol {t}}$ is the unit vector tangent to the interface. The last terms on the right-hand side of (3.4) and (3.7) represent the source term for surfactant exchange between the interface and the section of the bulk immediately adjacent to the interface.
As seen from figure 1(b) and (3.7), the dependence of  $\sigma$ on $\varGamma$ is described by a nonlinear Langmuir equation of state in which $\beta _{s} = \Re T\varGamma _{\infty }/\sigma _{s}$ modulates this dependency, as suggested by Muradoglu & Tryggvason (Reference Muradoglu and Tryggvason2014); $\Re$ and $T$ are the ideal gas constant and the temperature, respectively. The components of the interfacial tension force that induce Marangoni stresses can be written in terms of $\varGamma$ by
 \begin{equation} \frac{1}{Ca} \boldsymbol{\nabla}_s \tilde{\sigma}\boldsymbol{\cdot} {\boldsymbol{t}} \equiv \frac{\tilde{\tau}}{Ca}=-Ma\frac{1}{(1-\tilde{\varGamma})}\boldsymbol{\nabla}_s \tilde{\varGamma}\boldsymbol{\cdot} {\boldsymbol{t}}, \end{equation}
where  $\tilde {\tau }$ is the dimensionless Marangoni stress and $Ma\equiv \beta _s/Ca$ represents a Marangoni parameter.
From the properties of TX100 and the operating conditions of the system, the relevant dimensionless numbers that characterise the system are given by  $Re = 2.35$, $Ca = 4.33\times 10^{-3}$, $Pe_{c} = Pe_{d} = 2.35\times 10^{5}$, $Bi = 8.41\times 10^{-5}$, $Da = 1.04\times 10^{-3}$, $k = 5.55\times 10^{3}$, $\beta _{s} = 0.10$ and $Ma = 23.08$. We define a capillary time scale as $\tau _{cap} = \sqrt {\rho _{c}l^{3}_{c}/\sigma _{s}} = 1.31\times 10^{-3}$ s, a velocity time scale as $\tau _{vel} = \sqrt {\sigma _{s}/(\rho _{c}l_{c})} = 2.99\times 10^{-1}$ s and a Marangoni time scale as $\tau _{mar} = \mu_{c}l_{c}/{\rm \Delta} \sigma = 6.16\times 10^{-5}$ s. Here, it has been assumed that $D_{c} = D_{s} = \mathcal {D}$, and $\varGamma _{\infty }$ and $K_L = k/CMC$ were found by fitting the experimental data in figure 1(b) to the Langmuir–Szyszkowski equation (Teipel & Aksel Reference Teipel and Aksel2001), as in previous work (Kalli et al. Reference Kalli, Chagot and Angeli2022); $\varGamma$ was calculated using the Langmuir equation of state with the measured experimental values of $\sigma$ for each $C$ (see (3.7) and $\varGamma = \varGamma _{\infty }K_L C/(1+K_L C)$) and plotted in a dimensionless form on the secondary axis of figure 1(b). Using the literature value of TX100 desorption in water ( $k_{d}$) (Gassin et al. Reference Gassin, Martin-Gassin, Meyer, Dufrêche and Diat2012), $k_{a}$ was calculated using $k_{a} = K_L k_{d}$ and shown in table 1. Finally, the diffusion coefficient, $\mathcal {D}$, was estimated using the Wilke–Chang correlation (Wilke & Chang Reference Wilke and Chang1955).
Table 1. Physical properties of TX100 surfactant*.

* $k_{d}$ was obtained from Gassin et al. (Reference Gassin, Martin-Gassin, Meyer, Dufrêche and Diat2012) and the rest of the parameters were calculated experimentally as explained in § 3.1
Fully three-dimensional direct numerical simulations were performed within the context of the level contour reconstruction method for the interface advection, as previously detailed in Shin & Juric (Reference Shin and Juric2002) and Shin et al. (Reference Shin, Abdel-Khalik, Daru and Juric2005, Reference Shin, Chergui, Juric, Kahouadji, Matar and Craster2018) and Shin, Chergui & Juric (Reference Shin, Chergui and Juric2017). This method handles the interface and the forces arising from surface tension through a hybrid front-tracking/level-set technique in conjunction with surfactant transport at the interface and bulk. At the inlet branches, an analytical solution following a Poiseuille profile is set for the velocity, together with a Neumann condition for the pressure ( $\partial p/\partial \boldsymbol {n} = 0$). The full derivation of this velocity profile ((3.10) in dimensionless form) in the cross-section shown in figure 1(c) (right) can be found in § A. At the outlet, a Neumann condition is specified for both velocity and pressure. The walls are treated as no-slip boundaries. For the surfactant-laden cases, Neumann conditions are set for surfactant concentration on all boundaries, with the exception of the disperse phase inlet. For this inlet, $C$ is specified as a constant value according to the experimental set-up ( $\tilde {C} = 0.006$, $\tilde {C} = 0.06$ and $\tilde {C} = 0.21$) and $\varGamma$ as calculated in figure 1(b)
 \begin{equation}
\tilde{\boldsymbol{u}}(\tilde{x},\tilde{y})=\begin{cases}
\tilde{\mathcal{A}}\left(\dfrac{(\tilde{y}-\widetilde{y_{0}})^{2}}{\widetilde{R^{2}}}-1\right)
& \text{if } |\tilde{x}-\widetilde{x_{0}}|\le \tilde{L}
\\
\tilde{\mathcal{A}}\left(\dfrac{(\tilde{x}-\widetilde{x_{0}}-\tilde{L})^{2}}{\tilde{R}^{2}}
+
\dfrac{(\tilde{y}-\widetilde{y_{0}})^{2}}{\widetilde{R^{2}}}
-1\right) & \text{otherwise}, \end{cases}
\end{equation}
\begin{equation}
\tilde{\boldsymbol{u}}(\tilde{x},\tilde{y})=\begin{cases}
\tilde{\mathcal{A}}\left(\dfrac{(\tilde{y}-\widetilde{y_{0}})^{2}}{\widetilde{R^{2}}}-1\right)
& \text{if } |\tilde{x}-\widetilde{x_{0}}|\le \tilde{L}
\\
\tilde{\mathcal{A}}\left(\dfrac{(\tilde{x}-\widetilde{x_{0}}-\tilde{L})^{2}}{\tilde{R}^{2}}
+
\dfrac{(\tilde{y}-\widetilde{y_{0}})^{2}}{\widetilde{R^{2}}}
-1\right) & \text{otherwise}, \end{cases}
\end{equation}
where  $\mathcal {A} = {-Q}/{(\frac {8}{3}RL + ({{\rm \pi} }/{2})R^{2})}$, $Q$ represents the flow rate of the phase on each inlet (continuous for the two lateral branches and disperse for the central branch), $x_{0}$ and $y_{0}$ are the coordinates of the centre points of the inlet cross sections, and $R = w_{c}/2$ and $L = (l_{c} - w_{c})/2$, as highlighted in figure 1(c). Each variable has been non-dimensionalised according to the scaling parameters described previously, with $\tilde {\mathcal {A}} = {-\tilde {Q} U_{sc}}/{(\frac {8}{3}\tilde {R}\tilde {L} + ({{\rm \pi} }/{2})\tilde {R}^{2})}$.
3.2. Validation
The numerical simulation in an identical geometry was validated experimentally with a surfactant-free system in previous work (Kahouadji et al. Reference Kahouadji, Nowak, Kovalchuk, Chergui, Juric, Shin, Simmons, Craster and Matar2018). Further validation with experimental results for surfactant-laden cases is made in this section. As seen in previous work (Kalli et al. Reference Kalli, Chagot and Angeli2022), a semi-empirical model can be developed to relate the dimensionless drop diameter to the capillary number (and thus the global value of interfacial tension); drop size is found to be proportional to the  $Ca$ in a microfluidic system in the presence of surfactants. As a result, the addition of surfactant is expected to result in smaller drops with shorter formation times, due to the lower interfacial tension.
Figure 3(a) shows the effect of surfactant addition on the drop diameter for  $Q_c = 0.12$ and 0.01 ml min $^{-1}$ $\leq Q_d \leq 0.02$ ml min $^{-1}$, using HSI, $\mu$PIV and CFD. As $\tilde {C}$ increases from 0 to 5.7, the dimensionless drop diameter $d/l_c$ decreases for both flow rates, due to the lower interfacial tension. Larger drops are observed at higher $Q_d$ as expected. The effect of surfactant addition on the drop formation time for $Q_c = 0.12$ and 0.01 ml min $^{-1}$ $\leq Q_{d} \leq 0.02$ ml min $^{-1}$ is shown in figure 3(b). As $\tilde {C}$ increases from 0 to 5.7, the dimensionless formation time $\tilde {t}$ decreases for both flow rates, due to lower interfacial tension. Shorter formation times are observed at larger $Q_d$, as opposed to drop diameter. The above results are compared with the numerical simulations and good agreement is found, with an average error of 0.8 % for $d/l_c$ and 2.4 % for $\tilde {t}$. The HSI experiments also agreed well with the $\mu$PIV results, as seen from figure 3 with an error below 1 %.

Figure 3. Effect of TX100 concentration on dimensionless drop (a) diameter ( $d/l_c$) and (b) formation time ( $\tilde {t}$) using HSI, $\mu$PIV, CFD and the Bayesian regularised artificial neural network (BRANN) model from Chagot et al. (Reference Chagot, Quilodrán-Casas, Kalli, Kovalchuk, Simmons, Matar, Arcucci and Angeli2022).
Moreover, a prediction of the drop size was obtained by using a data-driven model (Chagot et al. Reference Chagot, Quilodrán-Casas, Kalli, Kovalchuk, Simmons, Matar, Arcucci and Angeli2022). As discussed by Kalli et al. (Reference Kalli, Chagot and Angeli2022), the dynamic interfacial tension should be used to obtain accurate drop size predictions, but it is difficult to be obtained experimentally. For this reason, CFD should preferably be used to estimate the droplet volume in the presence of surfactants. Alternatively, data-driven models can also be used if there is a large database available.
4. Results and discussion
The vortical structures and the velocity fields obtained from the CFD simulations and the high-speed  $\mu$PIV experiments in surfactant-free and surfactant-laden systems, as well as the concentration profiles in the bulk and at the interface are discussed here, for all stages of the drop formation process. The results for the surfactant-free case will be discussed first to show the spatio-temporal evolution of the interface, as well as the vortical structures during each stage. In addition, the surfactant concentrations in the bulk and at the interface for the various stages of drop formation will be discussed based on the CFD simulations.
4.1. Surfactant-free case
The spatio-temporal evolution of the interface during the complete drop formation process was first simulated for the surfactant-free case. Figure 4 shows the changes in the shape of the interface during expansion (a), necking (b) and pinch-off (c) for  $Q_d = 0.02$ and $Q_c = 0.12$ ml min $^{-1}$. A different output time step is used for each stage equal to 1, 0.5, and 0.1 ms, respectively, with the longest one used for the expansion stage and the shortest for pinch-off. Specifically, the evolution of the interface is slow during expansion, becomes moderately rapid during necking and very rapid just before pinch-off. In previous work, expansion times were also found to be longer compared with necking ones, for both surfactant-free and surfactant-laden cases in the dripping regime (Kalli & Angeli Reference Kalli and Angeli2022). A similar trend was seen by Kahouadji et al. (Reference Kahouadji, Nowak, Kovalchuk, Chergui, Juric, Shin, Simmons, Craster and Matar2018) for pancake-shaped drops. The vortical structures inside the drop are shown in figure 4(d) for the expansion and necking stages and in figure 4(e) for pinch-off. The velocity fields from the experiments with and without surfactant are shown in figure 5, which agree very well with the simulation results. Initially for the surfactant-free case (at $\tilde {C} = 0$ and $\tilde {t} = 0.10$, figure 4d), two vortical structures are seen close to the front of the drop which grow larger and move closer to the interface later on (at $\tilde {t} = 0.50$). This is in agreement with the experimental results, where large internal circulation patterns are observed in expansion at $\tilde {t} = 0.10$ and $\tilde {t}=0.50$ (figure 5(a,b) respectively). The circulation pattern is more pronounced in the second stage of expansion ( $\tilde {t} = 0.50$, figure 5b), where two circulation zones are clearly seen, one on each side of the growing drop and high velocities in the middle, reaching a maximum of
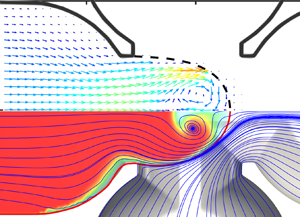
  $|U_{max}|/U_{sc} = 0.45$. From the shape of the interface (black dotted line) it is clear that originally the drop grows in the radial direction, as the continuous phase obstructs the flow of the dispersed phase. The high velocities on the sides of the dispersed phase during expansion suggest that the liquid is mainly transported through the sides of the drop. This is in agreement with observations reported previously by several authors (Pirbodaghi et al. Reference Pirbodaghi, Vigolo, Akbari and DeMello2015; Roumpea et al. Reference Roumpea, Kovalchuk, Chinaud, Nowak, Simmons and Angeli2019). Previous works using ghost particle velocimetry in rectangular flow-focusing microchannels reported a stagnation point at the base of the growing drop, during the second stage of expansion, but no significant circulation in the surfactant-free case (Kiratzis et al. Reference Kiratzis, Kovalchuk, Simmons and Vigolo2022). Even though a stagnation point can be seen in this work during the second stage of expansion (figure 5e), the presence of the strong circulation can be attributed to the higher flow rates used in this study and the differences in microchannel geometries. In rectangular channels, there is corner flow in the gutters of the channel, which is absent in the current work where the channels have an oval cross-section. The gutter flow can also reverse the direction of the flow fields after the drop has formed (Mießner et al. Reference Mießner, Helmers, Lindken and Westerweel2020; Kovalchuk & Simmons Reference Kovalchuk and Simmons2021).

Figure 4. Numerical results for the surfactant-free case generated with  $Q_d = 0.02$ and $Q_c = 0.12$ ml min. (a–c) Depict the spatio-temporal evolution of the interface with time differences between the curves of $1$,
$1$,  $0.5$ and $0.1$ ms, respectively; (d) highlights the vortical structures for three different times that can also be compared with experimental PIV of figure 5(a–c) (shown in red lines); (e) shows the development of a neck followed by pinch-off which is accompanied by satellite formation; (f) shows top views of the periodic drop formation in the channel with a period of 13.5 ms.

Figure 5. Effect of TX100 concentration on velocity fields from PIV measurements during expansion and necking stages at  $Q_d = 0.02$ ml min $^{-1}$ for (a–c) $\tilde {C} = 0$, (d–f) $\tilde {C} = 0.06$ and (g–i) $\tilde {C} = 2.89$.
As the drop grows, it obstructs the inlet of the oil phase, which now pushes the interface perpendicular to the drop and changes its curvature. This marks the beginning of the necking stage, with the neck defined as the bridge between the growing drop and the dispersed phase remaining attached to the inlet. The curvature of the interface becomes negative and the pressure build-up from the continuous phase causes the flow to be higher in the neck compared with the rest of the dispersed phase (with  $|U_{max}|/U_{sc} = 0.25$), while the velocities near the interface decrease. In addition, the vortical structures decrease in size ( $\tilde {t} = 0.67$ in figures 4(d) and 5(c)). This indicates that the transport of the dispersed phase from the sides is significantly weaker than in the expansion stage. As the process approaches pinch-off (see figure 4(e), left panel), large vortical structures form in the region of the dispersed phase that remains attached to the inlet. Immediately after the pinch-off, the vortical structures grow large in the middle of the cross-junction (figure 4(e), right panel). This vortex dipole just before and at pinch-off was also observed during the formation of surfactant-free plugs (Kahouadji et al. Reference Kahouadji, Nowak, Kovalchuk, Chergui, Juric, Shin, Simmons, Craster and Matar2018). Another agreement between the two works is the stagnation point present just at the location of pinch-off. A small satellite drop is also seen at the point where the neck broke. The distance between four subsequent drops is equal, as shown in figure 4(f), indicating that the drop formation process is periodic with exactly the same formation time of 13.5 ms in each cycle.
4.2. Surfactant-laden cases
4.2.1. Expansion and necking stages
Upon addition of the TX100 surfactant at  $\tilde {C} = 0.06$, the velocity fields change significantly from their surfactant-free counterparts throughout all stages of the drop formation process. At the start (see figure 5(d) at $\tilde {t} = 0.08$), the average velocities appear higher and more uniform at the back of the forming drop and a less intense circulation pattern can be seen in the centre. The two circulation zones still appear in the second phase of the expansion stage (see figure 5(e) at $\tilde {t} = 0.33$), however, their velocities are lower than in the surfactant-free case. During the necking stage at TX100 concentrations below CMC (figure 5f), higher velocities are observed near the neck, with maximum values of $|U_{max}|/U_{sc} = 0.45$. The reduced interfacial tension due to the presence of surfactant accelerates the neck thinning and results in high velocities (figure 5(f) at $\tilde {t} = 0.41$), as also observed by Kiratzis et al. (Reference Kiratzis, Kovalchuk, Simmons and Vigolo2022). The circulation pattern completely disappears during necking at low TX100 concentrations, which agreed with the CFD simulations. For concentrations above the CMC, during the first expansion phase (see figure 5(g) at $\tilde {t} = 0.05$), velocities are high inside the whole of the growing drop, reaching a maximum of $|U_{max}|/U_{SC} = 0.4$. Velocities then increase significantly as shown in figure 5(h–i) as the drop expands into the main channel, and at the necking stage at $\tilde {t} = 0.18$ and 0.26, reaching a $|U_{max}|/U_{sc} = 0.5$.
4.2.2. Pinch-off
Pinch-off is further discussed in this section, using both the numerical and experimental results. The effect of TX100 surfactant on drop shape and velocity fields at pinch-off from HSI and  $\mu$PIV experiments, as well as CFD simulations at $Q_d = 0.02$ ml min $^{-1}$ as shown in figure 6. As can be seen in figure 6(a,d,g), smaller droplets are formed upon TX100 addition and satellite drops are seen after pinch-off. It should be noted that the shadow from the edge of the channel observed when using HSI does not exist in the $\mu$PIV images, which can mislead the comparison of the droplet sizes in figure 6(c,f). In the case of no surfactant present, high velocities at the rear of the formed drop and circulation patterns in the dispersed phase remaining attached to the inlet are seen in figure 6(b,c) (see also figure 4). The higher velocities at the rear of the drop, as opposed to its front, are also observed in the surfactant-free simulations of Zhao et al. (Reference Zhao, Riaud, Luo, Jin and Cheng2015). Similar observations were reported from CFD simulations of mass transfer in a flow-focusing microchannel by Lan et al. (Reference Lan, Li, Wang and Luo2014).

Figure 6. Effect of TX100 concentration on velocity fields from HSI experiments (a,d,g), PIV measurements (b,e,h) and CFD (c,f,i) at the pinch-off point for 0.02 ml min $^{-1}$ for (a–c) $\tilde {C} = 0$, (d–f) $\tilde {C} = 0.06$ and (g–i) $\tilde {C} = 2.89$.
When surfactant is added at concentrations below CMC, smaller droplets form due to the lower interfacial tension, and a weaker circulation pattern is seen at the remaining dispersed phase. The velocities inside the formed droplet are higher compared with the surfactant-free case (figure 6(e,f) at  $\tilde {C} = 0.06$). A stagnation point is also observed in the CFD output just at pinch-off for both surfactant-free and surfactant-laden cases. At concentrations above the CMC, the experimental $\mu$PIV results show that the circulation pattern completely disappears and uniform velocity fields are observed in the formed droplet, with $|U_{max}|/U_{sc} = 0.5$ (figure 6(h) at $\tilde {C} = 2.89$). As was discussed above, the model does not account for micelle formation, and no numerical results are shown for concentrations above CMC.
4.2.3. Concentration distribution
Figure 7 shows the relative bulk concentration of the TX100 surfactant (a),  $\tilde {C}$, the vortical structures (b) and the interfacial concentration (c), ( $\tilde {\varGamma }$), during the drop formation process at concentrations below CMC ( $\tilde {C} = 0.06$). The concentration profile of the surfactant in the bulk follows the circulation patterns as seen in the expansion stage ( $\tilde {t} = 0.39$, top of figure 7a,b). During the necking stage, the circulation is weaker and the surfactant transfers downstream, following the drop growth and into the main channel ( $\tilde {t} = 0.78$). Just before pinch-off, the two circulation zones in the drop disappear and the concentration of surfactant is high at the rear of the drop ( $\tilde {t} = 0.98$). Large circulation patterns appear at the front of the phase remaining attached to the inlet, which grow larger after drop detachment ( $\tilde {t} = 0.99$). Interestingly, the small satellite drop appears to have no surfactant. As also observed in the $\mu$PIV experiments, the circulation zones in all stages are smaller compared with the surfactant-free case. This is possibly due to Marangoni forces acting in the opposite direction to the circulation when surfactant is present.

Figure 7. Spatio-temporal evolution of (a) the relative bulk surfactant concentration  $\tilde {C}$, (b) the vortical structures in the channel reference frame and (c) the relative interfacial surfactant concentration $\tilde {\varGamma }$, respectively. The snapshots from top to bottom correspond to times $\tilde {t} = 0.39$, $0.78$, $0.98$ and $0.99$, respectively, and $\tilde {C}=0.06$.
As previously discussed, information on the surfactant concentration at the interface is paramount in understanding the effect of TX100 on the drop formation process. The spatio-temporal evolution of the relative interfacial concentration ( $\tilde {\varGamma }$) is shown in figure 7(c). As can be noticed, the interfacial concentration of the surfactant is high (and equal to the equilibrium value) at the left part of the channel, and before the cross-junction where the interface forms. At the interface there is initially very little surfactant concentration, apart from the tip of the drop. Even at the tip, however, the concentration is below the equilibrium value. This concentration profile remains at all stages of the formation process, including expansion (top), necking (middle) and pinch-off (bottom). The difference in surfactant concentration along the interface will cause Marangoni stresses that can affect the drop formation time and the velocity fields inside the drop; this will be discussed further in § 4.2.4.
4.2.4. Marangoni stresses
Marangoni stresses are usually discussed in works for drop coalescence (Dong et al. Reference Dong, Weheliye and Angeli2019; Constante-Amores et al. Reference Constante-Amores, Batchvarov, Kahouadji, Shin, Chergui, Juric and Matar2021a), rising bubbles (Bastani et al. Reference Bastani, Fayzi, Lotfi and Arzideh2018), liquid bridges (Kovalchuk, Nowak & Simmons Reference Kovalchuk, Nowak and Simmons2017; Kamat et al. Reference Kamat, Wagoner, Thete and Basaran2018) and jet formation (Antonopoulou et al. Reference Antonopoulou, Harlen, Rump, Segers and Walkley2021), but less frequently during the fast process of drop formation. In this section, Marangoni stresses at the interface will be calculated and presented as a function of time, space and dispersed phase flow rate for the first time during the whole drop formation process. Additionally, the competition between Marangoni stresses and the interfacial tension reduction caused by the surfactant absorption will be explored in all dimensions of the forming drop.
Figure 8 shows the shape of the interface and the dimensionless interfacial concentration of surfactant during drop formation, with the magnitude of  $\tilde {\varGamma }$ shown in colour in (a,b) for top ( $x$–
$x$– $y$ plane) and side ( $x$–
$x$– $z$ plane) views, respectively. The corresponding local interfacial tension ( $\sigma /\sigma _s$) and the Marangoni stress ( $\boldsymbol {\nabla }(\sigma /\sigma _s)\boldsymbol {\cdot } \boldsymbol {t}$) are shown in figures 8(c,d) and 8(e,f), respectively. The 3 profiles represent the expansion stage at $\tilde {t} = 0.39$, the initial part of the necking stage at $\tilde {t} = 0.78$ and the final part of necking before pinch-off at $\tilde {t} = 0.98$, for $Q_d = 0.02$ and $Q_c = 0.12$ ml min $^{-1}$. The concentration gradient at the interface decreases as the drop grows, with the concentration at the drop tip reaching a maximum of $\tilde {\varGamma } = 0.58$ at $\tilde {t} = 0.39$, which decreases to $\tilde {\varGamma } = 0.48$ at $\tilde {t} = 0.78$ and $\tilde {\varGamma } = 0.35$ at $\tilde {t} = 0.98$ (as also seen in figure 7c). This causes a weaker interfacial tension gradient for the top view as observed from the slope in figure 8(c) which decreases as the drop forms. The Marangoni stresses on the interface are small and in the opposite direction to the flow, as seen from the negative peaks in figure 8(e) with $\boldsymbol {\nabla }(\sigma /\sigma _s) = -2.4, -0.7$ and $-$0.3 at $\tilde {t} = 0.39, 0.78$ and $0.98$ respectively ( $0.4 < x/l_c < 1.2$). The positive peak in the direction of the forming drop, around $x/l_c = 0$ in the range of $0.0 < x/l_c < 0.2$ with $\boldsymbol {\nabla }(\sigma /\sigma _s )\boldsymbol {\cdot } \boldsymbol {t} \sim 1.5$ exists for all three stages, but is far from the neck region to contribute to pinch-off.

Figure 8. Quantitative measures highlighting (a,b) the interface shape and the interfacial surfactant distribution with the magnitude of  $\varGamma /\varGamma _\infty$ shown in colour, (c,d) the corresponding local interfacial tension $\sigma /\sigma _s$ and (e,f) the Marangoni stress $\boldsymbol {\nabla }(\sigma /\sigma _s )\boldsymbol {\cdot } \boldsymbol {t}$, for top and side views, respectively. The dashed lines in (e) correspond to $Q_{d} = 0.01$ ml min $^{-1}$ at equivalent times in each stage.
The flow of the continuous phase from both the top and bottom inlets ( $Q_c = 0.12$ ml min $^{-1}$) is high enough to sweep surfactant molecules away from the neck towards both sides of the neck and results in an essentially surfactant-free interface at the neck region. The depletion of surfactant in the neck area in the range $0.2 < x/l_c < 0.9$ (as also seen in figure 7c) and the flat concentration profile of $\tilde {\varGamma }$ shows that there are no Marangoni stresses to affect the process of pinch-off. The shorter drop formation times observed when surfactants are present are caused by the lower interfacial tension compared with the surfactant-free case. The effect of this dominates over Marangoni stresses as the high continuous phase flow rate cleans the interface during the whole formation process (see figure 8). The maximum in $\tilde {\varGamma }$ at all times close to the drop tip causes local Marangoni stresses in that area whose strength decreases with time. These stresses slow down the velocity inside the drop and weaken the circulation intensity (as discussed in § 4.2) rather than delay pinch-off. This is opposite to the case of jet formation where Marangoni stresses delay break-up and result in longer times to pinch-off (Kalli & Angeli Reference Kalli and Angeli2022). Additionally, the presence of surfactant in both stages of expansion (side view in figure 8b) can justify the lower times observed during expansion in the surfactant-laden cases (figure 5d,e,g,h), as opposed to the surfactant-free experiments (figure 5a,b). Thus, it can be inferred that the expansion stage leads the drop formation process (Kalli & Angeli Reference Kalli and Angeli2022) and is the main contributor in decreasing the formation time in the surfactant-laden cases, as opposed to necking and pinch-off.
The Marangoni stresses were also calculated for a lower dispersed phase flow rate ( $Q_d = 0.01$ ml min $^{-1}$), as shown with dashed lines in figure 8(e). As it can be seen, at a lower dispersed phase flow rate, the Marangoni stresses are lower during expansion but higher during necking compared with the $Q_d = 0.02$ ml min $^{-1}$ case. However, in both cases the Marangoni stresses are low, with $\boldsymbol {\nabla }(\sigma /\sigma _s )\boldsymbol {\cdot } \boldsymbol {t} = 0.8$ for $Q_d = 0.01$ ml min $^{-1}$ and $\boldsymbol {\nabla }(\sigma /\sigma _s )\boldsymbol {\cdot } \boldsymbol {t} = 0.3$ for $Q_d = 0.02$ ml min $^{-1}$ and away from the pinch-off point. In fact, just at the pinch-off location ( $x/l_c = 0.5$), $\boldsymbol {\nabla }(\sigma /\sigma _s )\boldsymbol {\cdot } \boldsymbol {t} = 0$, which confirms that Marangoni stresses do not contribute to the pinch-off point at the conditions studied in this work.
The influence of the continuous phase flow rate on the surfactant distribution at the interface is obvious when the top and side views are compared. The surfactant concentration distribution at the interface is less uniform in the side than in the top view, while the neck area has some surfactant, apart from the last part of the necking stage (figure 8b). This results in a lower interfacial tension overall, which will contribute to the decrease in drop formation time. Marangoni stresses now appear with peaks close to the neck region in the range  $0.1 < x/l_c < 0.3$ at $\tilde {t} = 0.78$ and $0.1 < x/l_c < 0.2$ at $\tilde {t} = 0.98$. Nonetheless, their magnitude is small ( $\boldsymbol {\nabla }(\sigma /\sigma _s )\boldsymbol {\cdot } \boldsymbol {t} < 1$) and they are not close to the thinning part of the neck ( $0.4 < x/l_c < 0.6$ at $\tilde {t} = 0.98$) so should not contribute to pinch-off. As seen in the literature for liquid threads and jets, the presence of surfactant does not alter the classic scaling laws of pinch-off (Craster, Matar & Papageorgiou Reference Craster, Matar and Papageorgiou2002; Wee et al. Reference Wee, Wagoner, Garg, Kamat and Basaran2021). The surfactant is convected away from the thread neck by the capillary-driven flow and the influence of Marangoni stresses on pinch-off is negligible (Kamat et al. Reference Kamat, Wagoner, Thete and Basaran2018). In this work where drop formation is studied, the flow from the continuous phase also pushes away the surfactant from the neck region, and the pinch-off is found to be unaffected by Marangoni stresses.
Antonopoulou et al. (Reference Antonopoulou, Harlen, Rump, Segers and Walkley2021) compared experimental results with numerical simulations of a weak ( $\beta _s = 0.1$, identical to this study) and a strong ( $\beta _s = 1$) surfactant during jet formation and break-up. It was found that the distribution of the weak surfactant at the interface was less uniform as opposed to the strong surfactant. It was also found that surfactant concentration gradients and thus Marangoni stresses decrease progressively with time during the formation process of jets, as seen in this work for drop formation.
4.3. Fully formed drops
In order to investigate surfactant transport in the whole drop volume, the vortical structures and surfactant concentrations of the formed drops as obtained by the CFD simulations are shown in figure 9 for surfactant-laden (c–h) cases after pinch-off (at the end of the channel,  $10\times d$). The vortical structures for surfactant-free drops are shown in figure 9(a,b) for comparison. The difference in the shape of the formed drop for top-(a,c,e,g) and side-(b,d,f,h) views is due to the channel dimensions, as explained in §§ 2 and 3. In the surfactant-free case, the vortical structures are completely symmetrical from the top view, while a strong vortex dipole is seen from the side view near the rear boundaries of the drop. In the surfactant-laden case at $\tilde {C} = 0.006$ (c,d), the vortical structures remain symmetrical from the top view and the vortex dipole moves towards the centre of the drop from the side view. The opposite is seen at higher surfactant concentrations ( $\tilde {C} = 0.06$, e,f and $\tilde {C} = 0.2$, g,h); a strong vortex dipole is forming in the centre of the top view, while no circulation is seen in the side view.

Figure 9. Top and side views of resulting drop for the surfactant-free case (a,b) and surfactant-laden case (c–h) accompanied by their vortical structures in the moving reference frame. All cases are for  $Q_d = 0.02$, $Q_c = 0.12$ ml min $^{-1}$. The panel from top to bottom corresponds to surfactant free (a,b), $\tilde {C} = 6\times 10^{-3}$ (c,d), $\tilde {C} = 6 \times 10^{-2}$ (e,f) and $\tilde {C} = 0.21$ (g,h). These surfactant-laden conditions correspond to the non-dimensional parameters: $Re = 2.35$, $Ca = 4.33\times 10^{-3}$, $Pe_{c} = Pe_{d} = 2.35\times 10^{5}$, $Bi = 8.41\times 10^{-5}$ and $k = 5.55\times 10^{3}$.
Both bulk and interfacial concentrations of the formed drops are plotted in figure 9 for  $\tilde {C} = 0.006$ (c,d), $\tilde {C} = 0.06$ (e,f) and $\tilde {C} = 0.21$ (g,h) in their dimensionless form as $\tilde {C}$ and $\tilde {\varGamma }$, respectively. At the very low concentration ( $\tilde {C} = 0.006$), most of the surfactant is at the interface (maximum value of $\tilde {\varGamma } = 0.5$) and there is almost no surfactant in the bulk (maximum value of $\tilde {C} = 1.7\times 10^{-4}$). For the higher concentration cases at $\tilde {C} = 0.06$ and $\tilde {C} = 0.21$, the surfactant concentration is high in the centre and low around the periphery of the drop in both the top and side views. The variations in $\tilde {\varGamma }$ are small, as can be seen from the range of the scale in the figure. Here it should be noted that adsorption is significantly faster than desorption, as also expected from the large $K_L = 1585.00$ m $^3$ mol $^{-1}$ value. As mentioned in § 3, $Bi = 8.41\times 10^{-5}$ is very small, which can be considered negligible when compared with $k = 5.55\times 10^{3}$, denoting negligible desorption as opposed to adsorption of surfactant at the interface. When compared with the concentrations during drop formation, it is obvious that the surfactant absorbs very fast after pinch-off. As seen in figure 7, the bulk concentration reaches the maximum value inside the drop throughout all stages ( $\tilde {C} = 0.06$) and the interface is not saturated ( $\tilde {\varGamma }<1$). This is not the case for fully formed drops, where the bulk concentration is lower than the maximum value. However, there are some differences in the interfacial concentration of the surfactant. From the top view, $\tilde {\varGamma }$ is seen to be higher at the rear of the drop. On the other hand, the interfacial concentration of the surfactant is larger near the rear edges of the drop from side view, especially in the $\tilde {C} = 0.21$ case. This is due to advection of surfactant at the back of the drop as it travels through the channel. The average concentrations in the bulk and at the interface just after pinch-off ( $t^+$), were calculated by integrating over the drop volume and surface area, respectively. These concentrations were compared with the initial values, $C_{ini}$ and $\varGamma _{ini}$. Table 2 summarises the calculated ratios for $Q_d=0.01$ and $Q_d=0.02$ ml min $^{-1}$. At $Q_d = 0.01$ ml min $^{-1}$ it was found that $55\,\%$ of the initial bulk concentration remains in the drop after pinch-off ( $C(t^+)/C_{ini}$) and $37\,\%$ ( $\varGamma (t^+)/\varGamma _{ini}$) from the initial interfacial concentration is at the interface, for all bulk concentrations ( $\tilde {C} = 0.006$, 0.06 and 0.21). These values change to $C(t^+)/C_{ini} = 60\,\%$ and $\varGamma (t^+)/\varGamma _{ini} = 30\,\%$ at $Q_d = 0.02$ ml min $^{-1}$. The higher interfacial concentration value in the former case is due to the longer formation time at $Q_d = 0.01$ ml min $^{-1}$ (see figure 3), allowing more time for the surfactant to travel to the interface.
Table 2. Concentrations in the formed drop after pinch-off.
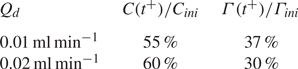
5. Conclusions
This paper presents a thorough study of the formation process of surfactant-laden drops inside a flow-focusing microchannel. High-speed imaging experiments and novel  $\mu$PIV experiments were used in conjunction with numerical CFD simulations, to obtain velocity and surfactant concentration profiles and understand the effects of surfactants on the different stages of the drop formation process. Surfactant concentrations below and above the CMC were considered. The numerical simulation utilised a three-dimensional multiphase solver which accounted for the transport of soluble surfactants in the bulk and at the interface and was adapted to the context of the hybrid front-tracking/level-set method.
A low-viscosity silicone oil (4.6 mPa s) was used as the continuous phase and a mixture of 48 % w/w water and 52 % w/w glycerol was the dispersed phase. A non-ionic surfactant (CMC $_{TX100} = 3.5$ mM) was added in the aqueous phase, at several concentrations below and above CMC. Numerical simulations for the drop formation in the microfluidic channel showed good agreement with experiments on drop size, formation time and vortical structures during drop formation.
Results revealed smaller dimensionless drop size ( $d/l_c$) and shorter formation times ( $\tilde {t}$) at higher surfactant concentrations ( $\tilde {C}$) in the drop bulk due to the lower interfacial tension forces. During the drop expansion and necking stages, velocities at the back of the forming drop were higher at higher $\tilde {C}$ values while the circulation patterns completely disappeared at concentrations above the CMC. At the pinch-off point, the velocities were higher at the rear of the drop as opposed to the front, while circulation patterns in the dispersed phase remaining attached to the inlet were weaker when surfactant was added compared with the cases with no surfactant. The effect of the dispersed phase flow rate was also investigated and it was found that an increase in flow rate resulted in less surfactant at the interface, due to shorter formation times.
The surfactant concentrations in the bulk and at the interface of the formed drop were also explored. Marangoni stresses at the drop interface were calculated for all stages of drop formation and found to progressively weaken with formation time. It was concluded that the high continuous phase flow rate plays an important role in sweeping surfactants away from the neck region and contributed towards pinch-off mainly. The Marangoni stresses did not seem to affect the neck pinch-off but contributed mainly to the velocity profile inside the drop, as opposed to what has been found in previous jet formation and break-up studies. Instead, the main contributor to the decreased formation time in the surfactant-laden cases was found to be the Marangoni stresses that develop during the expansion stage ( $Q_d = 0.02$ ml min $^{-1}$) and the necking stage ( $Q_d = 0.01$ ml min $^{-1}$). These stresses suppress circulation and increase the velocities inside the forming drop, which accelerate the formation and result in lower formation times overall (figure 5).
In future work, a new experimental set-up will be developed using micro-laser induced fluorescence techniques to trace both time and spatial evolutions of the surfactant concentration at the interface and compare with numerical results. Additionally, the numerical simulations will be expanded to model concentrations above CMC by accounting for micelle formation.
Funding
This work is supported by the Engineering and Physical Sciences Research Council, UK, through the EPSRC MEMPHIS (EP/K003976/1) and PREMIERE (EP/T000414/1) programme grants. M.K. would like to acknowledge the EPSRC doctoral training programme (EP/ R513143/1) for her studentship. O.K.M. acknowledges funding from PETRONAS and the Royal Academy of Engineering for a research chair in multiphase fluid dynamics. P.P. and L.K. acknowledge HPC facilities provided by the Research Computing Service (RCS) of Imperial College London for the computing time. D.J. and J.C. acknowledge support through HPC/AI computing time at the Institut du Developpement et des Ressources en Informatique Scientifique (IDRIS) of the Centre National de la Recherche Scientifique (CNRS), coordinated by GENCI (Grand Equipement National de Calcul Intensif) grant 2022 A0122B06721. The numerical simulations were performed with code BLUE (Shin et al. Reference Shin, Chergui and Juric2017, Reference Shin, Chergui, Juric, Kahouadji, Matar and Craster2018) and the visualisations were generated using ParaView.
Declaration of interests
The authors report no conflict of interest.
Appendix A. Inlet velocity profile
The cross-section of the three inlets is comprised two main areas: two semi-circles of radius  $R = w_{c}/2$ and a rectangular portion of dimensions $w_{c} \times (l_{c} - w_{c})$. The coordinates of centre point of the cross-section are defined as $x_{0}$ and $y_{0}$, and the distance in the $x$-axis from the edge of the rectangular portion to the centre line as $L = (l_{c} - w_{c})/2$. We begin with a general parabolic function consistent with a Poiseuille profile for the velocity at the rectangular portion ( $\,f_{1} (x,y)$)
 \begin{equation} f_{1}(x,y) = a_{1}(x-x_{0})^{2} + b_{1}(y-y_{0})^{2} + c_{1} \quad \text{if } (x-x_{0}) \in [-L,L], \end{equation}
where  $a_{1}$, $b_{1}$ and $c_{1}$ are constants. Applying a no-slip condition at the channel walls ( $\,f_{1}(x,\pm R) = 0$) and considering symmetry across the $x$-axis, we obtain $a_{1} = 0$ and $b_{1} = -c_{1}/R^{2}$:
 \begin{equation} f_{1}(x,y) =-\frac{c_{1}}{R^{2}} (y-y_{0})^{2} + c_{1}. \end{equation}
We define the parabolic profile for the circular sections in cylindrical coordinates ( $\,f_{2} (r,\theta )$)
 \begin{equation} f_{2}(r,\theta) = a_{2}(L + \sin\theta)^{2} + b_{2}(r\cos\theta)^{2} + c_{2} \quad \text{if } (x-x_{0}) \leqslant -L \ \text{or}\ (x-x_{0}) \geqslant L, \end{equation}
where  $x - x_{0} = L + \sin \theta$ and $y - y_{0} = r\cos \theta$. Applying a continuity condition at the limit between the rectangular and circular sections, ${\partial f_{1}}/{\partial y} \rvert _{x - x_{0} = L} = {\partial f_{2}}/{\partial r} \rvert _{\theta = 0, {\rm \pi}}$, as well as the no-slip condition at the walls, $f_{2}(\theta,R) = 0$, we obtain $b_{2} = b_{1} = -c_{1}/R^{2}$ and $c_{1} = c_{2}$
 \begin{equation} f_{2}(r,\theta) =-\frac{-c_{1}}{R^{2}}(\sin\theta)^{2} - \frac{c_{1}}{R^{2}} (r\cos\theta)^{2} + c_{1} \quad \text{if } (x-x_{0}) \leqslant -L \ \text{or}\ (x-x_{0}) \geqslant L. \end{equation}
Considering symmetry across the  $\theta$-axis
 \begin{equation} f_{2}(r) = \frac{c_{1}}{R^{2}} (r\cos\theta)^{2} + c_{1} \quad \text{if } (x-x_{0}) \leqslant -L \ \text{or}\ (x-x_{0}) \geqslant L. \end{equation}
These profiles must satisfy the exact entry flow rate of each branch. Therefore, we refer to the definition of flow rate  $Q$ in order to find constant $c_{1}$
 \begin{equation} \left.\begin{gathered} Q = \int_{-R}^{R} \int_{-L}^{L} f_{1}(x,y) \,{{\rm d}x}\,{{\rm d}y} + 2\int_{0}^{\rm \pi} \int_{0}^{R} f_{2}(r) r \,{\rm d} r\,{\rm d}\theta, \\ c_{1} =-\dfrac{Q}{\dfrac{8}{3}RL+\dfrac{\rm \pi}{2}R^{2}}. \end{gathered}\right\} \end{equation}
 Replacing the value of  $c_{1}$ on (A2) and the cartesian version of (A5), we obtain the inlet velocity profile for the cross-section considered in this study, illustrated in figure 10
 \begin{equation} \boldsymbol{u}(x,y)=\begin{cases} \mathcal{A}\left(\dfrac{(y-y_{0})^{2}}{R^{2}}-1\right) & \text{if } |x-x_{0}|\le L \\ \mathcal{A}\left(\dfrac{(x - x_{0}-L)^{2}}{R^{2}} + \dfrac{(y - y_{0})^{2}}{R^{2}} -1\right) & \text{otherwise}, \end{cases} \end{equation}
where  $\mathcal {A} = {-Q}/{(\frac {8}{3}RL + ({{\rm \pi} }/{2})R^{2})}$.

Figure 10. Normalised inlet velocity profile. The contours are equally spaced with steps of 0.05 and  $(x_0 ,y_0 ) = (0,0)$.


 Open access