


Introduction
Early life programing has been intensively studied for prediction of adult morbidity and mortality, as well as life expectancy in various populations. Reference Barker1,Reference Gluckman, Hanson, Cooper and Thornburg2 One important measure of this is birth weight (BW) adjusted for gestational age, which reflects fetal growth patterns. Reference Barker1 BW, as well as birth length, is influenced not only by genetics but also by environmental factors, for example, maternal diet and lifestyle during pregnancy. Some historical examples have been used to link a higher mean BW, as well as adult tallness, with better health conditions and increased longevity on the population level, for example in Åland, a Swedish-speaking archipelago province of western Finland. Reference Fellman and Eriksson3–Reference Sandboge, Fellman, Nilsson, Eriksson, Osmond and Eriksson5
Halland is a county located in south-west Sweden with 325,000 inhabitants. For more than a century it has been known that this population enjoys the highest mean life expectancy in Sweden. In 2015–2019, period life expectancy was estimated to be 84.95 years in Halland versus 84.24 years as a national mean for women, and 81.87 years versus 80.75 years for men. 6 These values were also higher than the mean life expectancy for the nearby county of Scania (84.34 and 80.82 years for women and men, respectively), which is considered for comparisons. Furthermore, the cardiovascular mortality rate in Halland is significantly lower than the rest of Sweden and cannot be explained only by higher socioeconomic status (SES) as a marker of better material conditions. Reference Baigi, Fridlund, Marklund and Odén7 In 2019, death rates in Halland from diseases of the circulatory system were 201.2 and 284.3 per 100,000 for women and men, respectively, compared to the national averages of 230.1 and 328.1 deaths per 100,000, making Halland the county with the lowest rates for men, and second lowest rates for women after Stockholm. 8 The population in Halland is also amongst the tallest in Sweden. The regions with the highest average height for men and women aged 16+ years in 2018–2019, equal to 172.9 cm, were the West Sweden region, comprising the counties of Halland and Västra Götaland, and the North-Central Sweden region. 9 Average height in the South Sweden region, comprising the counties of Scania and Blekinge, was 172.8 cm, while the national average was 172.5 cm.
Different explanations for the increased mean longevity of the Halland population have been suggested, including access to nutritious food, low infant mortality and traditionally a lower grade of urbanization. The long life expectancy seen in Halland today can be traced back to the early 20th century. The starting point for this development seems to have been a lower infant mortality in Halland compared with Sweden as a nation during the period 1880–1890. The basis for this might have been a greater increase of food production during the whole 19th century as well as other favorable socioeconomic characteristics of Halland compared with the rest of the country, according to Baigi et al. Reference Baigi, Högstedt, Odén, Isacsson and Herrström10 A lower risk of deaths from infectious disease could also have contributed. Reference Baigi, Högstedt, Isacsson, Odèn and Herrström11 Such higher levels of nutrition and lower disease burden could have positively influenced size at birth and growth patterns during childhood of Halland’s population, leading to (programming of) better health throughout the life course. On the other hand, Scania is a more densely populated region with a dominating urban structure including a larger proportion of working class and factory workers. The closeness to nearby Denmark has also influenced lifestyle habits with, for example, a higher rate of smoking than in other regions.
To summarize, similar to the population of Åland, the Halland population also enjoys the highest mean life expectancy in their respective countries. This could therefore be studied to increase knowledge about the historical contribution of early life determinants of longevity in a life course perspective. A corresponding historical population-based study is the Uppsala Birth Cohort, with obstetrical data from deliveries at Uppsala Academic Hospital in mid-Sweden during 1915–1929, which has reported associations between early life factors and adult disease risk. Reference Leon, Lithell and Vågerö12,Reference Hyppönen, Leon, Kenward and Lithell13 Another historical population is the one in Scania that lived in the city of Landskrona or in the neighboring countryside in southern Sweden, with rich data on early life exposures. Reference Bengtsson, Dribe, Quaranta and Svensson14–16
The aim of this observational study is: (a) to describe the mean BW and mean birth length among children born in Halland in the 1930s, as well as to (b) compare the mean birth measurements for children born in Halland to children born during a similar time period in Scania, and to (c) compare the mean BW in recent decades in Halland to the rest of Sweden, based on national register data. Although we lack follow-up data for children born in Halland, such data is available for children born in Scania during the same period. The final aim of this work is therefore to (d) analyze the associations that exist between size at birth and all-cause mortality at different ages in a historical cohort.
Methods
Data for Halland
Data concerning sex, BW, birth length, gestational age (based on self-reported last menstrual period), the parity and marital status of the mother, and maternal age at delivery, were collected from medical records during delivery at Halland’s Central Hospital in Halmstad from the period 1936–1939. These data were manually collected from archival records for 995 births from these years (by Å Pontén). Gestational age was calculated as the number of days between the reported last menstrual period and delivery. Inclusion criteria to define the study sample from the full set of all births, were live births of singletons having gestational age between 37 + 0 and 42 + 6 (weeks + day), corresponding to days 259–300, by stated last menstrual period. Individuals with no or improbable stated last menses period were excluded. According to these criteria 42 births were excluded from 1936, 71 from 1937, and 47 from 1938. Data concerning maternal body mass index (BMI) or smoking were not available. This historical birth cohort is referred to as the Halmstad Birth Study (HBS) throughout the paper.
Data for Scania
For Scania we used data from the Scanian Economic Demographic Database (SEDD), Reference Bengtsson, Dribe, Quaranta and Svensson14,Reference Dribe and Quaranta15 which was constructed using historical parish and civil registers and which contains longitudinal demographic and socioeconomic data for the city of Landskrona and five closely located rural parishes (at a distance 100 km from Halmstad). Individuals can be followed from birth or in-migration until death or out-migration between 1905 and 1968. The SEDD has been linked to the Swedish Death Index (SDI – The Federation of Swedish Genealogical Societies) which includes most deaths in Sweden between 1860 and 2016. 16 The linkage was done using full linkage on date of birth and probabilistic linkage on names. Individuals who out-migrated from SEDD areas can therefore also be followed until their death, if it occurred up to 2016, while those with no observed death date can be assumed to be still alive at the end of such year.
Birth records from the hospitals of Landskrona, Lund, and Helsingborg were digitized for children born between 1935 and 1945, whose mothers resided in SEDD areas at the time of their birth. The data was digitized manually (by research assistants under the guidance of L Quaranta). Out of a total of 4849 children born between 1935 and 1945, in all 4493 were born in the hospitals of Landskrona, Lund, and Helsingborg (4009 of these records were found and digitized), 111 were born in other hospitals or birth institutions, and the remaining 245 were either born at home or their exact place of delivery was unknown. This historical birth cohort is referred to as the Scanian Birth Study (SBS). Reference Quaranta17 throughout the paper.
The same definition of gestational age and of the criteria for inclusion in HBS were also used for the SBS. Out of the total of 4009 children whose records were digitized, 97 were excluded because they were multiple births, and 536 were excluded because their records stated no or improbable last menses period, or because the gestational age was outside the 259–300 d range. An additional 12 children were excluded because they had missing BW or birth length. The final SBS study sample thus consisted of 3364 children. Of the total sample, 669 individuals died before December 31st, 2016 (i.e., before their 70th birthday).
National register data
The Swedish national Medical Birth Register (MBR) was introduced in 1973, and records information on pregnancies, deliveries, and new-borns on a national basis. 18 Maternal height, weight, and smoking were registered from 1983 onwards. From the MBR we received data on mean BWs from new-borns in Halland and Scania compared to other Swedish counties during the period 1973–2013.
Statistical analyses of birth characteristics
All statistical analyses for HBS and SBS were performed using the statistical program STATA.
We first present descriptive characteristics of the new-born (BW, percentage of low birth weight, percentage small for gestational age, birth length, ponderal index, gestational age, proportion of males) and maternal characteristics (proportion unmarried, proportion primiparous mothers, age at delivery) in both cohorts HBS and SBS. Ponderal index (PI) was calculated as weight (kg)/length3 (m), as an indicator of fetal growth status. Low birth weight (LBW) was defined as weight below 2500 g. Infants were defined as small for gestational age (SGA) when weighing less than two standard deviations below the expected BW for gestational age and gender according to the Swedish intrauterine growth curves. Reference Marsál, Larsen, Lilja, Selbing and Sultan19 The standard deviation was calculated from the distribution, from the pooled HBS and SBS cohorts, of weight deviations from expected weights. For each cohort we present the results separately and for the total combined population, as well as for boys and girls, respectively.
Next, we analyzed factors associated with BW, birth length, and PI using three separate multivariable linear regression models. We also analyzed the factors associated with being LBW, or SGA using logistic regression analyses. The five models were estimated based on the pooled HBS and SBS datasets to identify differences between the two samples.
Finally, we used data from the MBR (1973–2013). Also in this case infants were defined as SGA, or large for gestational age (LGA), when weighing more than two standard deviations (z-scores) below or above, respectively, the expected BW for gestational age and gender according to the Swedish intrauterine growth curve. Reference Marsál, Larsen, Lilja, Selbing and Sultan19 Multivariable linear regression analyses were made to investigate if the mean infant BW z-score differed between Halland and the other Swedish counties in recent decades (2004–2013).
Mortality analyses
For SBS and the follow up-data on mortality from SEDD and a Swedish historical death register (SDI), Cox proportional hazard models (Table 5, Models (M) 1–24) were used to measure the influence of BW, birth length and being SGA on the hazard of death. Separate estimations were made for death in ages 0–14, 15–49, and 50–70 years.
BW was first considered as continuous (M1, M9, M17). Next, it was considered as categorical (M2, M10, M18), based on the mean and standard deviation (>2 SD below the mean; 1 to 2 SD below the mean; 1 SD below the mean to 1 SD above the mean; 1 to 2 SD above the mean, and >2 SD above the mean) rounded to the nearest 100 g, which corresponded to the thresholds <2500 g; 2500–2999 g; 3000–3999 g; 4000–4499 g; and ≥4500 g. BW by gestational age was also taken into account, comparing individuals who were SGA to those that were not (M3, M11, M19). Birth length was also considered first as continuous (M4, M12, M20) and next as categorical (M5, M13, M21) variable, also in this case based on mean and standard deviation, rounded to 0.5 cm for birth length, which corresponded to <46.5 cm; 46.5–48.9 cm; 49–52.9 cm; 53–54.9 cm; and ≥55 cm. In addition to estimating models to measure the separate effects of BW and birth length on the likelihood of death, we also evaluated their joint association within the same model, first considering both as continuous (M6, M14, and M22), next both as categorical (M7, M15, and M23) and lastly considering weight by gestational age and birth length as categorical (M8, M16, M24).
All models control for gestational age, individual’s birth year, sex, first-born status, and father’s SES at the time of the individual’s birth. Occupational notations in SEDD have been coded into Historical International Standard Classification of Occupations (HISCO). Reference van Leeuwen, Maas and Miles20 and subsequently classified into the Historical International Social Class Scheme (HISCLASS) categories. Reference van Leeuwen and Maas21 Seven occupational classes were created: Higher white-collar workers (HISCLASS 1–2); Lower white-collar workers (HISCLASS 3–5); Medium-skilled workers (HISCLASS 6–7); Lower-skilled workers (HISCLASS 9–10); Unskilled workers (HISCLASS 11–12); Farmers (HISCLASS 8); and Occupation unknown. No evidence of violations to the proportional hazards assumptions was found for the main explanatory variables (BW, birth length and weight by gestational age) in tests based on Schoenfeld residuals.
Results
Birth measurements in the Halmstad Birth Study and the Scanian Birth Study
Characteristics of the HBS and the SBS cohorts are described in Table 1. Mean BW was 3526 g in HBS, which was nearly identical to the mean BW in SBS, 3523 g. Average birth length was higher in HBS (51.5 cm) than in SBS (50.9 cm). Average PI was lower in HSB (25.7 kg/m3) than in SBS (26.7 kg/m3), which reflects the fact that children born in Halmstad were longer but weighed nearly the same as those born in Landskrona and surroundings. In fact, relative differences in average birth length between the two areas were wider than relative differences in average BW.
Table 1. Population characteristics of 995 new-borns 1936–1938 at the Halmstad Central Hospital (Halland), and 3364 new-borns 1935–1945 at Landskrona, Lund, and Helsingborg Hospitals (Skåne)

LBW, low birth weight; SGA, small for gestational age, defined as a weight less than two standard deviations below the expected birth weight for gestational age and gender according to the Swedish intrauterine growth curves. Means (SD) and proportions (%).
The proportion of LBW infants was lower in HSB (1.1%) than in SBS (1.6%). The proportion SGA was also lower in HSB (1.8%) than in SBS (3.0%). Some additional differences can be observed between the two areas in terms of gestational age and maternal background characteristics.
Table 2 shows the mean BW and standard deviation stratified by gestational week in the HBS and the SBS, respectively. As compared to new-borns in SBS, new-borns in HBS were heavier when born in weeks 38–41, but lighter in weeks 37 and 42. Boys were heavier than girls from gestational week 38 onwards in the HBS, and during all weeks in the SBS.
Table 2. Mean birth weight (gram) and standard deviation (SD) by gestational week (w), for HBS and SBS

Results of multivariable linear regression models of predictors of BW, birth length and PI and of logistic regressions of predictors of LBW and SGA in the HBS and SBS are reported in Table 3, which highlight differences in size at birth between the two areas. For BWs, no base level differences in average values were seen between Halmstad (HBS) and Landskrona and surroundings (SBS) in Table 1, but when controlling for maternal and new-born characteristics in Table 3, children are heavier in HBS than in SBS (p < 0.1). HSB children were on average longer at birth than SBS children (p < 0.001), and also in this case wider differences were seen when controlling for background characteristics. Children in HSB had lower PI than those in SBS, since relative differences in average birth length between the two areas were wider than relative differences in average BW. The results of the two logistic regressions showed that HBS children were at lower risk of being LBW than SBS children (p < 0.1) and at lower risk of being SGA (p < 0.05).
Table 3. Linear regressions with birth weight, birth length, and ponderal index, and logistic regressions with low birth weight and small for gestational age as the dependent variables in the HBS and the SBS

Low birth weight defined as <2500 g. Small for gestational age defined as a weight less than two standard deviations below the expected birth weight for gestational age and gender according to the Swedish intrauterine growth curves.
Swedish national Medical Birth Register data
The two historical cohorts can be compared to modern data from MBR. Mean BW in the historical HSB (3526 g) was very close to the corresponding mean BW in MBR for 1973–2013 (3528 g), but somewhat lower than during the more recent part of the period, 2004–2013 (3546 g). Correspondingly, the mean BW in the historical SBS (3523 g) was lower than mean BW in Scania during 2004–2013 (3535 g), Table 4.
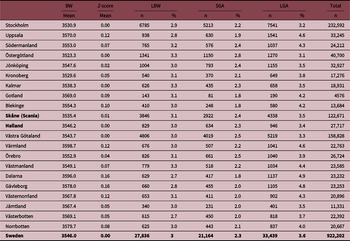
Table 4. All singletons from the Swedish Medical Birth Register (SMBR) in 2004–2013

Mean birth weight (grams), mean birth weight z-score (0 for national mean), rate of low birth weight (LBW) <2500 g, rate of small for gestational age (SGA), and rate of large for gestational age (LGA), by county for the period 2004–2013.
In contemporary analysis based on data from the MBR describing singletons born 2004–2013, the mean BW in Halland (3528 g; z-score 0) did not differ from the national mean (z-score 0), but some other counties had higher mean BW and z-scores. For the most recent period 2004–2013, such difference existed between Halland (3546 g, z-score 0) and the county of Dalarna (3596 g, z-score 0.16) as well as the county of Gävleborg (3578 g, z-core 0.16), respectively, the two counties with the highest mean birthweight at present (Table 4).
The proportion of LBW < 2500 g, SGA and LGA babies was 3.0%, 2.3%, and 3.4% in Halland compared to Dalarna (2.7%, 1.8%, and 4.9%), Gävleborg (2.8%, 2.0%, and 4.8%), and Scania (3.1%, 2.4%, and 3.5%), respectively (Table 4). For data on BW and SGA comparing Halland and the rest of Sweden for the whole period 1973–2013, see Table S1.
Variables explaining prevalence rates in multiple regression analyses (odds ratios, OR) were for risk of LBW: maternal age OR 1.01 (95% CI: 1.00–1.02; p < 0.05), smoking 1.67 (95% CI: 1.62–1.71; p < 0.001), and BMI 0.99 (95% CI: 0.982–0.995; p < 0.005); for risk of SGA: maternal age 0.97 (0.95–0.98; p < 0.001), smoking 1.82 (1.77–1.87; p < 0.001), and BMI 0.98 (0.978–0.983; p < 0.001), but also birth in Gävleborg county 0.83 (0.76–0.91). Finally, for risk of LGA the estimates were for: (more recent) year of birth 0.99 (0.989–0.998; p < 0.001), age 1.18 (1.17–1.20), smoking 0.62 (0.59–0.64; p < 0.001), BMI 1.11 (1.107–1.111; p < 0.001), and birth in Gävleborg county 1.26 (1.18–1.33; p < 0.001).
Mortality follow-up in SBS
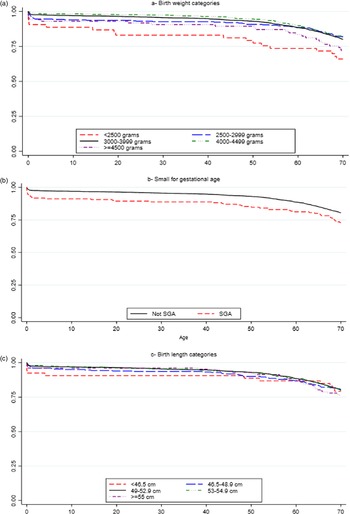
BW used as a continuous variable in the SBS cohort was negatively associated with the hazard of death in ages 0–15, Table 5 (Model: M1). When considering BW as a categorical variable, (M2) and Fig. 1a, it is seen that such effect is driven by LBW individuals (<2500 g) and for those weighing 2500–2999 g, both of whom are more likely to die at ages 0–14 than individuals with average birthweight. The increased hazard of death of LBW individuals persists also in the age range 15–49 years (M10), although with a lower magnitude and statistical significance. It should be noted, however, that LBW individuals only constitute 1.4% of the total study SBS sample, so this result should be considered with some caution. No statistically significant effects of birthweight are found on the likelihood of death in ages 50–70 years (M17, M18). Individuals born SGA (Fig. 1b) have increased hazard of death at ages 0–14 (M3). Given that all models controlled for SES at birth, the results are not confounded by the influence of family social background during pregnancy.

Fig. 1. Survival curves for ages 0–70 years by birth weight, weight for gestational age, and birth length categories, SBS from SEDD.
Table 5. Cox models showing the influence of birth weight and birth length on the likelihood of dying at different ages, SBS

All models were controlled for gestational age, birth year, gender, first-born, and SES at birth. Percentage of the full sample in each birth weight category: <2500 g: 1.4%; 2500–2999 g: 9.1%; 3000–3999 g: 73.1%; 4000–4499 g: 14.0%; ≥4500 g: 2.4%. Percentage small for gestational age: 2.7%. Percentage in each birth length category: <46.5 cm: 1.5%; 46.5–48.9 cm: 8.2%; 49–52.9 cm: 70.9%; 53–54.9 cm: 15.7%; ≥55 cm: 3.8%. These percentages are based on person years.
HR, hazard ratio.
Birth length used as a continuous variable was also negatively associated with the likelihood of death in age range 0–14 years, Table 5 (M4). When considering birth length as a categorical variable, Table 5 (M5) and Fig. 1c, such effects are primarily driven by individuals with birth length <46.5 and 46.5–48.9 cm, both of whom have higher hazards of death at ages 0–14 than individuals born with average birth length. There were no significant effects of birth length on the hazard of death in ages 15–49 and 50–70 years (M12, M13, M20, M21). The models controlled for SES at birth, indicating no confounding.
The effects of BW on the hazard of death in ages 0–14 and ages 15–49 remain consistent when controlling for birth length in the same model (M7, M15). When controlling for birth length, the effect on the hazard of death of being SGA remains consistent in ages 0–14 (M8). When controlling for BW or being SGA, the effects of birth length on the hazard of death are no longer significant (M7, M8).
Discussion
Life expectancy in Sweden is among the highest in the world, and the county of Halland has the longest life expectancy for men and women in Sweden of today. 6 The increased mean longevity pattern in Halland compared to the rest of Sweden is unexplained, but early life programing could play a role according to the Developmental Origins of Health and Disease hypothesis. Reference Eriksson22 Cardiovascular diseases constitute the most common cause of death in Sweden since the 1920s and a higher risk of cardiovascular diseases is associated with a lower social economic class. Mortality from cardiovascular disease has been reported to be lower in Halland compared to the rest of Sweden, but this is only partly explained by socioeconomic factors. Reference Baigi, Fridlund, Marklund and Odén7,Reference Baigi, Högstedt, Odén, Isacsson and Herrström10,Reference Baigi, Högstedt, Isacsson, Odèn and Herrström11 This background provides the rational to further study patterns of birth characteristics in Halland compared to a neighboring county (Scania) and the rest of Sweden, both in historical cohorts and based on modern health statistics from national registers.
In this work we compared historical birth characteristics of children born at Halland’s Central Hospital in Halmstad during 1936–1939 (HBS) to those of children whose mothers resided in Landskrona and five surrounding rural parishes, who were born in the hospitals of Landskrona, Lund or Helsingborg during the period 1935–1945 (SBS), derived from a larger database, SEDD. Reference Bengtsson, Dribe, Quaranta and Svensson14,Reference Dribe and Quaranta15 For SBS we were able to conduct a mortality follow-up to study the influence of birth measurements on all-cause mortality across the life course until 70 years of age.
We observed differences in size at birth between new borns in HBS and SBS, mainly that children in HBS were born larger than children in SBS. Mean BW was 3526 g for HBS, and although there was no difference to average birthweight in SBS (3523 g), after multiple regression analyses with adjustments for birth year, gender, gestational age, and mother’s marital status, primiparity and age, a moderately significant higher birthweight was observed for HBS. The proportions of LBW (< 2500 g) and SGA new-born were lower in HBS (1.1% and 1.8%, respectively) than in SBS (1.6% and 3.0%, respectively). Average birth length was higher in HBS (51.5 cm) than in SBS (50.9 cm). Since relative differences in birth length between HBS and SBS were larger than relative differences in BW, PI was lower in HBS (25.7 kg/m3) than in SBS (26.7 kg/m3). The differences in LBW, SGA, birth length and PI remained after adjustment for maternal and new-born characteristics in separate multiple regressions analyses, with moderate statistical significance for LBW and high statistical significance for SGA, birth length, and PI.
Comparisons can also be made with other historical cohorts and with modern data. Average birthweight in both HBS and SBS (for full-term births) were somewhat higher than in Åland, Finland, in 1937–1944 (3499 g) and Uppsala, Sweden, in 1915–1929 (3429 g), but in these cohorts also preterm births were included. Reference Leon, Lithell and Vågerö12
Average birth length was also higher in HBS than in Uppsala (50.7 cm). Furthermore, the mean historical BW for new-born in Halland in the late 1930s is close to the mean BW reported from Halland more recently during 1973–2013, and the same is true for new-born in Scania.
When BWs from Åland, described as Finland’s healthiest region, were compared with BWs from Helsinki in the 1930s, mean BWs from Åland was shown to be higher. Reference Sandboge, Fellman, Nilsson, Eriksson, Osmond and Eriksson5 It has been suggested that a high intake of omega-3 fatty acid, from dietary fish consumption, is associated with a longer gestational time period and thereby a somewhat higher BW. Reference Larqué, Gil-Sánchez, Prieto-Sánchez and Kolezko23,Reference Makrides, Duley and Olsen24 Since Åland is an archipelago located by the sea, its population can be assumed to have had a high consumption of fish during historical times and even at present, also involving the diet of pregnant women. Therefore an accurate registration of gestational age for comparison between cohorts is of great importance, even if data on dietary intake is lacking. Historically, body height was greater in Sweden than in Finland, but a secular trend has diminished these differences, Reference Silventoinen, Lahelma, Lundberg and Rahkonen25 with implications for adult health.
In several studies, a catch-up growth during childhood was correlated to higher risk for cardiovascular disease and type 2 diabetes, which suggests that it is the SGA new-born that really are at increased risk. However, data on post-natal growth patterns was not accessible for comparisons, neither between the historical cohorts (HBS, SBS) nor between the modern county-based (Halland, Scania, etc.) register data and the rest of Sweden.
The Helsinki Birth Cohort Study and the Uppsala Birth Cohort Sweden, have reported a clear association between small birth size and higher incidence and mortality from coronary heart disease as well as higher risk of stroke, hypertension and type 2 diabetes. Reference Leon, Lithell and Vågerö12,Reference Hyppönen, Leon, Kenward and Lithell13,Reference Eriksson, Forsén, Tuomiletho, Winter, Osmond and Barker26,Reference Barker, Osmond, Kajantie and Eriksson27 Unfortunately, we lack corresponding follow-up data from the HBS cohort, although we were able to follow new-born in SBS until age 70 years using data from the SEDD. Reference Bengtsson, Dribe, Quaranta and Svensson14,Reference Dribe and Quaranta15,Reference Quaranta17 and the SDI. 16 We showed that LBW, SGA, and shorter birth length were associated with an increased hazard of death, particularly during childhood and early adolescence before 15 years. The effects of LBW or SGA remained consistent when controlling for birth length in the same model, but when controlling for BW the effect of birth length was no longer statistically significant. Such results were not confounded by SES at birth. These findings indicate that in SBS size at birth affected survival. The larger size at birth of children in Halland, which we found evidence of in the historical cohort (HBS) through greater birth length, lower proportion of SGA, slightly higher BW and slightly lower proportion of LBW, may therefore partly explain longer life expectancy and lower mortality from cardiovascular disease in people from Halland as historical birth cohort characteristics, even if we cannot test this empirically due to lack of follow up data for HBS.
Three mechanisms correlating small birth size with later cardiovascular disease have been suggested. One hypothesis postulates a vulnerability to poor socioeconomic standard later in life, when born small. Another hypothesis describes a heightened response to mental stress, increased vulnerability to the effects of lack of exercise, and changes in neuroendocrine pathways in smaller new-born. Men with normal birth size seem to be more resilient to suboptimal environmental factors later in life. If, as shown, the BWs and birth lengths in HBS were higher than in Uppsala and Scania, this partly could explain (at least in theory) the lower mortality from cardiovascular disease described in the area, which could account for the higher mean life expectancy seen in a national and historical perspective. However, more recent data from MBR does not provide evidence for a higher BW in the Halland county as a total area (not only based on births at the Halmstad hospital) or Scania compared to the rest of Sweden. This could be due to changing trends in relative BW between counties due to a change of the population composition (i.e., migrants), maternal lifestyle factors or reproductive patterns, or even other unknown factors. In addition, the introduction of preventive maternal health care on a national scale after the Second World War could contribute to more equal patterns of birth characteristics in birth cohorts from that time, and still today, compared to earlier birth cohorts.
Limitations of the study
This observational historical study has some important limitations. Only individuals born at the hospital in Halmstad during 1936–1938 (HBS), and individuals born in the hospitals in Landskrona, Lund and Helsingborg during 1935–1945, whose mothers resided in Landskrona and five surrounding rural parishes (SBS) with a complete medical register data-set, were included. Important data from variables influencing BW and birth length, such as maternal height, maternal BMI, diabetes, preeclampsia, weight gain during pregnancy, and smoking, were lacking. Since gestational age is significantly associated with BW this is an important factor to register when comparing birthweights. In the HBS and SBS, gestational age was calculated based on last menstrual period as recorded by midwifes in the medical records, but this could be inaccurate in some women due to biased reporting or recall bias.
A survival bias might also be present, since only live births were included and adverse conditions during pregnancy is associated with a higher risk of intrauterine fetal deaths. During the 20th century the maternity clinics in Sweden were rapidly growing, with a strong trend towards delivery in hospitals among women. Reference Vallgårda28 In 1930 the proportion of hospital births in Halland was only 26% but in 1946 a total of 90% of all deliveries were made in one of the three hospitals (Halmstad, Varberg, Falkenberg). Reference Bjurling29 The percentage of hospital births among children with mothers residing in Landskrona and the five rural parishes included in SEDD, was high during the study period, and increased from 87% in 1936 to 99% in 1946, with deliveries taking place primarily in the hospital of Landskrona, but also some in Lund and Helsingborg. When births from HBS and SBS took place at hospitals, a selection bias might be present in relation to home deliveries. The Halmstad and Landskrona maternity wards had only 14 and 16 beds, respectively. The mean length of hospital stay for a woman following normal delivery was 10 d, and given the increasing trend of hospital versus home deliveries, delivery wards were described as being highly overcrowded.
In addition to different care received at delivery, smoking patterns are of great importance for pregnancy outcomes and could differ between regions. Reference Källén30 Finally, conditions during childhood may also have changed and some indications exist of detrimental trends for increasing obesity and insulin resistance in children of Halland today, as followed longitudinally.
Conclusion
The population of Halland has higher life expectancy and lower rates of cardiovascular disease mortality than the rest of Sweden and in this study we considered size at birth as possible determinant of such patterns. In conclusion, we report historical mean BW and birth length in HBS that was higher than in SBS and in other comparative areas, and a lower proportion of LBW and SGA babies in HBS than in SBS. However, there is no indication that the mean BW is higher in Halland today, in fact it is lower than in some other counties in mid-Sweden. This could reflect a more favorable historical situation in the past (birth cohorts) that has now changed for a more equal pattern. We show that the increased longevity of Halland may be a result of more favorable early life conditions in the past, observed here through greater size at birth relative to other historical cohorts, but given that such differences do not exist for more contemporary cohorts, life expectancy in Halland could be expected to gradually become more similar to the rest of Sweden.
Supplementary materials
For supplementary material for this article, please visit https://doi.org/10.1017/S2040174421000684
Acknowledgements
We thank Linda Johnson, MD, PhD, for valuable comments on the manuscript. We are also grateful to Claes Ignell, MD, PhD, for assistance in calculating small for gestational age.
Financial support
This study was supported by the Research Council of Sweden with a grant to PMN. LQ is grateful for research funding from FORTE (2017-00866) and from the Swedish Foundation for the Humanities and Social Sciences (RJ – research program ‘Landskrona Population Study’), and for funding received for the digitization of Scanian hospital birth records from the Crafoord Foundation and the Ebbe Kock Foundation.
Conflict of interest
None.
Ethical standards
The Scanian Birth Study (SBS), as part of the Scanian Economic Demographic Database (SEDD), was approved by the Swedish Regional Ethics Committee in Lund (2010/2011, ‘Ekonomisk demografi i ett flergenerationsperspektiv’). The Halmstad Birth Study (HBS), with no follow-up, was a historical cohort for which no ethical permission was needed.


 Open access