


Introduction
COVID-19 infection is caused by the SARS-CoV-2 virus. Various testing methods are used to detect SARS-CoV-2 viral RNA, viral antigen, and antibodies formed in response to COVID-19 infection or vaccination [8-10]. COVID-19 infection is identified by highly sensitive PCR tests that detect the presence of viral RNA in upper respiratory (e.g., nasal, nasopharyngeal, oral) and saliva samples. Antigen test also identifies current infection by using antibodies specific to SARS-CoV-2 viral proteins including spike and nucleocapsid proteins. Antibody tests measure immune-reactive antibodies that develop following more recent (IgM isotype) or past (IgG isotype) infection.
SARS-CoV-2 RNA has been detected by RT-PCR in up to 76% of blood or serum samples collected from patients with COVID-19 infection [Reference Andersson, Arancibia-Carcamo and Auckland2]. SARS-CoV-2 has not been detected in blood using antigen-based tests according to the CDC Interim Guidance for Antigen Testing for SARS-CoV-2 [9]. To the best of our knowledge, SARS-CoV-2 viral proteins have not been reported in blood samples of COVID-19 patients by three testing methods.
In addition to primary infection in the respiratory tract, SARS-CoV-2 can cause damage in multiple organs including the heart. The initial hypothesis presumed that virus-mediated inflammation was the primary cause of cardiac dysfunctions [Reference Basso, Leone and Rizzo4,Reference Frangogiannis15]. Recent reports provided evidence for the presence of SARS-CoV-2 in the myocardium of COVID-19 patients [Reference Tavazzi, Pellegrini and Maurelli27] and in heart tissues of COVID-19 autopsy cases [Reference Bailey, Dmytrenko and Greenberg3,Reference Lindner, Fitzek and Brauninger18]. Direct viral entry into cardiac myocytes is the primary mechanism of myocardial infection [Reference Bailey, Dmytrenko and Greenberg3]. This is not surprising since the SARS-CoV-2 binding receptor, angiotensin-converting enzyme 2 (ACE2), was initially discovered in [Reference Donoghue, Hsieh and Baronas13,Reference Tipnis, Hooper, Hyde, Karran, Christie and Turner28] and highly expressed by the heart [Reference Chen, Li, Chen, Feng and Xiong11,Reference Nicin, Abplanalp and Mellentin19]. However, it is unclear how the virus passes from the upper respiratory tract to the myocardium; one likely explanation is via blood circulation.
SARS-CoV-2 contains two viroporins, Orf3a and E, both of which can form non-voltage-gated cation channels [Reference Pervushin, Tan and Parthasarathy22,Reference Schwarz, Wang, Yu, Sun and Schwarz25,Reference Singh Tomar and Arkin26]. We report here that the protein motifs that determine the combined channel activity of Orf3a and E are conserved and specific to SARS-CoV-1 and SARS-CoV-2. Combining a fluorescence ion assay with the channel modulators, we developed a test that can detect channel activity of Orf3a/E in blood samples (whole blood, plasma, serum) of COVID-19 patients in a high-throughput manner.
Methods
COVID-19 Patient Blood Samples
Use of blood samples from COVID-19 patients was approved by the West Virginia University Institutional Review Board. Research was discussed with each patient, and if the patient consented to the research project, whole blood was drawn by standard venipuncture into one tube, containing EDTA for anticoagulation. Plasma/sera samples were stored in tube without EDTA. A total of 42 samples were collected: 28 whole blood samples and 14 plasma/serum samples.
Fluorescence K + Assay and Orf3a/E Channel Activity Detection
A fluorescence-based potassium ion channel assay utilizes the ability of thallium (Tl+) to permeate K+ channels [Reference Weaver, Harden, Dworetzky, Robertson and Knox30]. Once the K+ channels are open, Tl+ in the extracellular solution flows down its concentration gradient into the cells via K+ channels. Inside the cells, Tl+ binds to and activates a fluorogenic indicator dye preloaded into the cells, resulting in a dramatic increase in fluorescence signal. This technique allows rapid determination of K+ channel activity in a high-throughput manner [Reference Raphemot, Kadakia and Olsen24]. We used a commercial kit (FluxOR Potassium ion channel assay, cat#: F10016, Thermo Fisher Scientific) according to the manufacturer’s instructions to study fluorescence detection of Orf3a/E channel activity.
Samples of 10 μL each were added to a 96-well plate. Each sample was duplicated in two separate wells: the first replicate contained only assay solution to establish the baseline signal and the second contained both assay solution and Orf3a/E channel blockers. Fluorescence of each sample was measured 3–6 times using a BioTek Synergy H4 Hybrid Microplate Reader.
Ion Channel Modulators
Emodin, gliclazide, and 4-aminopyridine (4-AP) were purchased from Sigma. Stock solution (50 mm) was prepared in DMSO. Approximately 0.5 mm emodin and gliclazide were used in ∼100 uL solution. DMSO at ∼1–2% of test solution had no effects on test results.
Lentivirus Containing Orf3a and E
Lentivirus containing SARS-CoV-2 Orf3a and lentivirus containing E were obtained from Addgene donated by Nevan Krogen lab: pLVX-EF1alpha-SARS-CoV-2-orf3a-2xStrep-IRES-Puro was a gift from Nevan Krogan (viral prep # 141383-LV; http://n2t.net/addgene:141383-LV ; RRID:Addgene_141383) [Reference Gordon, Jang and Bouhaddou17]. pLVX-EF1alpha-SARS-CoV-2-E-2xStrep-IRES-Puro was a gift from Nevan Krogan (viral prep # 141385-LV; http://n2t.net/addgene:141385-LV; RRID:Addgene_141385) [Reference Gordon, Jang and Bouhaddou17]. We used 1 μL lentivirus with the titer ≥ 1x10⁶ TU/mL, containing ∼1000 functional lentiviral particles in the experiments (TU: transduction unit).
Antigen Testing
Antigen testing was performed in the clinical laboratory using the CareStart Rapid Diagnostic Test for the Detection of SARS-CoV-2 Antigen (Access Bio, Somerset, NJ). Briefly, the nasopharyngeal swab is removed from pouch and the swab is introduced to the nasal passage until it reaches the posterior nasopharynx. The swab is rotated 3–5 times over the posterior nasopharynx and then removed from the nostril with rotation to sample the anterior nares. In the laboratory, the seal is removed from the extraction vial containing the extraction buffer. The swab is placed in the extraction vial and rotated vigorously 5 times. The extraction vial is then squeezed while the swab is removed by rotating against the sides of the extraction vial to remove any excess fluid from the swab, and a cap is placed on the extraction vial. The sample is mixed by tapping the bottom of the extraction tube, inverted, and 3 drops are squeezed into the sample well. Results are read at ten minutes.
A red control line will appear at top of well by the letter “C.” If the test is positive, a blue line will appear below the red line and across from the letter “T.” Positive result reveals red and blue lines. Negative results reveal only a single red line. A result with a blue line without a red line is invalid and test is repeated.
Data Analysis
Fluorescence data were collected using Gen5 2.0 microplate reader software (BioTek), processed in Excel, and analyzed and plotted using GraphPad Prism 8.
Results
Characterization of COVID-19 Blood Samples
Table 1 summarizes the characterization of blood samples from COVID-19 patients. Antigen testing was performed for whole blood samples at the clinic site to identify current infection of the patients. PCR tests were performed for plasma/serum samples to inform infection as current.
Table 1. Characterization of COVID-19 blood samples
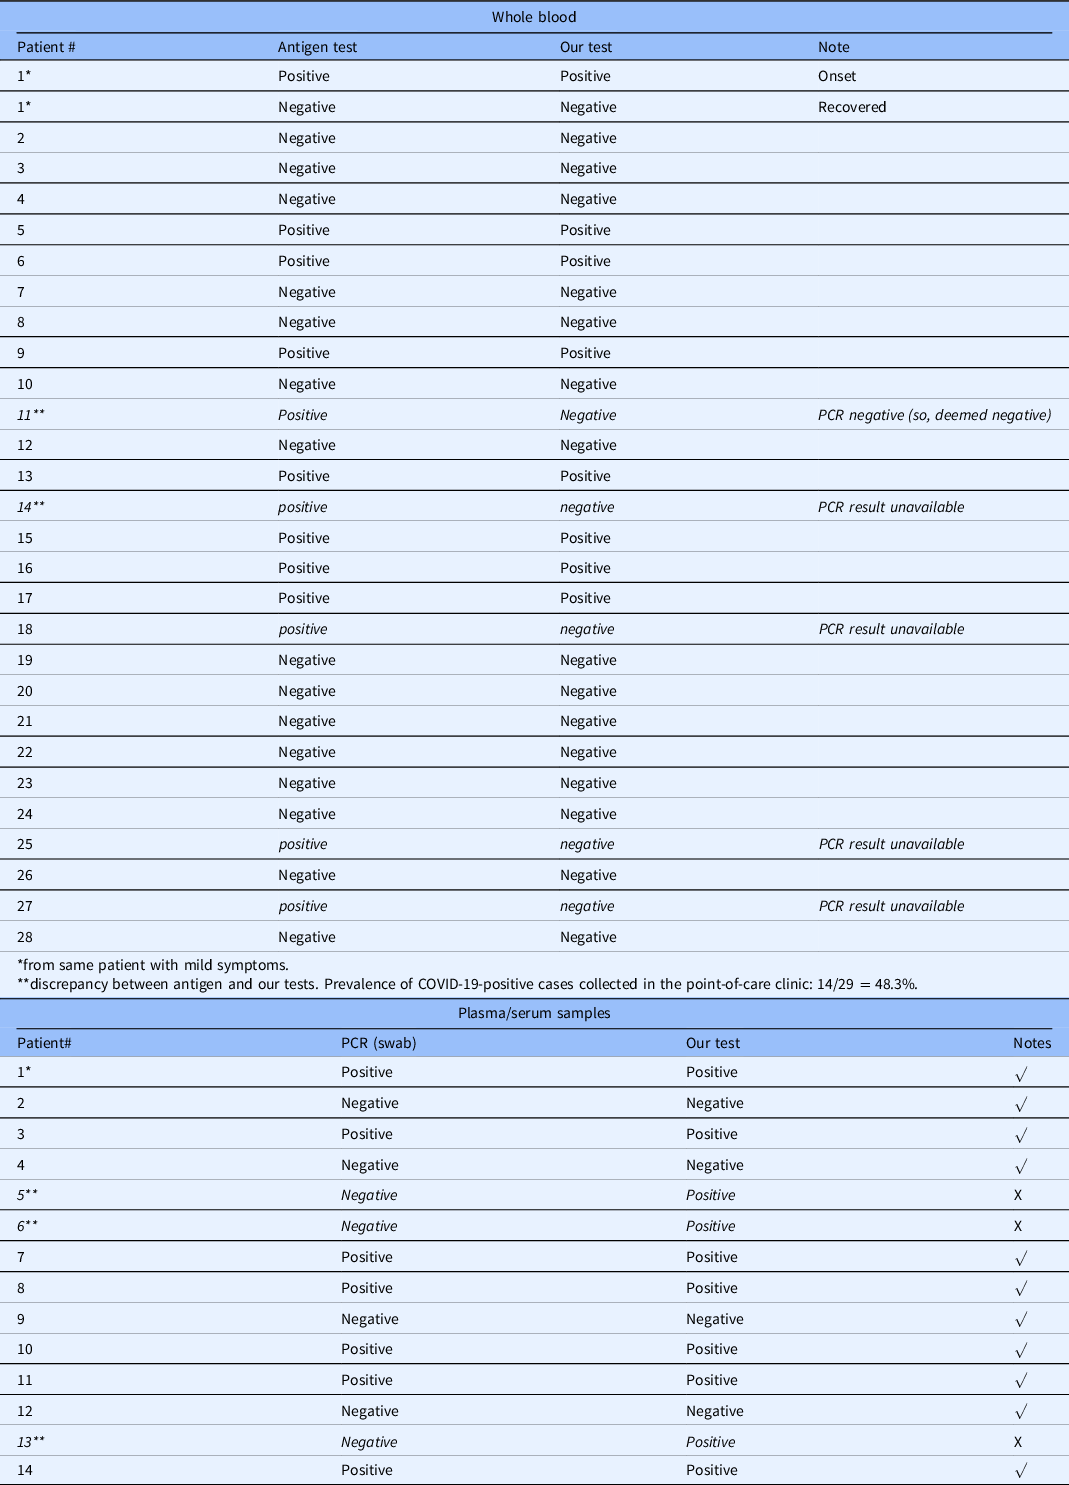
* plasma, #2-#14 are sera.
** discrepancy. Prevalence of COVID-19-positive cases collected in the hospital: 7/14 = 50%.
Conservation of E/Orf3a Motifs that form Ion Channels
Figure 1 shows E protein sequence alignment in bat SARS-CoV-1, human SARS-CoV-1, human SARS-CoV-2, MERS, and other four common coronaviruses (HCoV-229E, HCoV-NL63, HCoV OC43, and HCoV-HKU1). There is 94.97% homology between SARS-CoV-1 and SARS-CoV-2 E protein sequences. E contains a transmembrane domain between G10 and L37 (red arrows) that forms an ion channel [Reference Nieto-Torres, DeDiego and Verdia-Baguena20,Reference Verdiá-Báguena, Nieto-Torres, Alcaraz, Dediego, Enjuanes and Aguilella29]. Amino acid residues from G10 to L37 are conserved between SARS-CoV-1 and SARS-CoV-2.
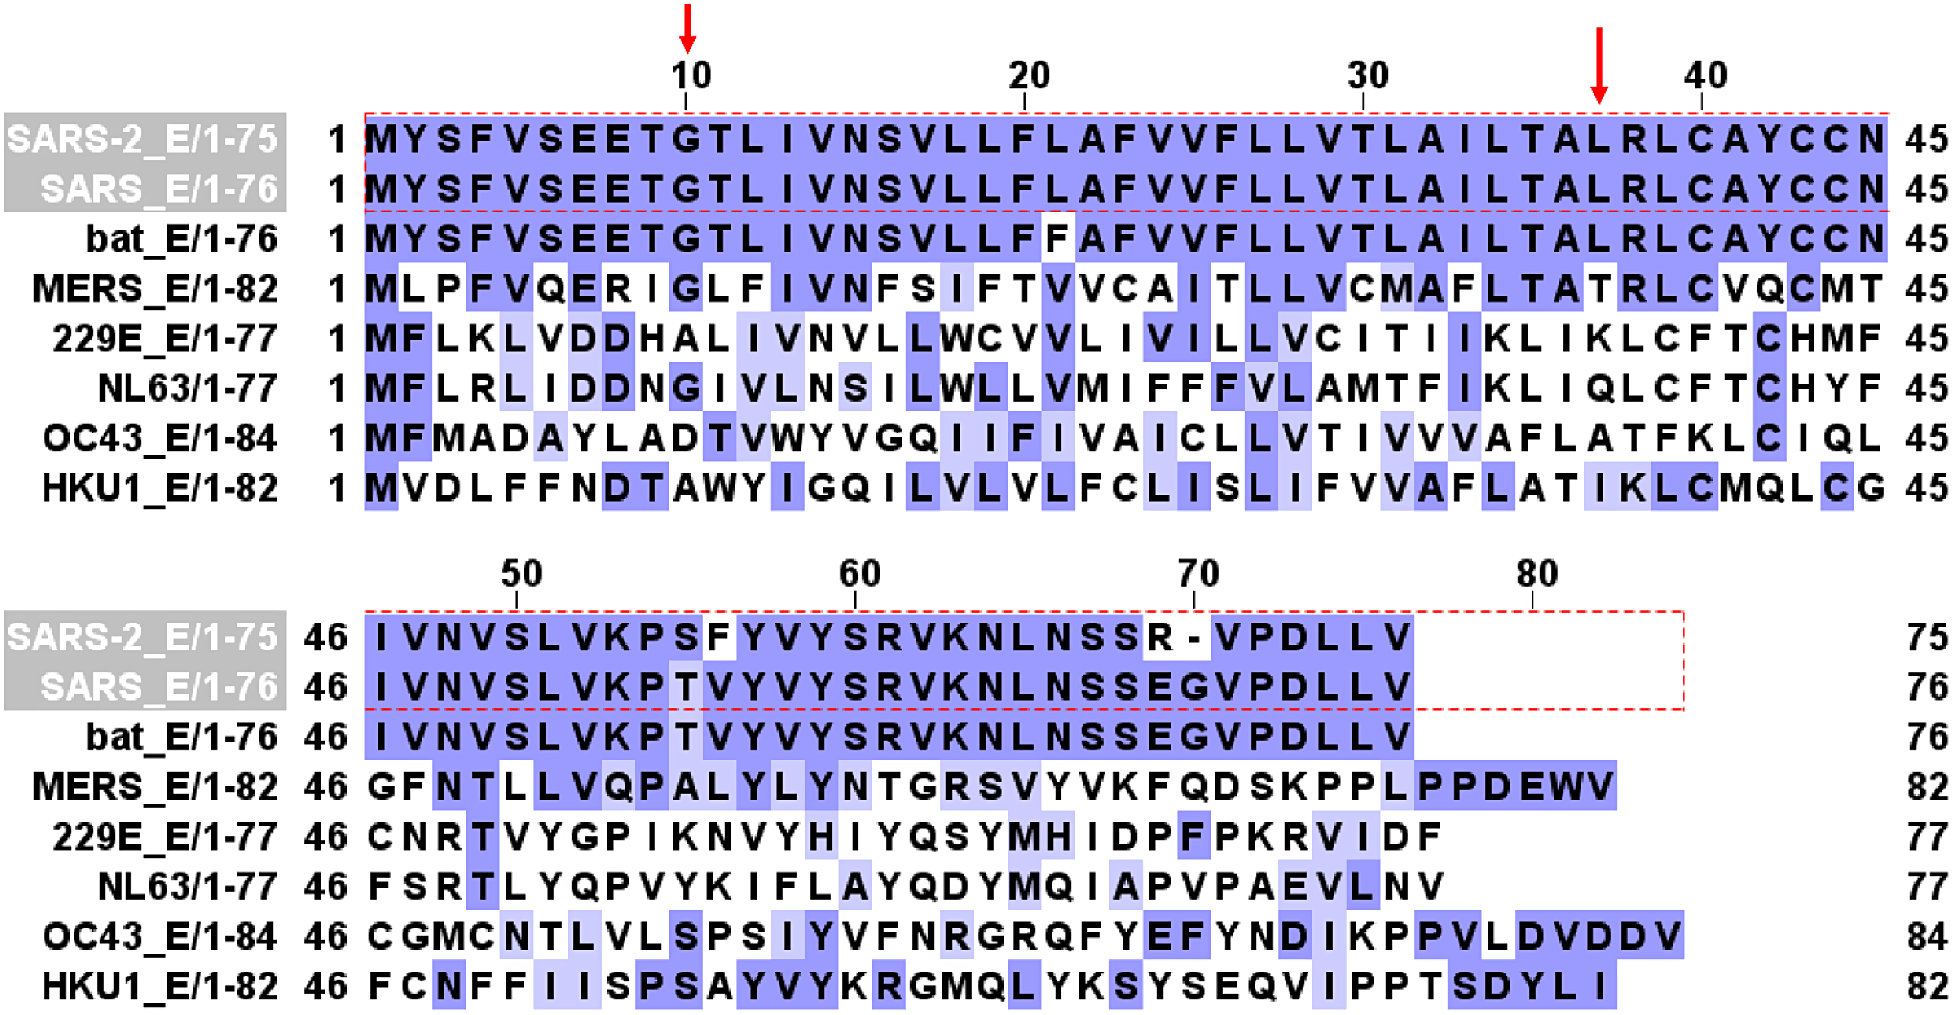
Fig. 1. E channel protein sequence alignment in SARS-CoV-2, SARS-CoV, bat SARS-CoV, MERS, 229E, NL63, OC43, and HKU1 coronaviruses. Red arrows mark the beginning (G10) and ending (L37) of the transmembrane domain that forms the channel.
Figure 2 shows Orf3a protein sequence alignment in bat SARS-CoV-1, human SARS-CoV-1, human SARS-CoV-2, and other two coronaviruses (229E, NL63). There is 73% homology between SARS-CoV-1 and SARS-CoV-2 Orf3a protein sequences. Orf3a contains three transmembrane domains (TD). TD2 and TD3 are required for non-voltage-gated ion channel activity [Reference Castaño-Rodriguez, Honrubia and Gutierrez-Alvarez7]. Three amino acid residues (red arrows), Y91, H93, and Y109, are essential for K+ permeability [Reference Castaño-Rodriguez, Honrubia and Gutierrez-Alvarez7] and are conserved in SARS.
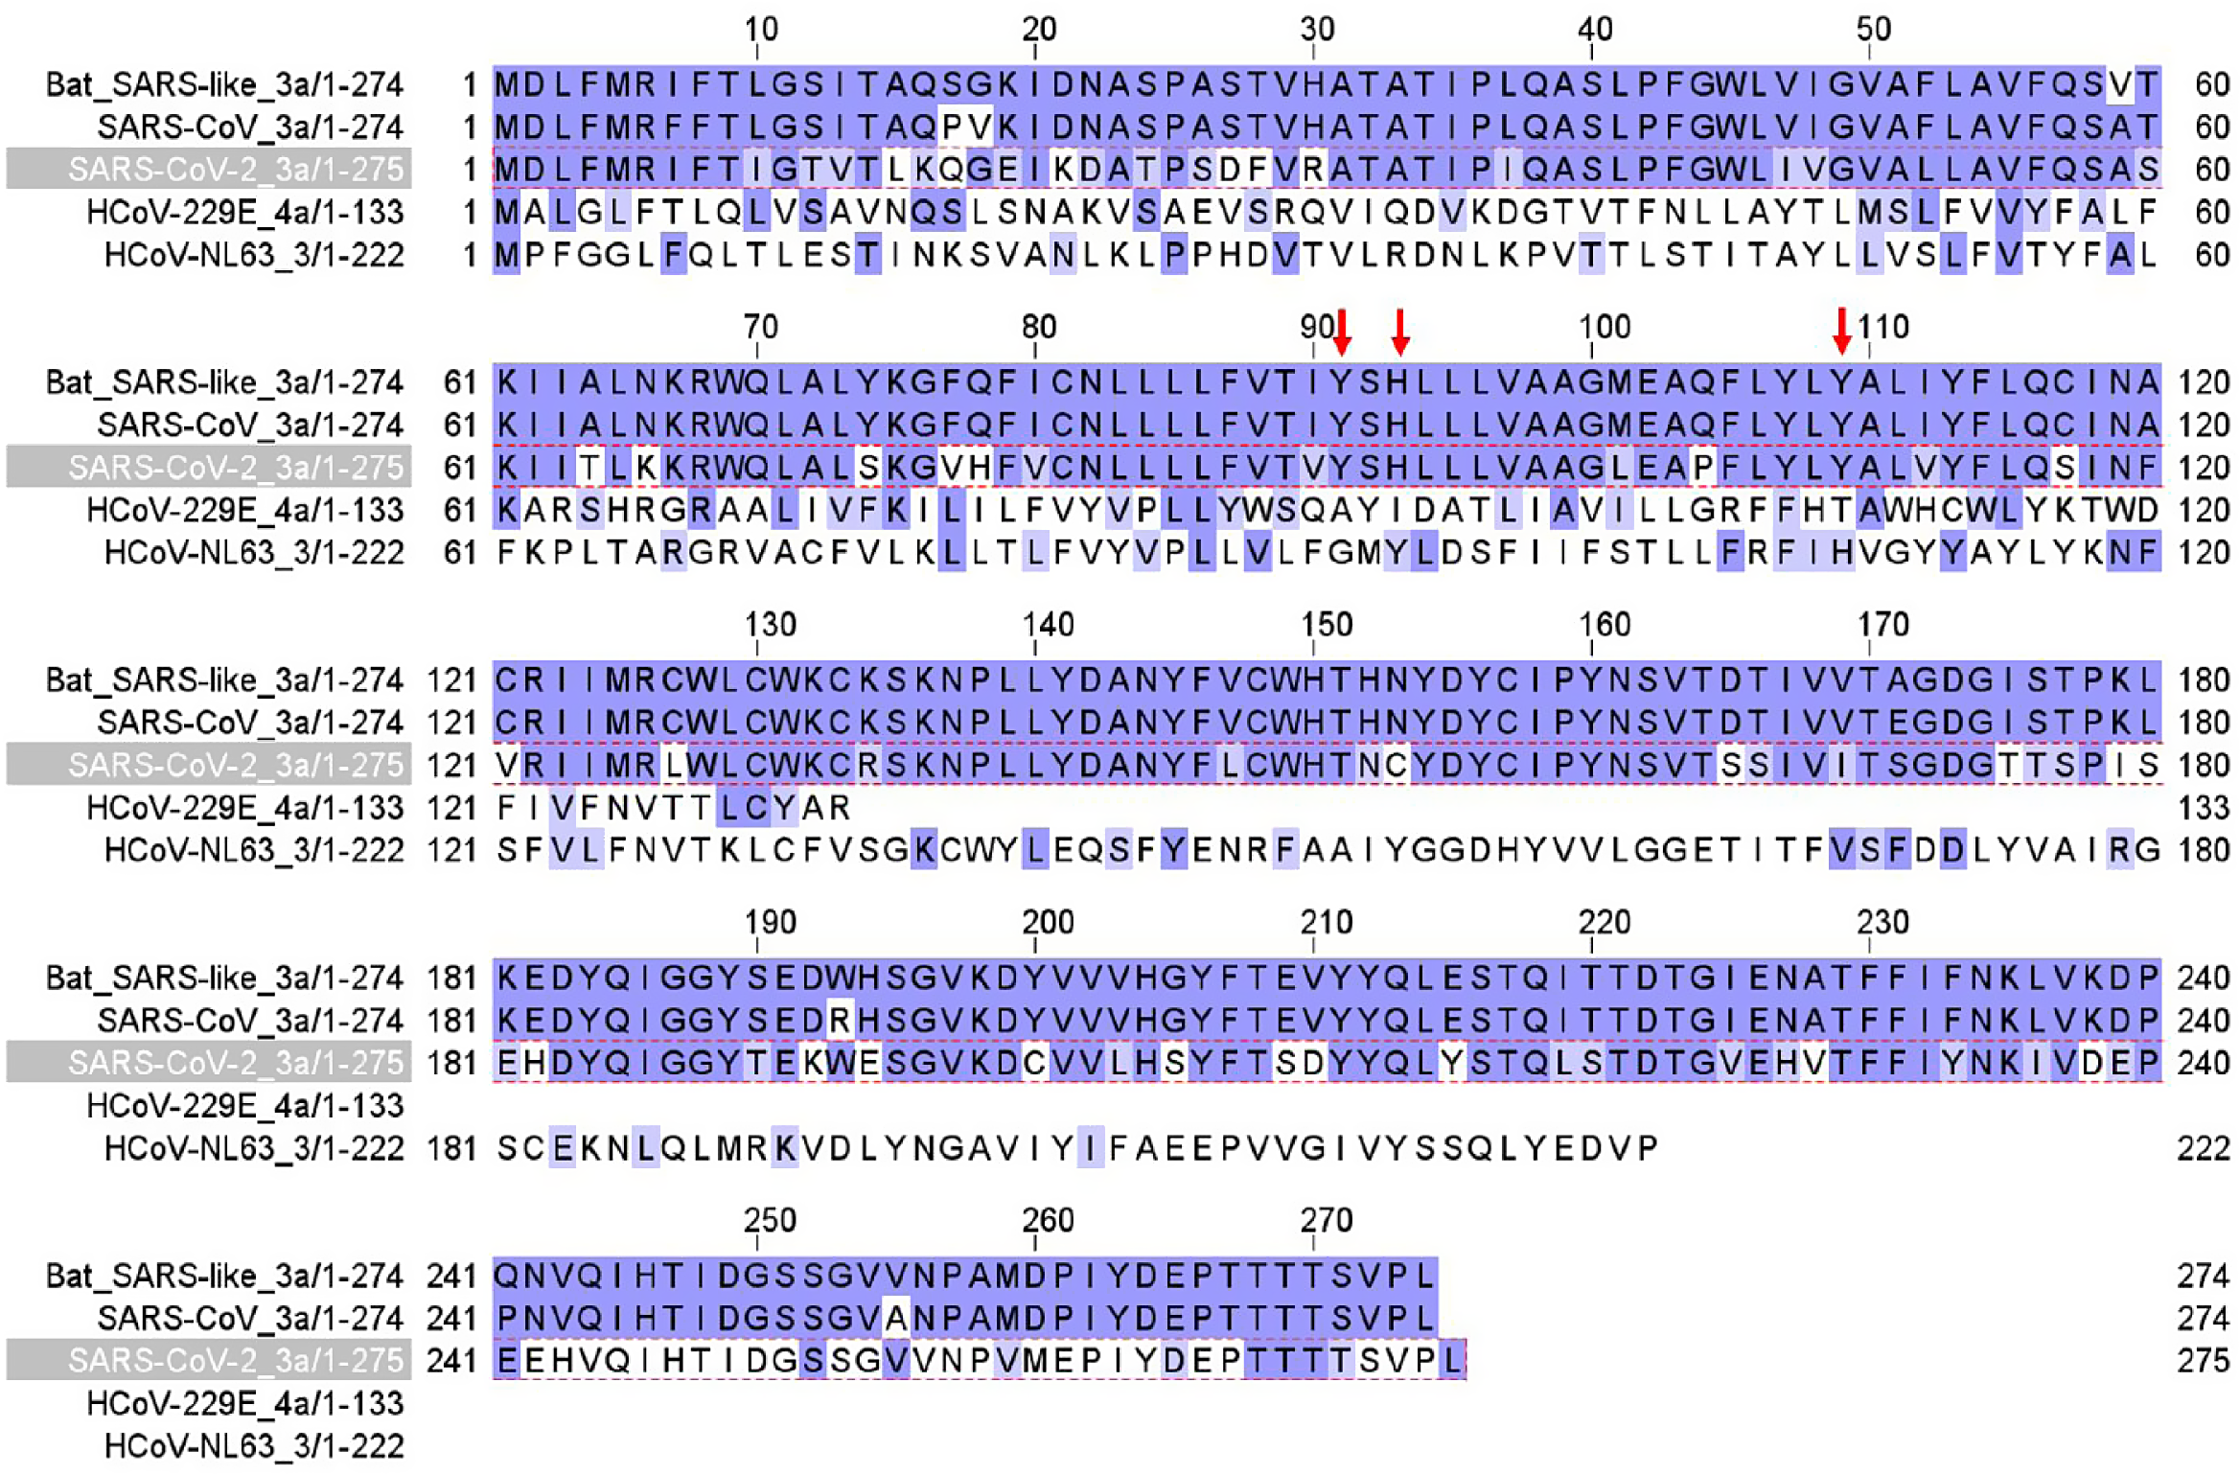
Fig. 2. Orf3a channel protein sequence alignment in SARS-CoV-2, SARS-CoV, bat SARS-CoV, HCoV-229E, and HCoV-NL63 coronaviruses. Red arrows label three amino acid residues critical for K+ permeation of the channel.
Detection of Orf3a/E Channel Activity in Lentivirus Containing Orf3a and E
Figure 3 shows a proof-of-concept experiment in a cell-free preparation. Lentivirus containing Orf3a exhibited an increasing fluorescence signal (blue, Fig. 3A) induced by 4-AP (1 mM). In contrast, 4-AP failed to trigger an increase in fluorescence signal in the presence of Orf3a channel blocker, emodin (0.5 mM) (red, Fig. 3A) [Reference Schwarz, Wang, Yu, Sun and Schwarz25]. Normal blood (NB) from healthy humans did not show a change in fluorescence after 4-AP addition and was used as a negative control (black dot, Fig. 3A).
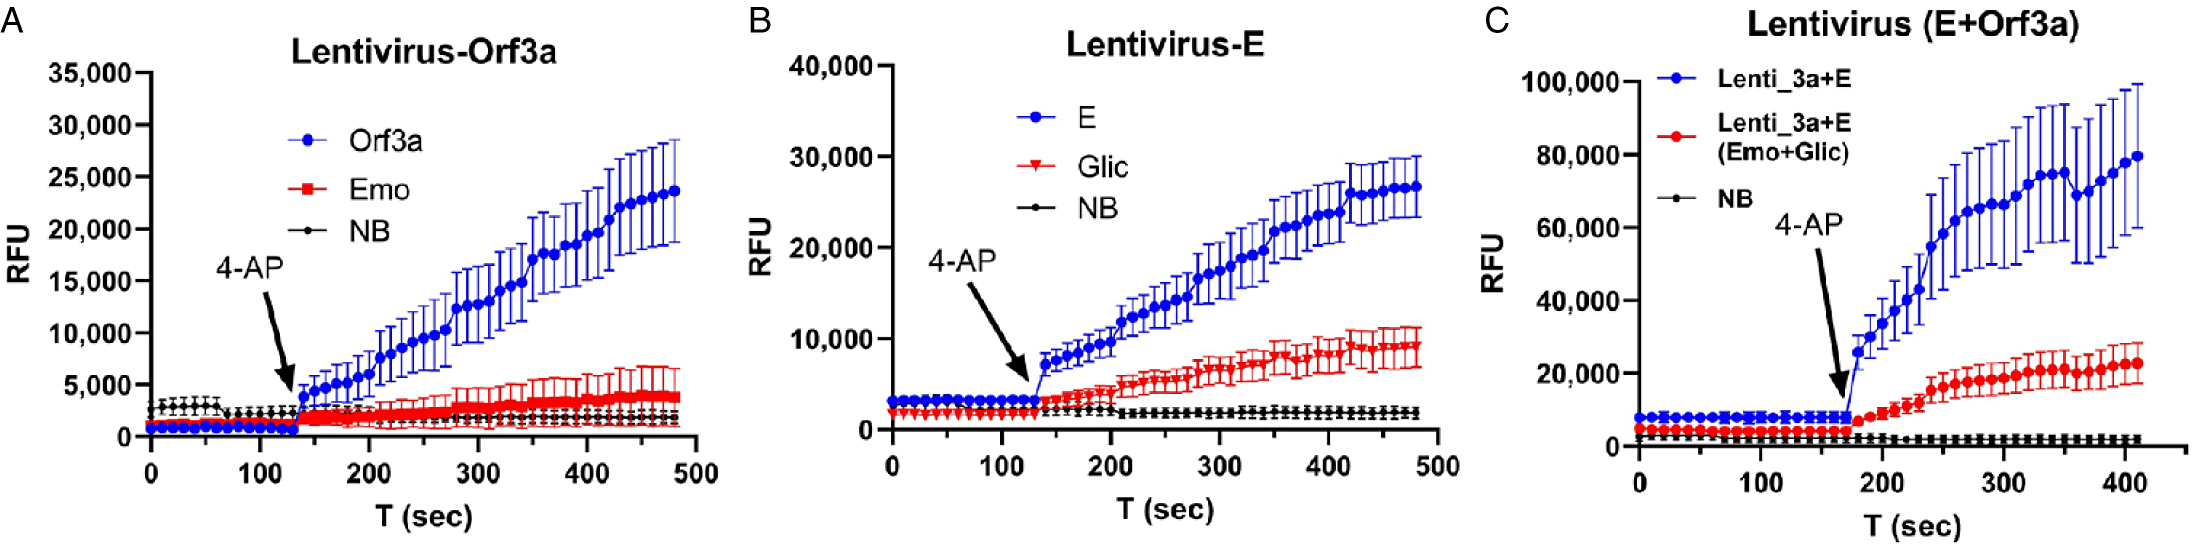
Fig. 3. Detection of E/Orf3a channel activity in lentivirus that contain E and Orf3a channels. A: lentivirus that contains Orf3a protein. B: lentivirus that contains E protein. C: lentivirus that contains both Orf3a and E protein. Arrow: time when 4-AP was applied. Emo – emodin; Glic – gliclazide; NB – normal blood sample.
In lentivirus containing E, 4-AP (1 mM) induced an increase in fluorescence (blue dots, Fig. 3B), which was reduced by 0.5 mM E channel blocker (Glic, gliclazide) [Reference Singh Tomar and Arkin26] (red, Fig. 3B). When both Orf3a and E were used, a significantly larger increasing fluorescence (blue, Fig. 3C) was induced by 4-AP, and this increase was reduced by a combination of 0.5 mM emodin and 0.5 mM gliclazide (red, Fig. 3C). In Fig. 3C, the fluorescence signal intensity is nearly doubled compared to that in Fig. 3A and B, indicating channel activities of both Orf3a and E are additive.
Detection of Orf3a/E Channel Activity in Blood Samples of COVID-19 Patients
Figure 4A shows the representative results in a whole blood sample from a COVID-19 antigen test-positive patient. A small volume (5 μL) of sample was used. Fluorescence was induced by 4-AP (black arrow) and caused an increase (red dots), indicating the presence of SARS-CoV-2 virus. This increase in fluorescence was reduced by 0.5 mM emodin and 0.5 mM gliclazide (blue triangle) and blocked by 1 mM emodin and 1 mM gliclazide (blue circle). 4-AP failed to induce an increase in fluorescence in a whole blood sample from a COVID-19 antigen test-negative patient (gray circle) and in normal blood used as a negative control (black triangle).
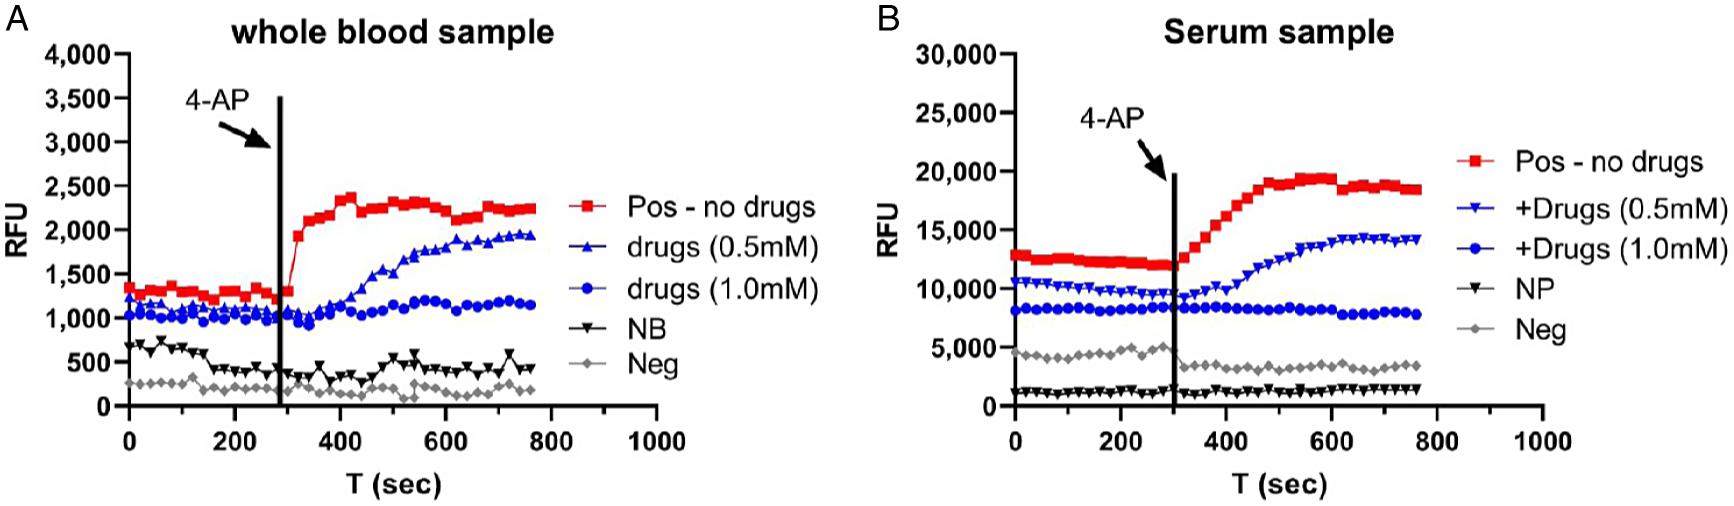
Fig. 4. Detection of E/Orf3a channel activity in COVID-19 blood. A: whole blood samples. Pos – COVID-19-positive blood; NB – normal blood; Neg – COVID-19-negative blood. B: serum sample. Pos – COVID-19-positive serum; NP – normal plasma; Neg – COVID-19-negative serum. Vertical line: time when 4-AP was applied. RFU, relative fluorescence unit.
Figure 4B shows the representative results in a serum sample from a COVID-19 PCR test-positive patient. Fluorescence was induced by 4-AP (black arrow) and caused an increase (red dots), indicating the presence of SARS-CoV-2 virus. This increase in fluorescence was reduced by 0.5 mM emodin and 0.5 mM gliclazide (blue triangle) and blocked by 1 mM emodin and 1 mM gliclazide (blue circle). 4-AP failed to induce an increase in fluorescence in a serum sample from a COVID-19 PCR test-negative patient (gray circle) and in normal plasma used as a negative control (black triangle).
We have tested a total of 42 blood samples. In 18 antigen/PCR-positive samples, our test results found 15 are positive, demonstrating an 83% concordance. In 24 negative antigen/PCR samples, our test results found 21 are negative, showing an 87.5% concordance.
Discussion
Among the three testing methods, both PCR and antigen tests inform current infection. PCR has extremely high sensitivity (99%) and specificity (97%) [Reference George, McGee, Giangrasso, Finkelstein, Wu and Glatt16], serving as an accepted method in diagnostic testing laboratories. The most recent report showed that by targeting three viral genes (Nsp10, NSP12, N), the PCR assays can provide 100% accuracy of test results, based on 23 COVID-19-positive samples and 5 COVID-19-negative samples [Reference Bustin, Coward, Sadler, Teare and Nolan5]. Variants that increase the transmission occur mostly in the spike proteins [Reference Abdool Karim and de Oliveira1]. While a main concern for these variants is the reduced efficacy of vaccine [Reference Peacock, Penrice-Randal, Hiscoz and Barclay21] due to decreasing neutralizing activity and immune escape [Reference Abdool Karim and de Oliveira1,Reference Chen, Zhang and Case12], there is also a risk that some variants may not be detected by current PCR- and antigen-based testing. Most recently, a new variant B.1.616 has been identified in which only 15% of patients infected with this variant were detected by RT-PCR [Reference Fillatre, Dufour and Behillil14], probably due to nine mutations and one deletion on the spike protein [Reference Fillatre, Dufour and Behillil14]. Antigen test has a higher sensitivity in symptomatic patients (80%) than in asymptomatic patients (41.2%), while its specificity is high (>98%) independent of disease phenotype [Reference Pray, Ford and Cole23]. Both RT-PCR and antigen tests have not been reported to detect viral proteins in blood.
Recently, a mass-spectrometry-based high-throughput test that targeted proteomics (targeting nuvleoprotein peptides) from “nasopharyngeal and oropharyngeal swabs” was reported [Reference Cardozo, Lebkuchen and Okai6]. Combined with automation in sample process, this new method has the potential to test large numbers of clinical samples. However, it is unknown whether this method can be applied to blood samples.
In this exploratory research, we targeted Orf3a and E channels for several reasons. First, Orf3a is present only in SARS-CoV-1 and SARS-CoV-2; therefore, a combination of Orf3a and E channel activity is highly selective. Second, highly sensitive detection methods based on fluorescence are used to detect channel activity. Third, utilization of Orf3a and E channel blockers allows us to detect signals only from Orf3a/E while eliminating background fluorescence in blood by subtracting the fluorescence signals in samples without channel blockers. Fourth, protein sequence motifs that control channel activity of Orf3a/E are highly conserved. Thus, detecting the conserved channel activity of Orf3a/E may serve as a valuable tool as viral variants proliferate worldwide. Other interpretations of these preliminary findings are possible.
Limitations of the Work
The sample size is not large in this work, and samples were collected when disease prevalence was high (approximately up to 50%) in the point-of-care clinic. A larger sample size is needed to test our method for detecting functional viral proteins in blood at lower disease prevalence.
Conclusions
Our new testing method for SARS-CoV-2 may complement present testing by identifying functional virus in blood samples in a 96-well plate with a total experimental time of around 2 hours. The method can be easily expanded to 384-well plate, and the experimental time can be shortened to less than 1 hour with automation. In addition, our test targets conserved motifs in the Orf3a/E proteins, which are not affected by virus variants. This focus on virally conserved components could alleviate concerns regarding the accuracy of molecular-based methodologies as new variants spread through the community. Finally, detection of the SARS-CoV-2 in blood provides a reasonable explanation as to how the virus spreads from the point of entry in the respiratory tract to other organs including the heart.
Acknowledgements
The authors are grateful for Dr Peter Stoilov in the department of biochemistry at West Virginia University, who provided constructive discussion and suggested authors to test cell-free preparation during the development of the research.
Research reported in this publication was supported by the National Institute of General Medical Sciences of the National Institutes of Health under Award Number U54GM104942. The content is solely the responsibility of the authors and does not necessarily represent the official views of the National Institutes of Health.
Disclosures
The authors have no conflicts of interest to declare.


 Open access