


1. Introduction
As part of the federal income tax code, the Child Tax Credit currently provides a partially refundable tax credit of $2000 per child. The credit reduces the tax burden by $2000 per child for parents of most American children. About a third of American children, however, live in families whose incomes are too low to receive the full $2000 per child, and about 1 in 10 children get no benefit whatsoever. If the tax credit were fully refundable, it would be akin economically to a $2000 child allowance (The international and historical context of child allowance and CTC is presented in Supplementary Appendix 2); a proposal to do just that was the centerpiece of two of the four policy packages examined by the National Academy of Science consensus report, A Roadmap to Reducing Child Poverty (National Academies of Sciences Engineering and Medicine, 2019; henceforth “NAS report”). More recent proposals, including the American Family Act and the recently enacted 1-year child allowance in the American Rescue Plan (ARP), contain more generous allowances: $3600 for children ages 0–5 and $3000 for children ages 6–17 (we refer to this as the $3000/$3600 child allowance). Senator Romney’s Family Security Act proposed even more generous allowances: $4200 for children ages 0–5 and $3000 for children ages 6–17 but was financed through cuts of other social programs. The NAS report also documented emerging evidence that cash transfers enhance child development and may therefore be a good investment. Building upon the findings of the NAS report, this article uses a comprehensive benefit-cost analysis to determine if establishing a child allowance in the USA is a sound public investment.
There are three papers that address issues closely related to this article. Holzer et al. (Reference Holzer, Schanzenbach, Duncan and Ludwig2008) find that the annual cost of child poverty is about 4 % of GDP, while McLaughlin and Rank (Reference McLaughlin and Rank2018), using the same methodology but counting a wider array of benefits, find the costs to be 5.4 % of GDP – or, in 2018 dollars, between $800 billion and $1.1 trillion per year. Their estimates, like ours, suggest that a child allowance would be a very good investment. But the estimates are not directly comparable. First, they count benefits only from eliminating poverty. We analyze a policy that extends to children in families of nearly all income levels. Second, the main child allowance proposal we model does not eliminate child poverty, but rather cuts it by about 45 %. Third, they use a different methodology, which begins with differences in experiences between children who grow up in poverty and those who do not and then adjusts for genetic contributions to poverty between the two groups. A third paper, Hendren and Sprung-Keyser (Reference Hendren and Sprung-Keyser2020), is closer to our approach in that they begin with quasi-experimental and experimental studies and thus include many of the same studies that we include. Though they focus on the marginal value of public funds rather than benefit-cost analysis, they find that in general, the two kinds of analyses produce similar results. Their estimates suggest that cash and near-cash benefits would be at best a marginally good investment. But they only count the subset of potential benefits that happen to be measured in each program/study they review independently, rather than finding the central tendency of estimates for each type of benefit across programs or aggregating across different types of benefits measured in different evaluations. Another key distinction between their approach and ours is that when calculating health benefits, they place a strikingly low value on life that is not consistent with other literature or government practice.
Our analysis is based on a systematic review of studies documenting the effects of cash and near-cash income transfer programs on child and parent outcomes. The studies examined are primarily quasi-experimental and examine the effects of cash and near-cash transfers – most commonly Food Stamps and the Earned Income Tax Credit, as the rollouts and structures of these two programs allow causal analysis of their impacts. Nearly all have been published in the last decade. For child beneficiaries, impacts include future earnings and taxes paid, educational attainment, and four health outcomes: birth weight, neonatal mortality, health between 1 month and death, and longevity. For parent beneficiaries, impacts include health, mental health, and longevity. We also estimate the declines in expenditures on health, other transfer programs, child protective services, and the criminal justice system, and increases in expenditures associated with the increase in educational attainment and longevity. We summarize the methodology, data, and findings of each study employed in our analysis and standardize their findings to reflect the effects of a $1000 increase in household income per year on the impacts of interest. We then monetize the value of each benefit and cost, using standard values for health and life, administrative data on costs, and a 3 % social discount rate to discount the value of future benefits. For each benefit and cost, we estimate the value to society as a whole and, separately, the direct benefits and costs for program beneficiaries along with the indirect benefits and costs to taxpayers. The transfer costs and their distributional impacts are estimated via a micro-simulation analysis of CPS data that incorporates changes in labor supply.
The article is organized as follows. Section 2 presents and discusses a conceptual table of the benefits and costs of a child allowance. Section 3 describes the methodology used in our benefit-cost analysis, highlighting the assumptions and rules that underlie our analyses, describes in brief the estimates for each benefit and cost in the conceptual table that result from an increase in family income of $1000, and presents a summary table of the benefits and costs per $1000 increase in household income for a single child and single parent low-income family. Section 4 converts the estimated benefits and costs per $1000 increase in household income for low-income families into estimates of aggregate benefits and costs for all families. Section 5 conducts sensitivity analyses. Section 6 summarizes and contextualizes our main findings and discusses limitations and future research.
2. Expected benefits and costs
Table 1 describes the expected monetary benefits and costs of a child allowance. The direct benefits and costs are those that accrue to the children and their parents from the child allowance that the family receives. Indirect benefits and costs accrue to everyone in the society, the bulk via changes in taxes and the rest via reductions in the victim costs of crime and in health insurance premiums. Total benefits and costs are the net sum of direct and indirect benefits and costs. For ease of exposition, we refer to indirect benefits and costs that accrue to people other than those directly receiving the payment as benefits and costs to taxpayers. Note that most beneficiaries are also taxpayers (in the case of children’s parents) or will eventually be so (in the case of children). This approach of dividing the population into beneficiaries or taxpayers is not meant to convey that society is not a single interdependent entity, but rather simply to clarify the accounting of benefits and costs that accrue differentially across the population. Each row in the table provides a conceptual description of a potential benefit or cost. A plus indicates a benefit and a minus a cost. The main objective of a benefit-cost analysis is to attach dollar values to all of the benefits and costs listed in the table. Benefit-cost analyses normally focus on the last column, that is, the benefits and costs to society as a whole.
Table 1. Conceptual table of monetary benefits (+) and costs (−) of a near-universal child allowance.
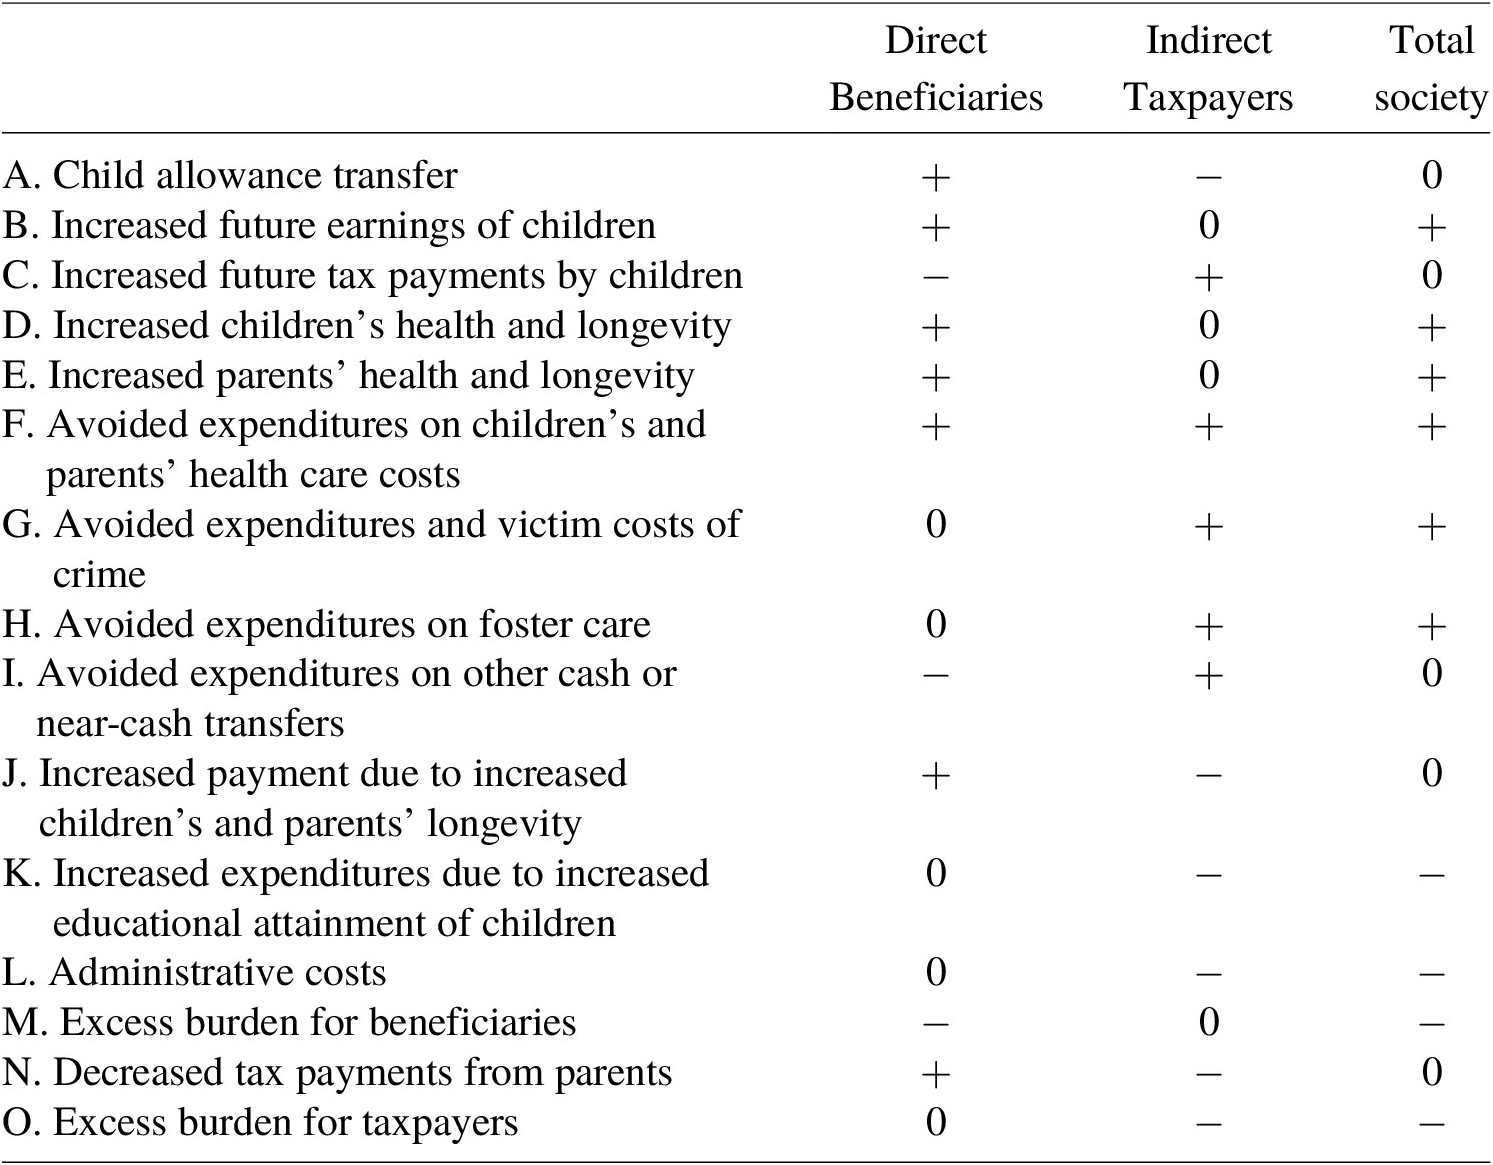
Row A in the table indicates that the cost to taxpayers of the child allowance transfer is exactly offset by the benefit of the child allowance transfer to beneficiaries. Cash benefits of one dollar are worth a dollar to beneficiaries and the cost to taxpayers equals one dollar. The direct costs of a cash transfer to society as a whole are zero. This is not to say that transfers are costless to society. Rows L, M, and O, discussed below, describe the additional costs of transfers to beneficiaries, taxpayers, and society.
Row B in the table indicates that child allowances are expected to lead to increases in the earnings of child beneficiaries when they become working-aged adults. The expectation is derived both from the assumption that income enhances child development and, more importantly, from ample empirical evidence of positive effects on earnings and other outcomes associated with increased earnings (reviewed below). The increased earnings are of direct benefit only to child allowance beneficiaries. Taxpayers get nothing directly from beneficiaries’ earnings – hence the zero in the taxpayers’ column. Row C indicates that increases in beneficiaries’ earnings lead to higher tax payments, which are a cost to beneficiaries and an indirect benefit to taxpayers – either in the form of more public goods or lower taxes for them. The zero in the last column indicates that the loss for beneficiaries in terms of increased taxes paid is exactly equal to the gain to taxpayers.
Rows D and E reflect health and longevity benefits to child and parent beneficiaries and to society as a whole. Rows F–I reflect reductions in public expenditures on health care, criminal justice, foster care, and other cash and in-kind assistance programs that are expected to follow from increased future earnings and better health described in rows B, D, and E. These reductions in public expenditures accrue primarily to taxpayers via reductions in taxes. Most do not accrue to beneficiaries. But note that in the case of reductions in health expenditures in row F, the benefit to taxpayers comes partially from reductions in taxes and partially from reductions in private health insurance costs.Footnote 1 Beneficiaries also benefit because their out-of-pocket health expenditures will decline as a consequence of their better health. More important, row G shows that the transfer leads not only to reductions in criminal justice expenditures but also to reductions in victimization costs – how much victims are willing to pay to avoid the crime.
Also note that row I (avoided expenditures on other cash or near-cash transfers) entails a cost to beneficiaries that is exactly equal to the savings for taxpayers, unlike rows G–H, which reflect reductions in expenditures on services including crime and foster care. While loss of cash has an intrinsic cost to beneficiaries, a change that renders a service unnecessary does not. If the service is not needed, the beneficiary has lost nothing by not receiving it.
The increased longevity in rows D and E, while obviously of value to beneficiaries, is not without a cost. As shown in row J, due to increased longevity, taxpayers need to finance more health care and Social Security payments. Also, based on evidence that children acquire more education due to cash transfers, we take into account the increased expenditures associated with more schooling in row K.Footnote 2
Rows L (administrative costs), M (excess burden for beneficiaries), and O (excess burden for taxpayers) describe the costs of transfers. These costs are what Arthur Okun, in his classic Okun (Reference Okun1975) book Equality and Efficiency: The Big Tradeoff, referred to as leaks in the transfer bucket. Administrative costs of transfers (row L) are of no benefit to beneficiaries but must be paid for by taxpayers. The excess burden for beneficiaries (row M) arises from a distortion in prices that confront beneficiaries. Child allowances subsidize the costs of having children, giving rise to an excess burden that is borne by beneficiaries relative to a grant of the same amount that was not tied to the beneficiary’s number of children.Footnote 3 The excess burden of taxation (row O) refers to the social welfare loss that comes from the distortion in prices from taxation. Income taxes, for example, distort the incentive to earn more income and reduce the incentive to report income. These distortion costs are borne by taxpayers. Note that excess burden depends not only on the initial taxation for financing the child allowance, but also on the present discounted value of future increases and decreases in taxes and transfers. Row N describes the reduction in tax payments from parent beneficiaries due to decreases in employment, hours worked, and earnings. This reduction in taxes is a benefit to beneficiaries but a cost to taxpayers. The non-monetizable benefits and costs – such as poverty reduction – are important, but because of space constraints are discussed in Supplementary Appendix 3.
3. Measuring impacts: study data, methods, findings, and standardization
A key assumption underlying our analysis is that the effects of cash and near-cash assistance on children and parents are expected to be similar to one another and to a child allowance because they all provide similar monetary benefits to parents with children. Because all of these programs increase family income, all are expected to increase parents’ and children’s well-being in the short- and long-term. We do not adjust for possible differences between programs’ effects in our calculations because we believe such differences are secondary; nonetheless, it is worth briefly noting several differences at the outset. One obvious difference is that food stamps are not cash, but they are what researchers consider “near-cash.” Food stamps, on average, are worth about 80 cents per dollar (Whitmore, Reference Whitmore2002), suggesting that the same dollar amount given in the form of cash child allowances would lead to 25 % larger benefits among child allowance recipients. Another difference is that while mothers’ pensions and food stamps provide transfers to those with no earnings, as do child allowances, those transfers phase out at relatively low-income levels, which is not the case with a child allowance; transfer phase-outs from these programs may discourage earnings in ways that a child allowance would not. The EITC, in contrast, provides cash only to those who work, and the size of the payment increases with earnings at low levels. However, the vast majority of EITC beneficiaries have sufficient earnings such that further increases in earnings actually reduce their EITC (Eissa & Hoynes, Reference Eissa and Hoynes2006), so the effects of the EITC for them should be similar to the effects of food stamps or mothers’ pensions; that is, as recipients’ earnings rise, their EITC payment falls.Footnote 4
We followed a meta-analysis type approach in gathering evidence. We used a three-stage screening process to identify relevant studies for each benefit and cost. While the first two stages cast a wide net, the last stage of the screening process limited studies of impacts to quasi-experimental and experimental studies. Our literature search and winnowing process is described in Supplementary Appendix 1. We found 21 studies that examine the impacts of a change in income on our outcomes of focus and met our stringent criteria.
Table 2 summarizes the impact estimates from the studies reviewed. Note first that all studies are limited to low-income families. At the end of this section, we deal with this issue. The studies are divided between those used for the calculation of benefits and those we call supplementary impact studies. The studies examining the causal impacts of cash or near-cash transfers on children’s birthweight and educational attainment and parents’ mental health are labeled as supplementary, and we make this distinction because valuing them in dollar terms and adding them to the value of other benefits would involve double-counting benefits. Increases in years of schooling and declines in low birth-weight are used to calculate costs. Documenting these intermediate causal impacts also helps clarify ways that increased income affects the ultimate outcomes. With one exception, all the studies find beneficial impacts. Most find statistically significant impacts.
Table 2. Estimated impacts for low-income families of a $1000 increase in household income as a result of a cash or near-cash transfer.

a All results are reported in 2019 dollars.
b Results were statistically significant at the 5% level or better.
c Includes both statistically significant and non-significant results for two or more measures of the same outcome.
d All results in the children’s health section, parents’ health, and longevity section are calculated and expressed as a percentage of the full QALY value of $126,628, as described later in the children’s health section.
The remainder of this section describes briefly how we use standardized impacts calculated from the literature, attach shadow prices to the impacts, and obtain present discounted values of the future streams for each benefit and cost described in Table 3. Details of the literature and the standardization process are described in Supplementary Appendix 4.
Table 3. Present discounted value of monetary benefits and costs for single child, single parent low-income families per $1000 increase in household income: Using mean impact estimates (in $).
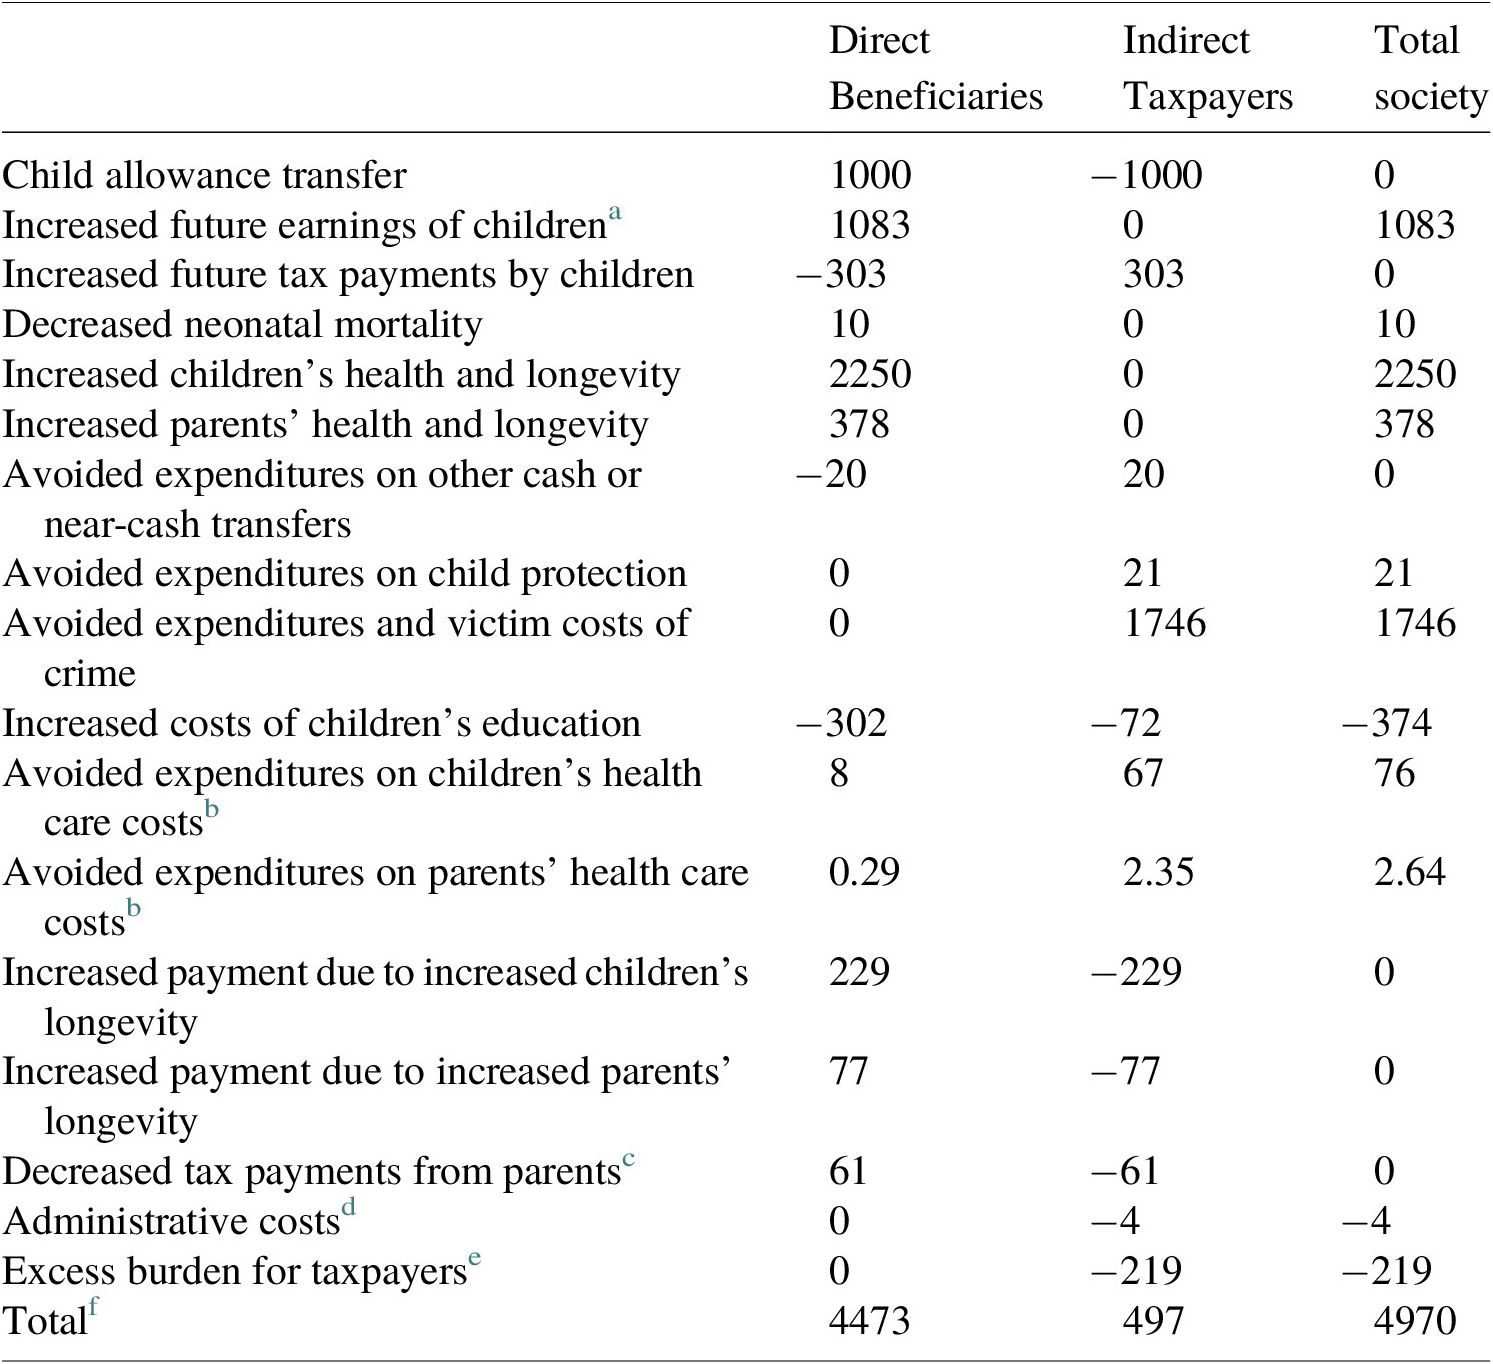
a Future earnings are valued at 75 % of the face value ($1444). This is because some increases in earnings come from increased hours, and our upper bound estimate (to be conservative) is 25 %. To be conservative, we assume the recipient gets no surplus from increased earnings that come through additional hours.
b Reductions in health care expenditures reduce both out-of-pocket costs to beneficiaries and public and private insurance costs to taxpayers. Out-of-pocket medical expenditures are about 11 % of national health expenditures in 2019 (Centers for Medicare & Medicaid Services, 2019). We allocate 11 % of the reduced health care costs to beneficiaries and 89 % of the costs to taxpayers at large in the form of reduced taxes and insurance premiums.
c Details on how we estimated decrease in parent tax is included in Supplementary Appendix A5.I.c.
d Based on administrative costs of Social Security benefits, we set administrative costs to 0.4 % of costs of the allowance.
e Excess burden is assumed to be equal to 40 % of the net increase or decrease in the present discounted value of taxes. Neither decreases in victim costs nor reductions in health insurance premiums, 71 and 33 % respectively of total taxpayer benefits are counted in the calculation of excess burden.
f The number for the total may not be exactly the sum of the numbers in the columns due to rounding.
3.1 Children’s future earnings
We use the five studies in Table 2 to estimate the impact of a child allowance on children’s future earnings in adulthood. Four studies examine the impacts of actual cash and near-cash programs – mothers’ pensions, the EITC, and food stamps – while one is a long-term follow-up to a Negative Income Tax (NIT) experiment. These studies and the methodology for standardizing the impacts in terms of a $1000 increase in household income are described in detail in Supplementary Appendix 4. The four studies of the actual government programs show positive impacts. The NIT study by Price and Song finds a negative effect. We take the average impact of the five studies. We use Equation (1) below to calculate the present discounted value of future earnings gains, assuming that earnings begin at age 22 and continue until age 65, and that the average age of children is 9 years:
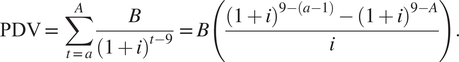 $$ \mathrm{PDV}=\sum_{t=a}^A\frac{B}{{\left(1+i\right)}^{t-9}}=B\left(\frac{{\left(1+i\right)}^{9-\left(a-1\right)}-{\left(1+i\right)}^{9-A}}{i}\right). $$
The present discounted value of future earnings is between −$555 and +$4186. We use the mean value as our baseline estimate whenever there are multiple estimates of a single outcome and conclude that children’s future earnings would increase by $1444 as a result of $1000 increase in household income from cash and near-cash transfers in childhood. In the sensitivity analysis, we examine alternatives. Finally, we estimate that 75 % of these earnings gains are due to increases in wage rates and 25 % to increases in hours workedFootnote 5 and conservatively value the increase in earnings that comes from hour worked at zero to child beneficiaries. Thus only 75 % of the earnings gain ($1083) is counted as a benefit.
3.2 Children’s future taxes
Children’s increased earnings will lead to increases in the taxes that they pay. (To calculate taxes paid, unlike the value of future earnings increases to the children we count 100 % of the earnings increase of $1444.) We use the most recent estimate, to our knowledge, of total taxes paid as a percentage of income to convert the estimate of increased earnings to increased taxes (Wamhoff & Gardner, Reference Wamhoff and Gardner2019). We find that among the lowest 40 % of households by income, 21 % of the increase in earnings would be paid in federal, state, and local taxes (personal and corporate income, payroll, property, sales, excise, and estate taxes). Multiplying our average estimated increase in children’s earnings ($1444) by 21 % yields an estimate of the present discounted value of increased taxes of $303.
3.3 Children’s health
We begin this section with a discussion of the monetary value of health and life. We then present the summaries of studies and the standardized calculations for the health benefits to child beneficiaries flowing from reduced neonatal mortality, improved health from 1 month of age onward, and increased longevity.
3.3.1 Monetizing the value of life and health
We use two measures to place a monetary value on life and on improvements in health: value of statistical life (VSL) and quality-adjusted life-years (QALY). The former is used to value changes in neonatal mortality. This may be an underestimate if people attach more value to reducing the risk of infant death than about reducing the risk of their own death. The latter is used for changes in health and longevity.
The VSL estimates the amount individuals are willing to pay to reduce the risk of death. Robinson and Hammitt (Reference Robinson and Hammitt2016) suggest a VSL of $4.2–$13.7 million for the USA (in 2013 dollars), with the midpoint being $9 million. The U.S. Department of Health and Human Services (DHHS) also uses these estimates in its Guidelines for Regulatory Impact Analysis (2017). Converting into 2019 dollars, VSL ranges from $4.6–$15 million, with a midpoint of $9.9 million. We use the $9.9 million as the baseline VSL value.
QALY quantifies the impact of disease burden on health and longevity. A QALY estimate for a given year ranges from 1 to 0, where 1 represents 1 year of perfect health and 0 represents death. If a life is valued at $9.9 million and average life expectancy is 78 years, the per year value of life would be approximately $126,628.Footnote 6 Therefore, to be consistent, we value 1 year of perfect health at $126,628.
3.3.2 Child neonatal mortality
Our literature search yielded one quasi-experimental study examining the relationship between cash or near-cash transfers and neonatal mortality (death in first 28 days), by Almond et al. (Reference Almond, Hoynes and Schanzenbach2011). Based on their estimates, we conclude that an annual $1000 transfer during childhood decreases neonatal mortality by $10.
3.3.3 Children’s health from 1 month of age onward
This section describes literature on the impact of cash and near-cash transfers on children’s health from 1 month of age onward. One of the studies examines the impact of cash or near-cash transfers on children’s health in childhood (Averett & Wang, Reference Averett and Wang2018) and three examine their impact on children’s health in adulthood (Hoynes et al., Reference Hoynes, Schanzenbach and Almond2016; Price & Song, Reference Price and Song2018; Bailey et al., Reference Bailey, Hoynes, Rossin-Slater and Walker2020). Based on these papers, we conclude that a $1000 increase in household income from cash or near-cash transfer during childhood improves health in childhood by 0.02 % of QALY per year and (using the average impact across the three studies) improves health in adulthood by 0.037 % of QALY per year. We calculate the present discounted value of the change in children’s health in a single year by assuming the average age of child beneficiaries to be 9 and the average age at death to be 78. To calculate the present discounted value of the health impact in childhood, we assume that a given transfer impacts health beginning at age 9 and continues until age 21. To calculate the present discounted value of the health impact in adulthood, we assume that a given transfer impacts health from age 22 to age 78 (to match our assumption for children’s future earnings, we assume impact on adulthood begins at age 22). We conclude that the present discounted value of health impact in childhood is $335 and the present discounted value of health impact in adulthood is $891 (individual values are −$182, $58, and $2796 for individual papers).
3.3.4 Children’s longevity
We use two studies to examine the impact of a cash or near-cash transfer on child longevity (Aizer et al., Reference Aizer, Eli, Ferrie and Lleras-Muney2016; Bailey et al., Reference Bailey, Hoynes, Rossin-Slater and Walker2020). Based on the results (see Supplementary Appendix 4 for details), we conclude that a $1000 increase in household income from a cash transfer during childhood increases longevity by between 0.0194 and 0.105 years. The present discounted value of increased longevity in adulthood is $1024 on average (individual values are $320 and $1729) as a result of a $1000 transfer during childhood. Adding present discounted values of increased longevity and increased health in childhood and adulthood yields a total increase of $2250.
3.4 Avoided health expenditures for children
This section estimates the impact of a $1000 cash transfer on health expenditures for children. In the sections below, we first discuss how our estimates on birthweight are used to estimate reductions in health expenditures in the first 6 months of life and obtain a present discounted value of $8, then we discuss how our estimates on children’s health in childhood and adulthood are used to estimate healthcare expenditure reductions from 6 months of age onward. Counting avoided expenditures in the first 6 months of life ($8) and in subsequent childhood ($12) and adulthood ($56), we conclude that health expenditures decrease by $76 per $1000 transfer.
3.4.1 Decline in healthcare expenditures in first 6 months of life
As discussed in Supplementary Appendix 4, our estimate from Almond et al. (Reference Almond, Hoynes and Schanzenbach2011) indicates that a $1000 cash transfer decreases the probability of low birthweight by 1.19 %. In order to estimate how this changes healthcare expenditures, we use research by Beam et al. (Reference Beam, Fried, Palmer, Agniel, Brat, Fox, Kohane, Sinaiko, John and Armstrong2020), who examine the difference in healthcare expenditures among average birthweight and low-birthweight infants. Results indicate a saving of $8.
3.4.2 Decline in healthcare expenditures from 6 months of age onwards
As described above, we estimate the percentage change in health during childhood and adulthood respectively to be 0.02 % and −0.008, 0.002, or 0.116 %. As described in detail in Supplementary Appendix 4, we rely on the results of three studies to determine the rate at which healthcare expenditures decrease in relation to increases in health status. Although the studies are not causal, no quasi-experimental study exists, to our knowledge, examining this relationship. The mean estimate of the elasticity of healthcare expenditures to improvements in health is −0.84 (minimum elasticity is −0.19 and maximum elasticity is −1.48). We also found one study (East & Friedson, Reference East and Friedson2020) which finds much larger declines in health expenditures from Food Stamps benefits amongst immigrants than our maximum estimate, but generalizability is questionable as the study is limited to immigrants who constitute only 10 % of FS beneficiaries and have better health but less access to health care than the native born population. In the interest of being conservative, we ignore this study in our calculations. Through calculations in Supplementary Appendix 4, we conclude that health care savings equal $12 in childhood and $56 in adulthood.
3.5 Overall parent health
We use four studies to examine the impact of cash or near-cash transfers on parent health (Larrimore, Reference Larrimore2011; Evans & Garthwaite, Reference Evans and Garthwaite2014; Price & Song, Reference Price and Song2018; Morgan et al., Reference Morgan, Hill, Mooney, Rivara and Rowhani-Rahbar2020). With the exception of Price and Song (Reference Price and Song2018), which examines the impact of an NIT experiment, these papers examine the impact of the federal EITC and state EITCs on parent health. To calculate the present discounted value, we include the non-discounted benefit of the year of the transfer when the parent is 38, using the assumption that a parent is 29 at their child’s birth (based on the mean age of mothers at birth in 2019 according to Vital Statistics (Centers for Disease Control and Prevention, 2021)) and that an average child beneficiary is 9 years old, implying that the average parent in our data is 38 years old. We assume that the benefits extend throughout the remainder of the parent’s life course until age 78. We find that a $1000 increase in household income from a cash transfer improves parent health by between −0.106 and 0.042 % of QALY per year. Individual values for yearly benefit are −$134, $38, $49, and $53. The present discounted value of improved health is $32 on average (individual values are −$3237, $920, $1268, and $1178).
3.6 Parent longevity or mortality
Our extensive literature search yielded one experimental study and one quasi-experimental study examining the relationship between cash transfers and adult longevity: Price and Song (Reference Price and Song2018) and Aizer et al. (Reference Aizer, Eli and Lleras-Muney2020). The search also yielded a very well-done paper that examines the longitudinal relationship between income and adult longevity, Chetty et al. (Reference Chetty, Stepner, Abraham, Lin, Scuderi, Turner, Bergeron and Culter2016). Results from Chetty et al. (Reference Chetty, Stepner, Abraham, Lin, Scuderi, Turner, Bergeron and Culter2016), Price and Song (Reference Price and Song2018), and Aizer et al. (Reference Aizer, Eli and Lleras-Muney2020) imply that the present discounted value of increased longevity is $346 on average (individual values are −$45, $868, and $216) as a result of a $1000 transfer. Adding present discounted values of increased longevity and health yield an increase of $378.
3.7 Avoided health expenditures for parents
To calculate the reduction in health expenditures for parents, we rely on the same methodology and assumptions we used to calculate reductions in health expenditures for children. Based on our findings on healthcare expenditure elasticity, we assume that for 1 % increase in physical health, health expenditures decrease by 0.84 %. To calculate the present discounted value, as we did for the calculation of parent health benefits, we include the non-discounted benefit of the year of the transfer when the parent is 38 and the discounted benefits from ages 39 to 78. Results imply that the present discounted value of decreased healthcare expenditures for parents is on average $2.64 (individual values are $−264, $75, $96, and $104) as a result of a $1000 cash transfer.
3.8 Child welfare
Our literature search yielded one quasi-experimental study examining the relationship between cash transfers and child welfare, Berger et al. (Reference Berger, Font, Slack and Waldfogel2017). The authors examine the impact of EITC benefits on the probability of being investigated by Child Protective Services. Results imply that the present discounted value of lowered child welfare spending is $21 as a result of a $1000 cash transfer.
3.9 Other transfers
We estimate decreases in other transfers by combining quasi-experimental estimates of increased future earnings with the association in current nationally representative data between parents’ earnings and other transfers. Though some studies have attempted to independently estimate causal effects of cash programs on future transfers, the estimates from these studies are less reliable than estimates of increased earnings because receiving transfers is less common than having earnings and more likely to be measured differently in different studies. We find that a $1000 increase in earnings is associated with a $20 decrease in the present discounted value of transfers on average (individual values are −$8, $6, $14, $29, and $57).
3.10 Decreases in crime
We use one study to examine the impact of cash or near-cash transfers on crime reduction (Bailey et al., Reference Bailey, Hoynes, Rossin-Slater and Walker2020). We use Heckman et al. (Reference Heckman, Moon, Pinto, Savelyev and Yavitz2010) and Garcia et al. (Reference García, Heckman, Leaf and Prados2020, Reference García, Bennhoff, Leaf and Heckman2021) to derive the dollar value of the benefit of crime reduction. Note that on average 71 % of crime reduction in the three papers is attributable to reduction in costs to crime victims. We conclude that the present discounted value of decreased crime per $1000 increase in household income per year from a cash transfer is $1746.
3.11 Increased payments due to increases in children’s and parent’s longevity
With the increased children’s and parent’s longevity comes a cost. Two major components of the cost are Social Security and Medicare. We use our estimates of children’s and parent’s longevity along with annual Social Security and Medicare payments according to the Social Security Administration (2019) and Kaiser Family Foundation (2019) for the calculation. We conclude that there would be a $229 and $77 increase in payments due to children’s and parents’ increased longevity, respectively.Footnote 7
3.12 Increased costs due to increased education of children
Six studies (Akee et al., Reference Akee, Copeland, Keeler, Angold and Costello2010; Michelmore, Reference Michelmore2013; Maxfield, Reference Maxfield2015; Aizer et al., Reference Aizer, Eli, Ferrie and Lleras-Muney2016; Bastian & Michelmore, Reference Bastian and Michelmore2018; Thompson, Reference Thompson2019), find that cash or near cash transfers have a positive impact on children’s educational attainment. Since for most of these studies, an average child in the sample has 12 years of education, we regard these increases as increases in postsecondary education. Even though we do not assign separate benefit values for the increased educational attainment due to potential double counting, we do take into account the costs it poses. To calculate such costs, we use the six estimates on increases in children’s educational attainment and the direct and opportunity cost of postsecondary estimated by Abel and Deitz (Reference Abel and Deitz2014). Results indicate that for child beneficiaries, total costs of increased schooling amounts to an average of $302. For taxpayers, total costs of increased schooling amounts to an average of $72.
Table 3 synthesizes the calculations described above and presents mean estimates of the present discounted value of the benefits and costs for one-child, single-parent low-income households per $1000 increase in household income. The long-term benefits to child beneficiaries of the child allowance are substantial. Future earnings increase by $1083 per child per $1000 increase in household income. The biggest improvements are in children’s health and longevity ($2250), representing over twice the initial investment. The long-term health and longevity benefits to a single parent are also substantial, at $378.
Indirect effects on taxpayers are much smaller in magnitude. The biggest benefit – $1746 – comes from reductions in expenditures and victim costs of crime, 71 % of which is attributable to reductions in victim costs rather than reductions in taxes. Increased child earnings lead to increases in taxes they pay and decreases in other transfers they receive that are worth $303 and $20, respectively. Child welfare spending declines by $21. Health care costs decrease by $8 for children, $0.29 for parents, and by $69.35 for taxpayers. On the other hand, increased longevity of both the child and parent increase Social Security and Medicare transfers by more than the increase in taxes paid from increased earnings. Increased schooling of children poses a cost of $72 to taxpayers. And taxpayer costs increase as a result of a decline in parent taxes of $61.
However, the average family today has two children, and slightly more than half of families have two parents. Therefore, the aggregate benefits of a $1000 increase in household income will be greater than that shown in Table 3 for a typical low-income family. On the other hand, the benefits to children and parents in high-income families are likely to be lower than they are for low-income families. We discuss how we handle these issues in the section below.
3.13 How much benefits decline as income increases
If child allowances were extended only to low-income families, the results in Table 3, once increased to adjust for family size, would be near the end of the story. However, child allowances extend to middle- and upper-income families, as well. Therefore, we need to examine the extent to which the benefits of a child allowance differ for families with more income. The more income a family already has, the smaller the likely effect of a given dollar change in income on either child or parent outcomes.Footnote 8 The extent to which child, parent, and social returns to additional income decline with the level of income is an empirical question. Unfortunately, good causal empirical evidence on this rate of decline is practically non-existent. We found only one study that qualifies; we discuss it and its implications next.
Løken et al. (Reference Løken, Mogstad and Wiswall2012) find that a 1-standard-deviation increase in family income generated 0.74 additional years of education for children from low-income families, whereas children from richer families gained as little as 0.05 years of education. They find similar relationships when looking at effects of income increases on the probability of high school dropout and on IQ. Using Norwegian registry data matched with child outcome data, they examine the effects of increased family income in some coastal and near coastal regions of Norway, due to an oil boom in those regions, on these long-term child outcomes. The regions closest to the oil boom experienced the earliest and largest increases in family income, allowing the authors to use a difference-in-differences research design. Importantly for our purposes, the oil boom increased family incomes across the income distribution. The authors find that the effects of a given increase in family income are, as anticipated, greater for children in families with lower initial income.Footnote 9 Their estimates imply that the benefits would begin to decline at roughly $50,000 in family income and decline to zero when family income reaches about $100,000 in 2019 dollars.Footnote 10 We use these figures in our main estimates, while our sensitivity analyses examine higher and lower alternative values for the incomes at which benefits decline and at which they reach 0.
3.14 Micro-simulation estimates
We calculated the cost and distribution of the benefits of a child allowance of $3600 per child ages 0–5 and $3000 per child ages 6–17. We estimated the costs and the distribution of benefits using data from the 2019 Annual Social and Economic Supplement (ASEC) to the Current Population Survey (CPS) (Flood et al., Reference Flood, King, Rodgers, Ruggles and Warren2020). In addition, as the Census Bureau does with their tax calculator (Wheaton & Stevens, Reference Wheaton and Stevens2016), we assume 100 % take-up of the CTC and the simulated reforms. More generally, the methodology used in our micro-simulation, described in Supplementary Appendix 5, is patterned after that used by the Urban Institute for the NAS study on reducing child poverty and that used by the Congressional Budget Office (CBO), and it produces similar results when used to examine the same questions studied by those organizations (results available upon request).
The net cost of the $3600–$3000 child allowance is $96.8 billion. Of that amount, $63.8 billion goes to families with incomes under $50,000, $23.1 billion to families with incomes between $50,000 and $100,000, and $9.8 billion to families with incomes above $100,000.
Supplementary Appendix 5 describes how we estimate the reduction in earnings from the micro-simulation. Accounting for both the share of parents who would stop working and the share who would reduce the number of hours worked, the $3000/$3600 child allowance leads to a reduction in earnings of $11.4 billion.Footnote 11 As described in the section on children’s future taxes, we assume that 21 % of any change in earnings would be paid in federal, state, and local taxes, resulting in an aggregate decrease in taxes of $2.4 billion. The micro-simulation described in Supplementary Appendix 5 also produces estimates of child poverty reduction, one of the most important non-monetary benefits of a child allowance. The $3000/$3600 child allowance is estimated to reduce the child poverty rate by 45 % (Center on Poverty and Social Policy, 2020).
4. Aggregate benefits and costs of converting the tax credit into a near-universal child allowance
In this section, we put together the standardized estimates of benefits and costs per $1000 increase in household income for single child, single parent low-income families with the estimated decline in benefits as income increases, as described above, along with the actual income and numbers of children and parents we have estimated through our micro-simulation model, and obtain national aggregate benefits and costs for a near-universal child allowance of $3600 per child ages 0–5 and $3000 per child ages 6–17.
Moving from the benefits for a one-child, one-parent, low-income family to the benefits to all families with children raises estimation issues. While it is unlikely that fathers derive no health and longevity benefits from an increase in household income, some of our underlying evidence on parents is calculated from literature that limit their samples to mothers. Our main estimates assume that the benefits to a second parent equal zero, which is a conservative assumption. One of our sensitivity tests assumes that both parents in two-parent households derive the same benefits as mothers.
We also need to adjust benefits and costs based on the number of children in a family. A two-child family gets twice as much income from the child allowance as a one-child family, and a three-child family gets three times as much. Transfer costs and benefits increase in tandem. But do the investment benefits of the child allowance double and triple as we go from one to two to three children? Do we need to take account of economies of scale? Do we need to take account of differing dosage responses? Ideally yes, in both cases, but in practice we do not have the data. Making adjustments for economies of scale would be inappropriate given the underlying literature which does not take account of economies of scale. For each of the impacts that we estimate, either we or the authors of the original studies calculate the impacts on a child (or on a parent) per $1000 increase in household income. Assume for the moment that both when the underlying studies were conducted and at present, the average and the distribution of number of children in each household, and economies of scale were identical. In that case, on average, there is no need to adjust for economies of scale as whatever economies were present then are present now. It would be nice to know if the impacts differed by the number of children in the household, but the underlying studies do not tell us this. What we do know, however, is that the number of children per household has been falling over time, which means if we did adjust for a lack of perfect economies of scale in household consumption, the benefits today would be larger than our estimate. Similarly, we cannot make adjustments for dosage responses because the underlying studies provide no data on the issue. Whether that leads to an under or over estimate is not clear.
As estimated in the micro-simulation, the initial cost of the child allowance is $96.8 billion. Of the net initial costs, 66 % of all costs represent payments to families with AGIS below $50,000, 24 % of costs are for payments to families with AGIS between $50,000 to $100,000, and 10 % of costs are for payments to families with AGIS above $100,000. We allocate full investment returns for families with incomes below $50,000, a linearly decreasing set of returns, falling from full to zero, for families with incomes between $50,000 and $100,000, and zero returns for families with incomes above $100,000.
Finally, we need to take into account the effects of financing the child allowance on family income. To simplify the analysis, we assume that the child allowance is financed by taxes only on the incomes of families with incomes above $100,000. This simplification is consistent with, but less stringent than, President Biden’s commitment to fund his proposals with increased taxes only on families with incomes above $400,000. In a sensitivity analysis, we illustrate the effects of an alternative financing method that substantially reduces the family income gains from the child allowance for low-income families.
Table 4 presents aggregate estimates of the annual benefits and costs of $3000/$3600 child allowance. Aggregate costs are approximately $97 billion. Children’s future earnings in adulthood increase by $202 billion, approximately 2.08 times the initial expenditure of $97 billion. As a consequence of the huge increase in earnings, $57 billion is recouped by taxpayers in the form of higher tax payments from these higher earnings. The biggest single benefit to children and society as a whole come from the substantial increases in children’s health and longevity – valued at $420 billion. Considered as a health investment alone, this child allowance is a remarkably good investment. These improvements in children’s and parents’ health, in return, also result in taxpayer savings of $13.18 billion in public health care costs, around $4.39 billion of which is savings in health insurance premiums. The gains to taxpayers from reductions in expenditures and victim costs of crime are also very large – $326 billion, only $68 billion of which are reductions in taxes (21 % of $326 billion). Taxpayers also experience gains of $4 billion from avoided expenditures on child protective services. Because children get more years of schooling, children, taxpayers, and society as a whole incur greater education costs of $56 billion, $14 billion, and $70 billion respectively. Because children and their parents live longer, taxpayers also incur an additional cost of $49 billion in increased Medicare and Social Security benefit payments, which is offset by benefits to those who live longer. The present discounted value of benefits for society equals $929 billion, nearly 10 times the initial costs. Taxpayers enjoy long-term savings of $243 billion.
Table 4. Aggregate annual benefits and costs of a $3000/$3600 child allowance: Present discounted value using mean impact estimates (in $billions).
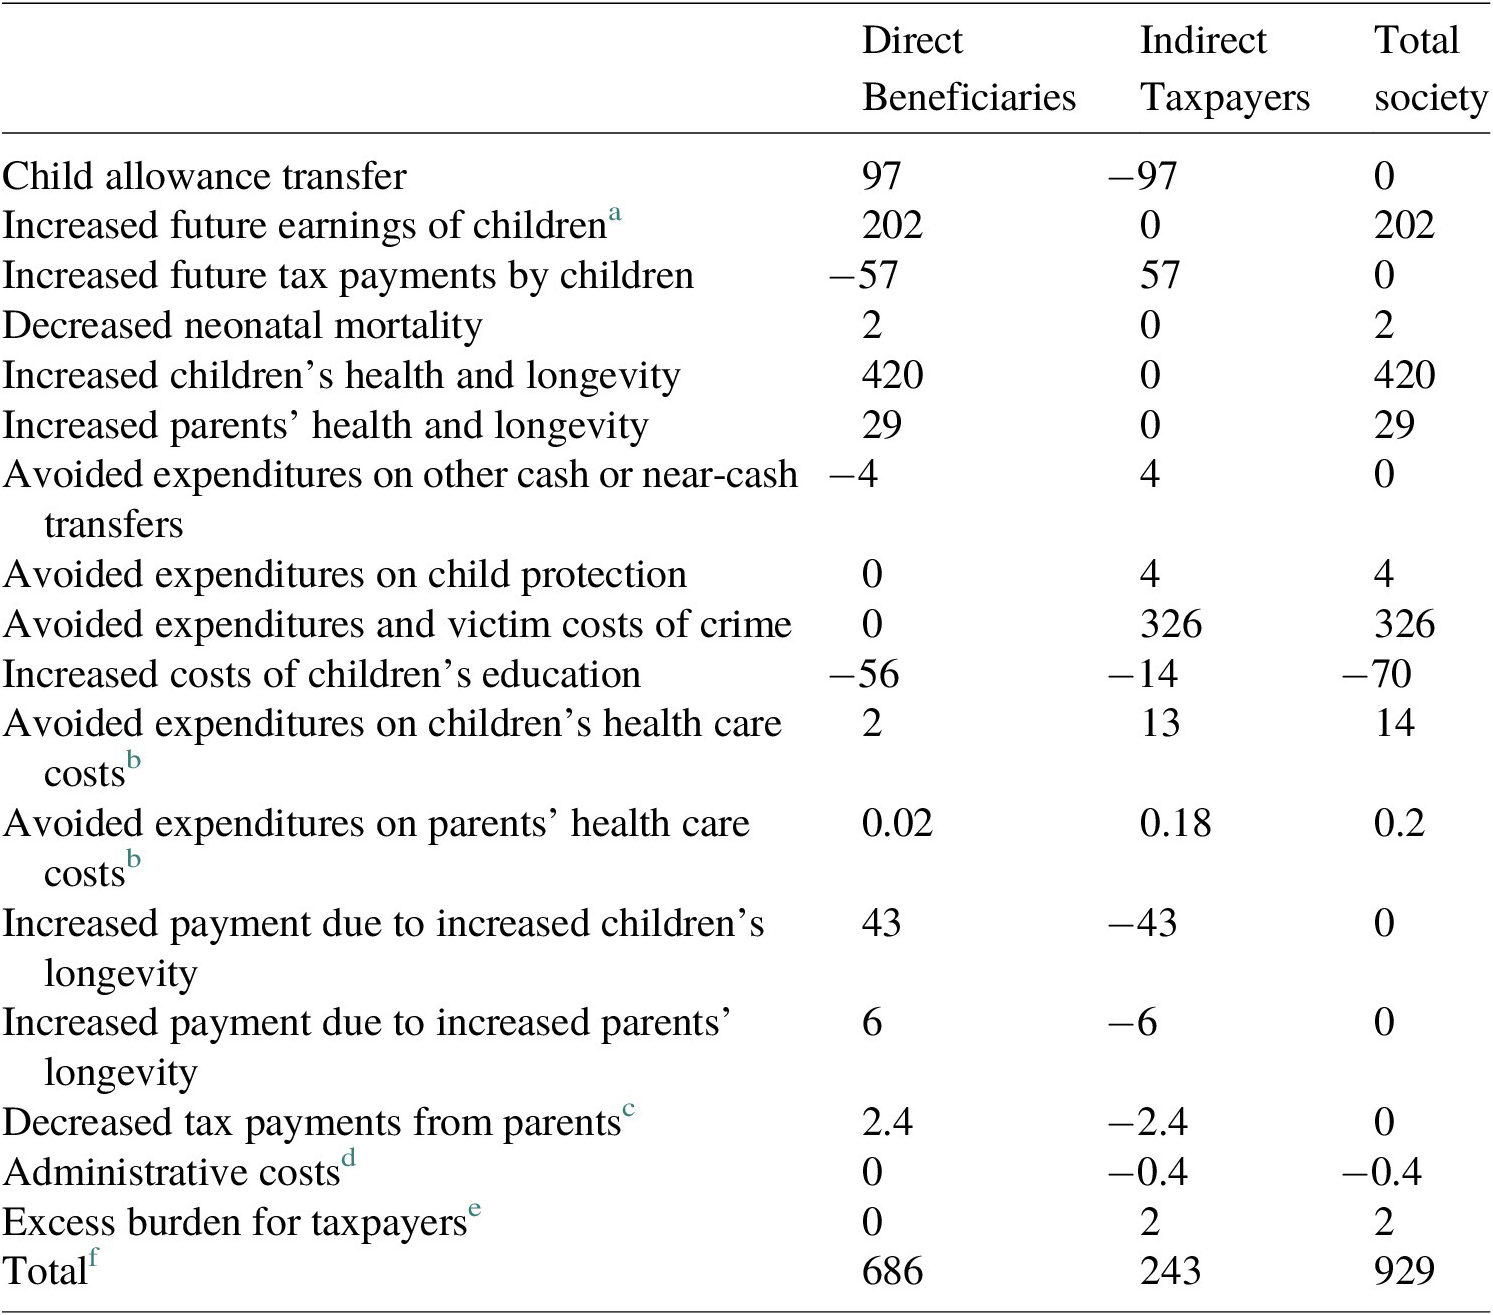
a Future earnings are valued at 75 % of the face value ($1444). This is because some increases in earnings come from increased hours, and our upper bound estimate (to be conservative) is 25 %. To be conservative, we assume the recipient gets no surplus from increased earnings that come through additional hours.
b Reductions in health care expenditures reduce both out-of-pocket costs to beneficiaries and public and private insurance costs to taxpayers. Out-of-pocket medical expenditures are about 11 % of national health expenditures in 2019 (Centers for Medicare & Medicaid Services, 2019). We allocate 11 % of the reduced health care costs to beneficiaries and 89 % of the costs to taxpayers at large in the form of reduced taxes and insurance premiums.
c Details on how we estimated decrease in parent tax is included in Supplementary Appendix A5.I.c.
d Based on administrative costs of Social Security benefits, we set administrative costs to 0.4 % of costs of the allowance.
e Excess burden is assumed to be equal to 40 % of the net increase or decrease in the present discounted value of taxes. Neither decreases in victim costs nor reductions in health insurance premiums, 71 and 33 % respectively of total taxpayer benefits are counted in the calculation of excess burden.
f The number for the total may not be exactly the sum of the numbers in the columns due to rounding.
5. Sensitivity analyses
Our estimates of the benefits and costs of a child allowance indicate that the initial cost of $97 billion to implement the $3000/$3600 child allowance will generate social benefits of $929.2 billion. In other words, we estimate that relative to other potential uses of GDP, this child allowance is a remarkably good investment in our nation’s future. As described above, however, translating the estimates of the impacts of cash and near-cash transfers into estimates of aggregate benefits and costs requires a number of choices or assumptions. In this section, we examine the sensitivity of our results to alternative assumptions and to two alternative ways of structuring a child allowance.
The top panel of Table 5 examines alternative assumptions in our calculations one at a time. Each row presents the results of one deviation from our baseline assumptions. We order the results by lowest to highest upper range of estimated social benefits, that is, in ascending magnitudes according to the assumptions’ influence on total impacts. The first row shows that the standard range for estimating the ratio of excess burden bears little weight in the final calculation of social benefit. In the second row, we show that the result when using our lower bound assumption that only one parent benefits per family (also our central assumption in our main estimates) only differs by $10 billion from including equal benefits for coparents where present, which is a 1 % difference. Our range of health expenditure elasticities taken from the literature spans from 0.19 to 1.48, which also only generates about a 1 % difference from the central estimate based on the average of the two. We follow a conservative choice in only counting 75 % of future earnings as a direct benefit from higher wages (assuming 25 % from increased work hours are completely offset by the opportunity cost of time), again using the lower bound as our central estimate assumption, which contrasts to a net social benefit of $996.6 billion if we were to count 100 % of future earnings.
Table 5. Sensitivity analysis results (in $billions).
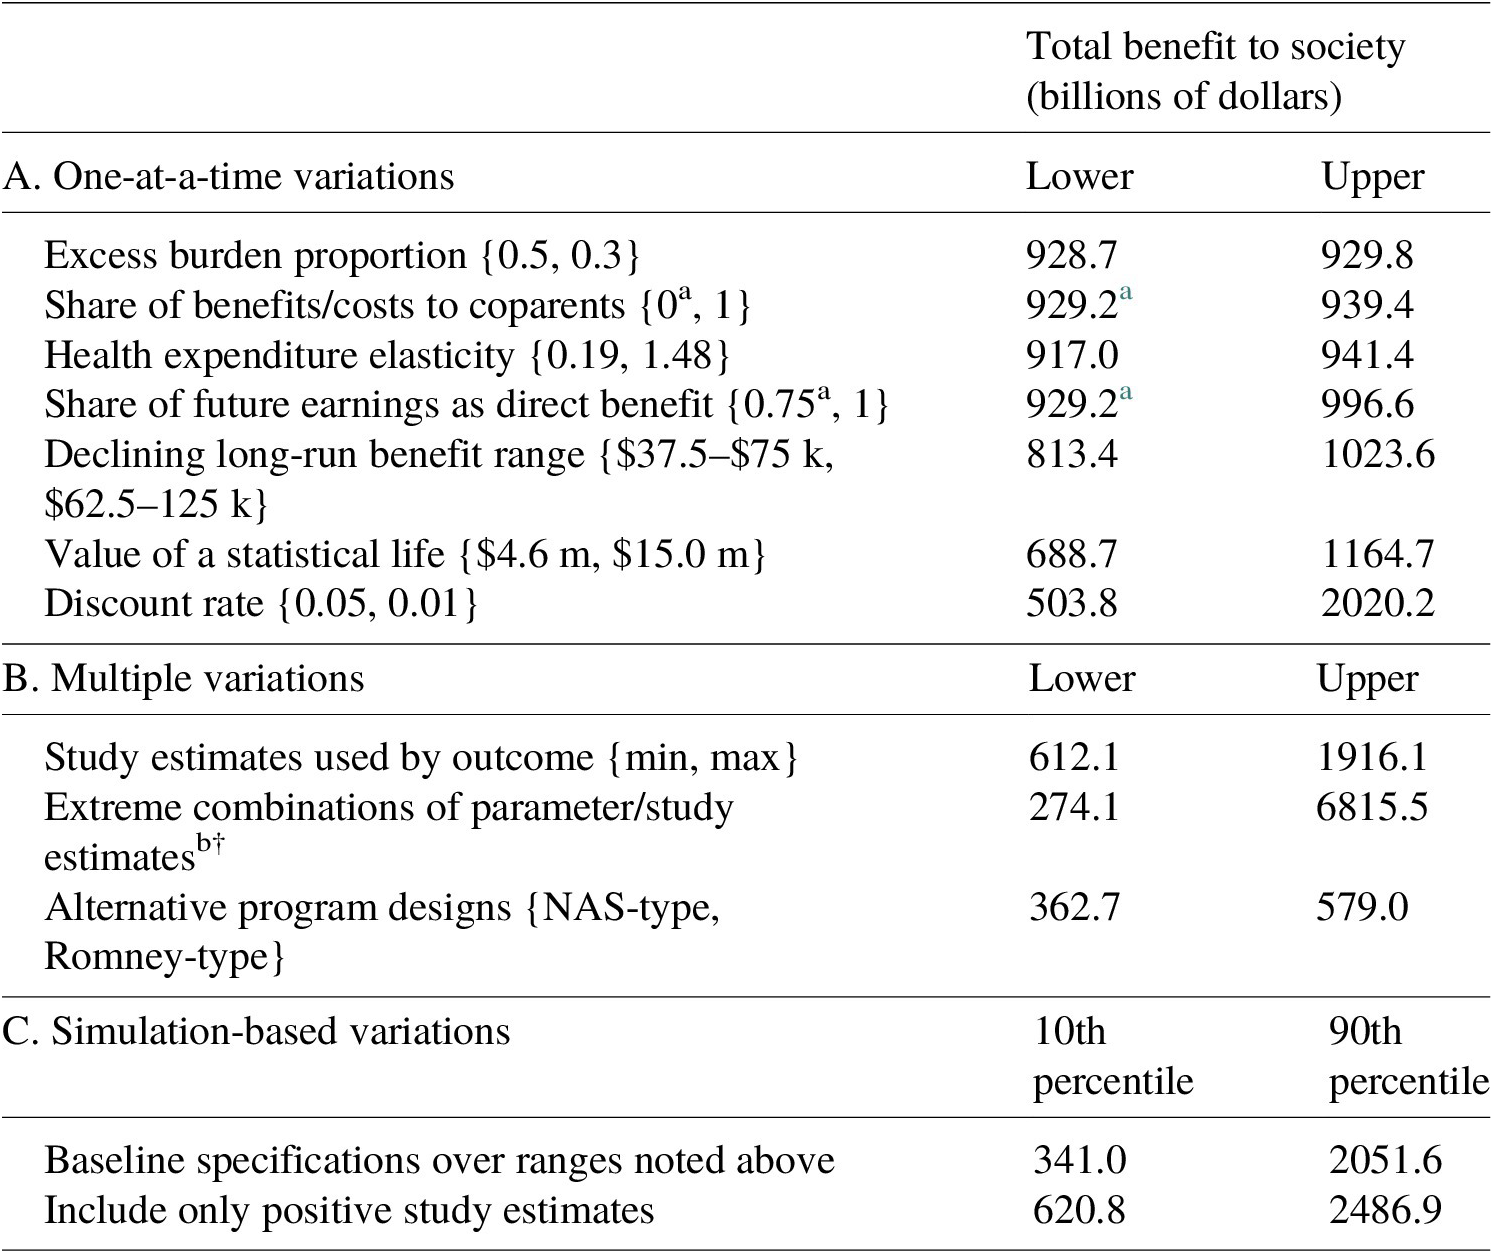
Note: NAS-type estimates correspond to $2000 child allowance financed by taxes on families with incomes over $100,000, and the Romney-type estimates correspond to $4200 per child aged 0–5 and $3000 per child aged 6–17 financed with offsetting benefits from transfer programs and EITC child benefits. Simulation-based variations report the 10th and 90th percentiles of results based on 1,000,000 replications randomly sampling across parameter ranges and study estimates.
a Denoted estimates correspond to our baseline specification as reported in Table 4.
b Extreme combinations include the parameter choices in panel A corresponding to the lower range of estimates as well as the minimum positive estimates from the literature by outcome.
The last three rows of panel A begin testing more sensitive parameter choices. In our central estimates, we assume that long-run returns to the transfer decline linearly as household incomes rise from $50,000 to $100,000, such that children from higher-income households (above $100,000) have future outcomes unchanged by a child allowance when young. If the returns to transfers decline more steeply, beginning to fade at household income above $37,500 and disappearing for households above $75,000, then our estimate of the net social benefit would drop to $813.4 billion; and, if returns decline less steeply then social benefits increase to $1023.6 billion. The choice of long-run benefit returns accounts for possible differences of around 12 % of our central estimate. Our VSL assumptions are based on the suggested range of estimates in Robinson and Hammitt (Reference Robinson and Hammitt2016), which we update to 2019 dollars so that they range $4.6 million to $15.0 million. This range of VSL estimates generates an approximately 25 % difference from our central estimate for the net social benefit, ranging from $688.7 billion at the lower range to an upper estimate of $1164.7 billion. (If, by contrast, we were to follow Hendren & Sprung-Keyser, Reference Hendren and Sprung-Keyser2020 and value health and life at only one-tenth of standard values, benefits as a whole to society would decline to $524 billion.) Lastly, the most substantial assumption is the social discount rate, which we center at 3 % within a standard range from 5 to 1 %. A discount rate of 5 % would lead to social benefits of $503.8 billion, whereas a 1 % discount rate implies a net social benefit more than double our preferred estimate.
Panel B of Table 5 explores sensitivity estimates that allow multiple variations. First, we recalculate the net social benefit using only the minimum positive study estimates by outcome (excluding the outlier negative estimates of long-run cash transfer effects). Second, we contrast these with estimates using the maximum study estimates by outcome. Using only the minimum positive studies would decrease our social benefit estimate by about 34 % and using only the maximum studies would double our social benefit estimate. If we further assume the minimum or maximum parameter choices as shown in panel A, the lower range of social benefit falls to $274.1 billion with an upper range as high as $6815.5 billion.
Another variation on our main analysis is to reconsider the policy design of a child allowance in terms of both benefit levels and financing. In the last row of panel B, we examine the social benefits of a less generous child allowance of $2000 per child taken from the NAS Report: A Roadmap to Reducing Child Poverty (with assumed financing by income taxes on incomes over $100,000, as in the baseline analysis) contrasted with a slightly more generous child allowance of $4200 per child 0–5 and $3000 per child 6–17 as proposed by Senator Romney with financing largely by reducing or eliminating benefits for low-income families with children, including eliminating the child benefit in the EITC and eliminating TANF.Footnote 12 We estimate that the $2000 NAS-type child allowance generates net social benefits of $362.7 billion, while the $3000/$4200 Romney-type proposal generates social benefits of $579.0 billion. All three child allowances, including both of these alternative program designs and our main ARP-type design, generate substantial benefits well in excess of costs. Even though the $3000/$4200 Romney-type child allowance benefit levels are the highest, they generate lower social benefits than the $3000/$3600 child allowance because the financing reduces the net benefit gain to low-income families.
For a more careful exploration of combinations of parameter and study choices, we conduct a Monte Carlo analysis based on the ranges of parameter choices shown in panel A of Table 5 and the ranges of study estimates by outcome. Panel C shows the 10th and 90th percentiles of 1,000,000 replications that randomly draw from a uniform distribution of each parameter range and randomly select one study estimate to use for each outcome. The 10th percentile estimate of the net social benefit is $341.0 billion, and the 90th percentile estimate is $2051.6 billion, a range that includes all of the variations in panel A. If we repeat the Monte Carlo exercise using only positive study estimates (assuming that additional income in childhood has non-negative effects on children’s long-run outcomes and treating the 1 negative study out of 21 as an outlier), then we find that 80 % of random variations fall between the 10th percentile of $620.8 billion net social benefit and the 90th percentile of $2486.9 billion.
In Figure 1, we show a histogram of the results from 1,000,000 randomizations across our baseline parameter ranges and all study estimates used in the main analysis. Half of the estimates fall between $562 billion and $1416 billion, and the expected value across all combinations is $1075 billion, a net social benefit about 15 % higher than our central estimate of $929 billion. The distribution of potential social benefits has a long right tail extending to around $6 trillion, and less than 1 % of the results are negative, with around 2.3 % of results less than the initial outlay of $97 billion. (The data exhibit a positive skewness of 1.35, a stronger tendency toward high net social benefits.) Note that these random draws assume equal weight to each study, including the negative results found by Price and Song (Reference Price and Song2018), and assume equal weight across each range of parameter choices based on a uniform distribution. If we were to place more weight toward the center of our parameter value ranges, for example by treating the range of values from which we draw as normally distributed and truncated within the maximum and minimum parameters, we would see a greater skewness toward larger net social benefits.Footnote 13 In short, results in Table 5 and Figure 1 demonstrate that although there is a fair range of uncertainty about precisely how good an investment the $3000/$3600 child allowance is, the most plausible estimates range from it being a very good investment to an extraordinarily good investment in our nation’s future.

Figure 1. Histogram of simulation-based sensitivity estimates by parameter choices and study estimates. Estimates are based on 1,000,000 replications that vary by parameter choices given the ranges represented in Table 5 as well as the study estimates from the literature when more than one study is used for a given outcome.
6. Discussion
Our baseline estimates suggest that making the Child Tax Credit fully refundable and increasing its generosity is a remarkably good investment. The cost of the $3000/$3600 child allowance is $97 billion per year and our best estimate of the total benefit for society is $929 billion per year.
While the return on government expenditure is quite high, it is in the same ballpark as estimates derived from the canonical literature on public investment in children.
Recent literature on program evaluation has debated the relative merits of Benefit Cost Analysis (BCA) and the Marginal Value of Public Funds (MVPF) approaches to valuing the social value of a policy reform (see Hendren & Sprung-Keyser, Reference Hendren and Sprung-Keyser2020; García & Heckman, Reference García and Heckman2022; Hendren & Sprung-Keyser, Reference Hendren and Sprung-Keyser2022). While a full discussion of this topic is beyond the scope of this article, we note that the MVPF of the child allowance is extremely large, indeed “infinite” as defined by Hendren and Sprung-Keyser. Essentially, there is no cost to the government because the fiscal externalities associated with a child allowance sum up to a net benefit, not a cost, and the net positive fiscal externality exceeds the total cost to government. Therefore, the denominator for calculating the MVPF (government cost plus fiscal externality) implies that this statistic is undefined in this case, or that the marginal value of publicly funding a child allowance is arbitrarily large, or “infinite” as termed by Hendren and Sprung-Keyser.Footnote 14
One major source of public investment in lower-income children is through health care, and a primary method for doing so is to expand the availability of public health insurance. In Janet Currie and Jonathan Gruber’s canonical 1996 paper “Saving Babies: The Efficacy and Cost of Recent Changes in the Medicaid Eligibility of Pregnant Women,” the authors examined the effects of Medicaid expansion on infant mortality and found that each $1.9 million (in 2019 dollars) spent on expansion saved one infant life. Given the value of a statistical life (VSL) described in this article, the return on government expenditure of this policy, were this the only benefit of Medicaid expansion, would be over five to one. Of course, the authors themselves find in a related paper (Currie & Gruber, Reference Currie and Gruber1996) that there are also benefits of Medicaid expansion for other child outcomes, suggesting that a comprehensive benefit-cost analysis would raise this return still higher. Another major source of public investment in lower-income children is education. Estimates of the return to an additional year of schooling range from 7.2 % (Angrist & Krueger, Reference Angrist and Krueger1991) to 26 % (Jepsen et al., Reference Jepsen, Troske and Coomes2014), with returns rising in more recent years (Katz & Autor, Reference Katz, Autor, Ashenfelter and Card1999). Given an average expenditure of about $12,000 per student per year on K-12 education (U.S. Census Bureau, 2021), the opportunity cost of an additional year of education valued using earnings of a full-time minimum wage worker, an employment-to-population ratio of about 62 % (Bureau of Labor Statistics 2020), and mean earnings per worker of about $53,000 per year over 40 years (Social Security Administration 2020), discounted at a 3 % rate, the return on government expenditure of K-12 investment would be between 4 and 10 to 1. Again, this estimate focuses on a single outcome, earnings, which suggests that a comprehensive benefit-cost analysis would raise this return still higher. Finally, the benefit-cost analysis by Heckman et al. (Reference Heckman, Moon, Pinto, Savelyev and Yavitz2010) found social benefits of Perry Pre-School to be seven times the fiscal costs. These results indicate the high returns that previous efforts to increase investment in lower-income children have shown. In this context, large returns from a child allowance are plausible.
What is surprising is that cash transfers generate returns that may be as large as investments in health and education. The standard model assumes implicitly that a transfer of $1 is worth $1 to recipients and $1 to taxpayers. We now have strong empirical evidence from 20 of 21 studies that a $1 transfer is worth more than $1 to low-income recipients and some empirical evidence from Norway that the loss of $1 to high-income taxpayers may be no greater than $1. Cash and near-cash transfers not only affect consumption but also serve as an investment in the human capital of children and of parents with regard to their health, which we now know yields positive returns to society. The increase in parent health is likely due to decreases in economic insecurity, which reduce stress and psychological burden. (Rosenblum & Paully, Reference Rosenblum and Paully1984; Lee et al., Reference Lee, Brooks-Gunn, McLanahan, Notterman and Garfinkel2013; Sendhil & Shafir, Reference Sendhil and Shafir2014; Garfinkel et al., Reference Garfinkel, McLanahan and Wimer2016). We further hypothesize that the increase in the human capital of the children is primarily due to changes in parenting and family contexts that result from reductions in stress and the psychological burdens of scarcity. Whatever the mechanisms, the empirical evidence indicates the benefits of increased income are large. We believe these returns remain unrealized in the absence of government intervention because of the credit constraints faced by lower-income families.Footnote 15
Our study entails some important limitations. The most serious is that we have made no attempt to estimate dose response by age or by the generosity of program. A few of the underlying studies found no benefits for older age children, but one did (Bastian & Michelmore, Reference Bastian and Michelmore2018). Increasing allowances from zero to $1000 per child must produce greater benefits than increasing allowances from $4000 to $5000. Future research should address these dose issues.
Another serious limitation is the paucity of evidence on the degree to which the benefits of an increase in household income decline as income increases. The only quasi-experimental study we could find (Løken et al., Reference Løken, Mogstad and Wiswall2012) is based on the effect of a Norwegian oil boom on Norwegian children. Norway is a far more homogenous and egalitarian country than the USA, with a much different constellation of social policy supports to families with children, so the gradient of effect sizes could easily differ. This relationship is central to the debate about the degree to which benefits should be targeted to lower-income families, and more research on this topic is of the highest priority.Footnote 16
Also of high priority is research on the effects of transfers on the health and longevity of parents, and particularly on fathers. We found much more research on the effect of cash transfers on the long-term outcomes of children than on the outcomes of parents. There are a few potential benefits of the child allowance that were not included in our analysis due to lack of quasi-experimental literature, such as decreased domestic violence and reduced expenditures on special education. Further research is needed to examine the impact of cash and near-cash transfers on these benefits.
We also did not take account of any increases in fertility based on the assessment of the NAS report: A Roadmap to Reducing Child Poverty that research found small and/or statistically insignificant impacts (cite). But a recent paper reports larger effects of a one-time maternity allowance in Spain (González & Trommlerová, Reference González and Trommlerová2021). As further new evidence emerges this is a potential topic for future research to explore.
We found only one study on the direct effects of cash payments on health care costs and limited research on the relationship of health status to health care costs. The degree to which improvements in health translate into declines in health expenditures plays a critical role in determining the degree to which taxpayers benefit from cash transfers. Rigorous research on this point would improve the precision of the estimates that we provide here, and this relationship should be an important area for future research. Finally, we made no attempt to correct for publication bias because many of the studies we have included have multiple outcomes, not all of the multiple outcomes are statistically significant, and indeed some are negative.
Our baseline estimates suggest that making the Child Tax Credit fully refundable and increasing its generosity is a remarkably good investment. We also conducted several sensitivity analyses. The sensitivity analyses indicate that there is a fair range of uncertainty about precisely how good an investment a child allowance represents. But in the current context, with the real social discount rate being closer to 1 than 3 %, the most plausible estimates range from a child allowance being a very good to being an extraordinarily good investment in our nation’s future.
Supplementary Material
To view supplementary material for this article, please visit http://doi.org/10.1017/bca.2022.15.
Competing Interests
The authors declare none.


 Open access