


1. Introduction
In most jurisdictions of the United States, land use policy is made at the local level within the context of existing federal and state regulations. County and city government officials scrutinize developers’ requests for zoning variations and building permits. Local officials make their decisions under two potentially conflicting objectives. First, they are concerned with providing adequate financing for their jurisdiction, which can be accomplished by increasing the extent of developed land and improving their real estate tax base. Second, they are charged with meeting environmental quality objectives, which sometimes requires the preservation of land in an undeveloped state.
A community makes a statement about the environmental objective when its zoning ordinance requires new residential subdivisions and major redevelopments to have a minimum proportion of preserved open space. A private land developer may choose to just meet the minimum requirement or set aside even more open space depending on the current market demands. The resulting subdivision design could provide a better environmental outcome, and a developer may further enhance the sales revenue. A key is gaining knowledge of how home buyers value open space within the context of the local environmental setting. This situation is more critical in coastal areas because they attract an ever-increasing population: 52% of the nation's total population lived in coastal watershed counties during the most recent U.S. Census in 2010, for a 45% increase from 1970 to 2010 (National Oceanic and Atmospheric Administration, 2013).
McConnell and Walls (Reference McConnell and Walls2005) reviewed more than 60 published articles that have attempted to estimate the value of open spaces in the categories of parks, greenbelts, forest preserves, wetlands, and so forth. There is growing empirical evidence that undeveloped land generates environmental amenities for the larger community (Bolitzer and Netusil, Reference Bolitzer and Netusil2000; Correll, Lillydahl, and Singell, Reference Correll, Lillydahl and Singell1978; Geoghagen, Reference Geoghegan2002; Irwin, Reference Irwin2002; Lutzenhiser and Netusil, Reference Lutzenhiser and Netusil2001). There is also evidence that the presence of open space, especially open space that has been permanently preserved, increases neighboring residential property values (Cheshire and Sheppard, Reference Cheshire and Sheppard1995; Geoghegan, Reference Geoghegan2002; Geoghegan, Lynch, and Bucholtz, Reference Geoghegan, Lynch and Bucholtz2003; Geoghegan, Wainger, and Bockstael, Reference Geoghegan, Wainger and Bockstael1997; Hardie, Lichtenberg, and Nickerson, Reference Hardie, Lichtenberg and Nickerson2007; Irwin, Reference Irwin2002; Thorsnes, Reference Thorsnes2002; Tyrväinen and Miettinen, Reference Tyrväinen and Miettinen2000; Wu, Adams, and Plantinga, Reference Wu, Adams and Plantinga2004). Previous studies have also focused on the size, type, shape, and proximity to a wetland in their hedonic property value studies. The findings vary depending on whether the wetland is located in urban or suburban or rural areas (Doss and Taff, Reference Doss and Taff1996; Mahan, Polasky, and Adams, Reference Mahan, Polasky and Adams2000).
On tidal landscapes along a coast, open space can exist in the form of land set aside by a developer (e.g., parks, playgrounds, etc.), and it also can exist as marshland and associated tidal features. The principle objective of this study is to examine how either type of open space affects property prices by analyzing property transaction data from Chatham County, Georgia (which includes the city of Savannah) in a hedonic price framework. If home buyers place a high value on additional open space in the form of set-aside land, then developers would have an incentive for employing more of this design feature in their development projects. Also, if a nearby marshland adds value to property prices, then there is a strong reason to preserve such marshlands because enhanced property values could translate into higher revenues for developers and local government.Footnote 1 Though focused on Chatham County, Georgia, the results of this analysis are relevant to other real estate markets associated with tidal marshlands. Along the Atlantic coast, major cities including Wilmington, North Carolina; Charleston, South Carolina; and Jacksonville, Florida, all have residential housing alongside marshlands.
In a competitive housing market, the home buyers bid up properties with desirable surroundings. A lack of open space may not be desirable because it leads to more impervious surfaces in neighborhoods, which in turn impede local water quality through runoff. Storm-water runoff from urban areas is a significant source of water pollution in the United States. Also, ambient water quality can significantly influence residential property values (Poor, Pessagno, and Paul, Reference Poor, Pessagno and Paul2007). Therefore, many states are promoting low-impact development practices including planned open space (Mazzotta, Besedin, and Speers, Reference Mazzotta, Besedin and Speers2014). In following this practice, developers may also decrease their construction costs by reducing paved roads and clustering homes in designated areas of a subdivision (Mohamed, Reference Mohamed2006). Similarly, local governments and service agencies may realize lower expenditures associated with lower infrastructure requirements. Incorporating open space into the design of residential areas may well represent a win-win situation for developers, local governments, homeowners, and the community at large, allowing a new balance to be struck between residential land and open space.
The remainder of the article is organized as follows. In Section 2, the previous literature on open space and its valuation are discussed. Section 3 illustrates the methods that include study area, econometric model, and data employed. The results are discussed in Section 4. Section 5 provides estimated impacts of development alternatives for a representative residential subdivision in coastal Georgia, and Section 6 concludes the article.
2. Previous Research
Empirical studies of the value of open space in the United States date back to the 1960s. For example, Kitchen and Hendon (Reference Kitchen and Hendon1967) examined the correlation between a parcel's proximity to open space and both its assessed land value and sale price. That study found a small, negative correlation between a parcel's distance from a neighborhood park in Lubbock, Texas, and its assessed land value. The study did not account for house characteristics, and that likely explains the lack of correlation between distance from the park and house prices.
In the recent years, richer data sets have been used in the open space valuation literature. Bolitzer and Netusil (Reference Bolitzer and Netusil2000) in their study differentiated between types of open space: public parks, private parks, cemeteries, and golf courses. Their initial model, estimated with data from Portland, Oregon, included a dummy variable representing homes within 1,500 feet of any type of open space and found a positive price premium associated with these homes. When they included separate dummy variables for the four types of open space, they found a statistically significant premium associated with public parks and golf courses, but not with cemeteries and private parks.
Lutzehiser and Netusil (Reference Lutzenhiser and Netusil2001) extended the Bolitzer and Netusil study by further distinguishing between urban parks, where more than 50% of the area was developed for recreation, and natural parks, where more than 50% of the area was preserved in native vegetation. They found that natural area parks generated a higher price premium than urban parks. They also incorporated a series of dummy variables representing discrete distances from open space. Their results indicated that houses closest to natural parks realized the largest price premium.
In suburban Washington, D.C., and Baltimore, Maryland, Geoghegan (Reference Geoghegan2002) estimated a hedonic model that distinguished between permanent open space (parks and conservation easements) and developable open space (private forest and agricultural land). She found that houses near permanent open space sold for significantly more (up to $1,106 for a 1% increase in open space surrounding a house) than those near developable open space.
Irwin (Reference Irwin2002), also in the Washington, D.C.–Baltimore metropolitan area, divided open space into finer categories. The estimated hedonic model revealed that privately owned conservation land offered the highest price premium, followed by publicly owned land, nonmilitary land, then pasture land, and finally private forested land. Thorsnes (Reference Thorsnes2002) also found a significant premium associated with a home's proximity to permanently preserved forested land in Grand Rapids, Michigan. The premium ranged from $5,800 to $8,400, which is equivalent to 2.9% to 6.8% of the house price.
A number of other studies have shown that open space in the form of wetlands has a significant and positive impact on housing prices (Doss and Taff, Reference Doss and Taff1996; Mahan, Polasky, and Adams, Reference Mahan, Polasky and Adams2000). For example, Doss and Taff (Reference Doss and Taff1996) use the data from Ramsey County, Minnesota, and show that wetlands in the form of open water, emergent vegetation, and scrub-shrub provide value in suburban areas. The marginal value of an open-water wetland was 1.9% (as a percentage of mean house price), emergent vegetation was 2.6%, and the scrub-shrub wetland was 2.8%. Similarly, Mahan, Polasky, and Adams (Reference Mahan, Polasky and Adams2000) show that larger and closer wetlands add value to the property prices in their study of the Portland, Oregon, housing market. Both authors estimate the marginal value of increasing the nearest wetland size by 1 acre to be approximately $24 (evaluated at the mean house price).
Geoghegan, Lynch, and Bucholtz (Reference Geoghegan, Lynch and Bucholtz2003) found that preserved open space increased property values in two of the three examined counties in Maryland. Using simulations based on their spatial econometric model, they estimated that increasing open space by at least 1% could generate sufficient property tax revenue to finance additional purchases by a land conservation program.
An analysis by Hardie, Lichtenberg, and Nickerson (Reference Hardie, Lichtenberg and Nickerson2007) in suburban single-family residential subdivisions in the Washington, D.C.–Baltimore corridor looked at the effects of zoning and conservation requirements. They found evidence of crowding out of open space because of forest conservation requirements and minimum lot size zoning. Their empirical results also indicated that developers were not influenced by the presence of open space outside of each subdivision, suggesting that developers act to internalize open space amenities rather than attempting to free ride on their neighbors.
In a study of suburban Maryland by Kopits, McConnell, and Walls (Reference Kopits, McConnell and Walls2007), a hedonic analysis examined whether developers have a market incentive to provide clustered subdivisions in the absence of county land use regulations. This incentive could exist if home buyers place a higher value on planned open space than on residential parcel size. However, they found this not to be the case; that is, home buyers placed such a high value on their lot sizes that subdivision developers could not recoup the lost revenue from land that was diverted from additional houses into more open space. The authors noted that their result might have been unique to the Washington, D.C.–Baltimore metropolitan area.
This study investigates a similar question of how home buyers value nearby open spaces, in particular open space set aside by developers and open space in the form of marshland and related features in a tidal environment. It also investigates the trade-offs between two critical neighborhood design features, parcel size and planned open space, and how they are likely to affect developers’ gross revenues for a real estate market in coastal Georgia.
3. Methods
3.1. Study Area
Our study area is Chatham County, located in the U.S. state of Georgia (Figure 1). Chatham County is the fifth most populous county in Georgia (the most populous Georgia county outside the Atlanta metropolitan area) and is one of the six coastal countiesFootnote 2 in Georgia. By 2030, this part of Georgia's population is expected to increase by 51% over the 2000 population (Ross et al., Reference Ross, Barringer, Benjamin, Foard, Leone de Nie, Pierce, Vargo, Boston and Wilkins2006). With this population growth will come more development pressure on the land and its interface with the tidal marshlands. The study of Chatham County is appropriate and timely because of the county's marshland environment and can contribute better information that could result in more desirable residential communities in the future.
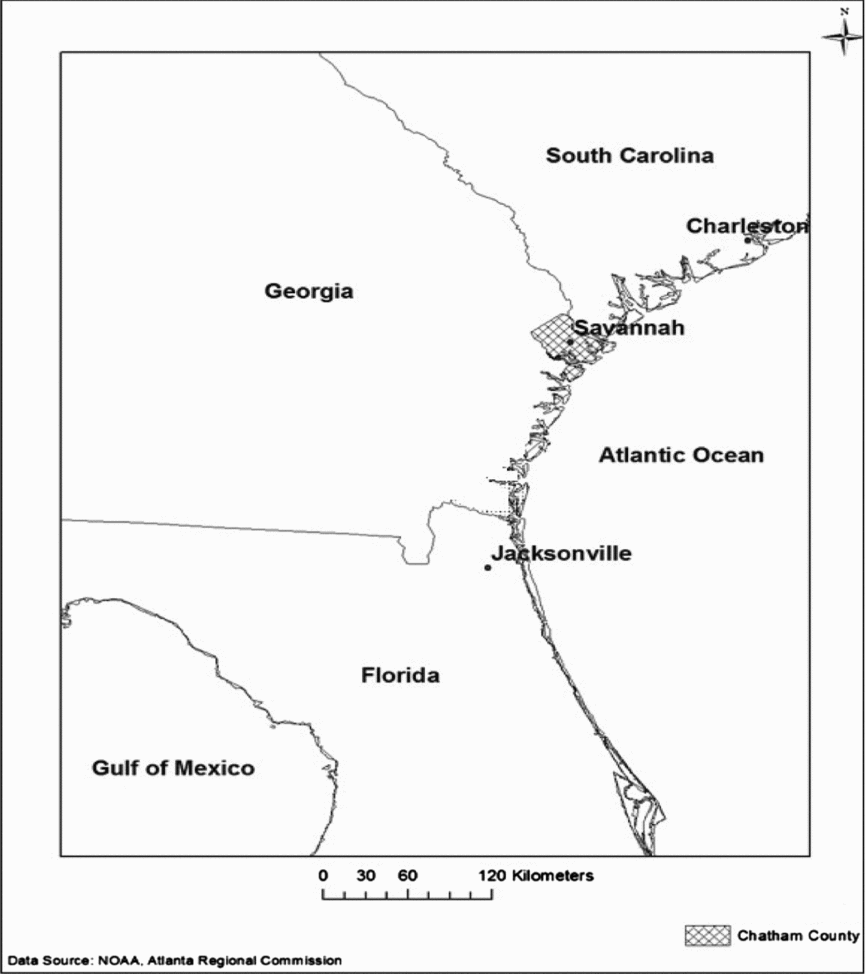
Figure 1. Map Showing the Study Area
Although Chatham County is on the coast, only a small part of it contains beachfront properties facing the Atlantic. These residential properties are restricted to a 2.8-mile section on the small barrier island of Tybee, accessed via a 15-mile causeway across the marshlands from other populated parts of the county. It effectively constitutes an isolated, separate real estate market that is excluded from this analysis of marshland environment properties. The county has six other barrier islands, but they have no road access, are mainly owned by the federal or state government, and are not developed.
3.2. Econometric Model
Since the seminal work of Rosen (Reference Rosen1974), numerous studies have used hedonic price models to estimate the contribution of different attributes of a property (structural, neighborhood, and environmental) to its value as measured by its sale price. In this article, we employ a standard hedonic price model in which we define the price of a property h, denoted by Ph , as a function of its structural attributes (Sh ), neighborhood and location attributes (Nh ), and environmental amenities (Eh ) as follows: Ph = f (Sh , Nh , Eh ). The differentiation of the hedonic price function (Ph ) with respect to a particular attribute yields the marginal implicit price of that attribute, the change in the amount an individual is willing to pay for a small change in an attribute, holding all other attributes constant.
One of the econometric issues shared by most hedonic price studies concerns the potential spatial dependence of the observations. Neighboring parcels commonly share similar structural characteristics because of contemporaneous construction, neighborhood effects, and other similarities that lead to spatial dependence. Failing to correct for spatial relationships could result in inconsistent or inefficient parameters (Anselin and Bera, Reference Anselin and Bera1998). The presence of spatial dependence can be detected by maximum likelihood estimation of alternative models and applying appropriate Lagrange multiplier tests. Alternatively, one can test the significance of Moran's I spatial autocorrelation coefficient estimated from the ordinary least squares residuals. Both approaches require a spatial weights matrix to be specified.
Weight matrices are used to model the spatial relation between observations. The conceptualization of the spatial relationship prior to analysis is very important (Anselin, Le Gallo, and Jayet, Reference Anselin, Le Gallo, Jayet, Mátyás and Sevestre2008). A commonly used weights matrix (W) has a binary specification, where for each element of matrix W, Wij = 1 for neighboring parcels i and j if they share a common boundary, and it is zero otherwise. This matrix type assumes that spatial autocorrelation in the region under study only occurs between the nearest neighboring spatial units, an assumption that is not always true. Alternatively, matrices made up of weights representing various types of spatial connections can approximate what is observed in real-world circumstances (Getis, Reference Getis2009; Harris, Moffat, and Kravtsova, Reference Harris, Moffat and Kravtsova2011).
First, we specified an inverse distance matrix such that for each element of matrix W, ${W_{ij}} = \frac{1}{{{D_{(i,j)}}}}$
, where D
(
i
,
j
) was the distance between parcels i and j, for distances less than 200 meters, and Wij
= 0 otherwise, independent of whether they actually shared a boundary. In our sample, there were one to six neighboring parcels within 200 meters of a subject parcel.
${W_{ij}} = \frac{1}{{{D_{(i,j)}}}}$
, where D
(
i
,
j
) was the distance between parcels i and j, for distances less than 200 meters, and Wij
= 0 otherwise, independent of whether they actually shared a boundary. In our sample, there were one to six neighboring parcels within 200 meters of a subject parcel.
Second, we used a robust type of inverse distance matrix that always assigned neighbors to a region. The number of neighbors was the same for the whole study area, and it was identified by a number k.Footnote
3
The “kth nearest neighbor” inverse distance matrix was such that for each element of the matrix W, ${W_{ij}} = \frac{1}{{{D_{(i,j)}}}}$
, where D
(
i
,
j
) was the inverse distance between parcels i and j, for up to k parcels, and Wij
= 0 otherwise. Depending on the size and number of regions, settings of k vary; a value of 10 was tractable in our case. However, we also ran the regression using other k values to check for the robustness of our results. The use of these two different types of inverse distance matrices allowed us to compare our results across different scenarios of spatial dependencies.
${W_{ij}} = \frac{1}{{{D_{(i,j)}}}}$
, where D
(
i
,
j
) was the inverse distance between parcels i and j, for up to k parcels, and Wij
= 0 otherwise. Depending on the size and number of regions, settings of k vary; a value of 10 was tractable in our case. However, we also ran the regression using other k values to check for the robustness of our results. The use of these two different types of inverse distance matrices allowed us to compare our results across different scenarios of spatial dependencies.
The other econometric issue concerned how the spatial weights matrix was introduced into the regression. Following Anselin and Florax (Reference Anselin, Florax, Anselin and Floras1995), this study used a specification that was both a spatially lagged and autoregressive disturbance model. The model allows for spatial interactions in the dependent variable and the disturbances. These interactions in the dependent variable are modeled through a spatial lag structure that assumes an indirect effect based on distance, so that the weighted average of neighboring housing prices affects each house's price. This spatial clustering of sale prices can be because of similarities in homes that were constructed around the same time in a neighborhood and possibly by the same contractor. The autoregressive disturbance component incorporates spatial considerations through a spatially weighted error structure. This type of autoregression can arise when the hedonic model does not contain adequate measures of neighborhood quality or has problems associated with omitted variables. The spatial model we estimated is commonly referred to as SARAR (spatial autoregressive model with autoregressive residuals) with the following form:
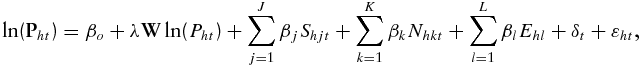 $$\begin{equation*}
\ln ({{{\bf P}}_{ht}}) = {\beta _o} + \lambda {{\bf W}}\ln ({P_{ht}}) + \sum\limits_{j = 1}^J {{\beta _j}} {S_{hjt}} + \sum\limits_{k = 1}^K {{\beta _k}{N_{hkt}}} + \sum\limits_{l = 1}^L {{\beta _l}} {E_{hl}} + {\delta _t} + {\varepsilon _{ht}},
\end{equation*}$$
$$\begin{equation*}
\ln ({{{\bf P}}_{ht}}) = {\beta _o} + \lambda {{\bf W}}\ln ({P_{ht}}) + \sum\limits_{j = 1}^J {{\beta _j}} {S_{hjt}} + \sum\limits_{k = 1}^K {{\beta _k}{N_{hkt}}} + \sum\limits_{l = 1}^L {{\beta _l}} {E_{hl}} + {\delta _t} + {\varepsilon _{ht}},
\end{equation*}$$
where ε ht = ρMε ht + μ it , and μit is assumed to be independent and identically distributed. Ln(P ht ) is the natural log of the price for house h in time t, Shjt is the jth structural attribute for house h in time t, and Nhkt is the kth neighborhood and locational attribute for house h in time t. Ehl is the lth environmental amenity variable for house h, which in this case includes proximity variables such as distance to nearest open space, distance to nearest marsh, a dummy for the view of the marsh, and so forth. The spatial weights matrices W and M (W = M) are taken to be known and stochastic. Lambda (λ) and rho (ρ) are the spatial lag parameter and spatial autocorrelation coefficient, respectively. To account for the annual variation in the sale price, we also included sale year dummies (δt ).
The existence of spatial autocorrelation increases the possibility that the errors will not be distributed normally. Maximum likelihood estimation procedures, such as those used by Bin and Landry (Reference Bin and Landry2013), depend on the assumption of normality of the regression error term, whereas the generalized moments approach does not. Thus, a generalized two-stage least squares estimator that produced consistent estimates was employed (Arraiz et al., Reference Arraiz, Drukker, Kelejian and Prucha2010).
3.3. Data
Our data set combines the county tax assessor's database of 74,082 single-family residence parcels with other geographical information system (GIS) coverages and property sales data for the years 2005 to 2011. There were 11,011 parcels included in the analysis after removing observations with missing or implausible data. If a property had sold multiple times, only the most recent sale was used. All the property sale prices were adjusted to 2011 constant dollars using the housing price index for the Savannah metropolitan area from the Office of Federal Housing Enterprise Oversight. The average sale price for the properties in the data set was $290,825 in 2011 constant dollars. Table 1 presents the definitions of all the variables used in the analysis with their expected direction of influence on the property price. Table 2 presents descriptive statistics for the data in our estimation sample.
Table 1. Variable Definitions and Expected Relationship to the Dependent Variable
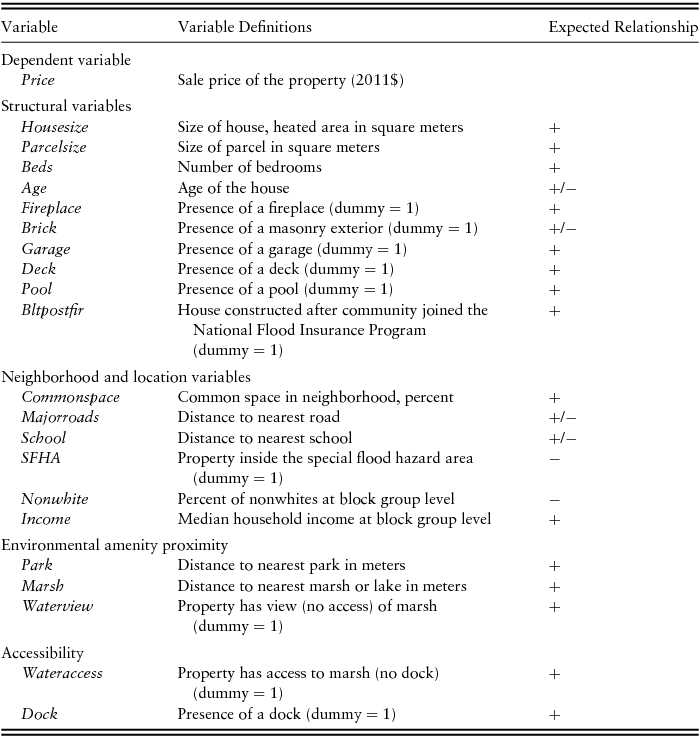
Table 2. Descriptive Statistics of the Variables
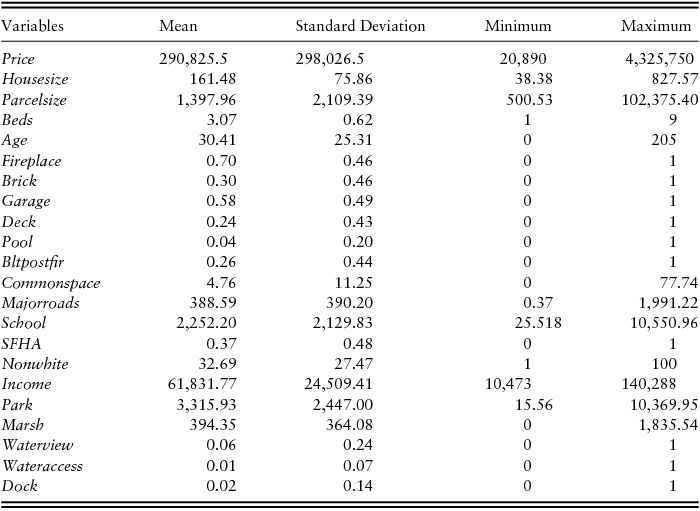
Note: N = 11,011 residential properties.
From Table 1, 10 structural variables (Sh ) were included in the model, and all of the variables were expected to have a positive effect on property prices except the variables Age and Brick, which are ambiguous. An average home in Chatham County is 30 years old with 161 square meters of heated area, 1,397 square meters of parcel size, and three bedrooms. Twenty-three percent of the properties have a deck, and 4.2% of the properties have a pool. For the properties inside the flood zones, those constructed since publication of the community's Flood Insurance Rating Map had to meet a special, damage-reducing building code. These properties have a “1” for the Bltpostfir variable, and this variable is expected to have a positive effect.
The neighborhood and location variables (Nh ) come from a variety of sources. The Commonspace variable represents the percentage of neighborhood area that will probably remain undeveloped in the future. In the newer subdivisions, these are parcels set aside by the developer at the time of construction. The tax assessor uses a special code to identify these, and the owner of record is usually a property owners’ association. Within older neighborhoods, these parcels are typically small city parks. The tax assessor identifies these parcels with another special code. Both types of common space parcels will likely remain in their current state in the foreseeable future because of deed restrictions, public ownership, and so forth. The tax assessor identifies every parcel as a member of a particular subdivision or neighborhood with a unique character string in the parcel's identification number. The total common space in a subdivision is the summed acreage of these parcels. The proportion of common space is simply this acreage divided by total acreage of all parcels with this character string.
The other types of parcels include those occupied by private, single-family houses. These are easily identified by the tax assessor because their information includes age of the house, square footage, and so forth, and they are zoned as residential. A subset of these parcels will have been purchased during 2005–2011, and they are analyzed in the hedonic regression. Second are the parcels inside a subdivision that are private vacant lots that could be developed in the future. The tax assessor records them with no improvements, the characteristics of the house are missing values, and they are not included in the hedonic regression. The vacant parcels are not counted as designated common spaces, but they are included as part of the subdivision's total acreage. The average value of the Commonspace variable is 4.7% of a neighborhood's total area.
The Income and Nonwhite variables come from the 2010 Census block group data. As calculated from the properties in this sample, the median household income in Chatham County was $61,831, and 32% of the population was nonwhite. By comparison, the county-wide averages from the 2010 Census are $42,383 and 54%, indicating that properties in the marshland areas attract more white residents and richer residents. Of the two neighborhood variables, Income is expected to have a positive effect, whereas Nonwhite should have a negative effect.
Spatial analysis tools in ArcGIS were used to compute all of the locational variables: Majorroads, School, Park, and Marsh.Footnote 4 A GIS overlay for FEMA-designated flood zones in each county was obtained, and a dummy variable indicates whether a property lies inside the “A” zone (i.e., the 100-year flood area). The effect of this dummy variable is uncertain because of varying subsidies for flood insurance premiums and the degree of loss coverage. Previous research (MacDonald, Murdoch, and White, Reference MacDonald, Murdoch and White1987) has found that if home buyers feel they (a) are paying an actuarial-based premium and (b) would not be fully compensated for flood losses, then location inside a flood zone would have a negative effect. Similarly, Atreya, Ferreira, and Kriesel (Reference Atreya, Ferreira and Kriesel2013) in their hedonic analysis found that the location within the flood zone would have a negative impact only after a significant flood event. Otherwise, the effect for the special flood hazard area (SFHA) variable becomes ambiguous.
The remaining variables in Eh represent environmental amenity considerations. The Marsh variable is measured as the meters from a property to the closest marshland-related feature. In the GIS overlay originating from the U.S. Geological Survey, these are polygonal hydrographic features labeled as a marsh, river, or lake. In an upland environment, there are obvious physical differences between the three. These features would also affect the neighboring residential properties in different ways. On the other hand, in a low-lying coastal area all three are affected by the tides. A river is basically a channel for the tidal waters, full of water at some times and empty at others. Another area can be a lake at high tide and a marsh at low tide. However, all three areas provide the same basic service (i.e., neighboring landowners have an open scenic view).
It is expected that as the distance from a marshland feature increases, property prices decrease. Of course, the marshland may have disamenity elements associated with it such as bothersome insects or unpleasant odors. If so, then the resulting coefficient would be reduced somewhat. However, it is assumed that proximity to water is a net positive amenity in this real estate market: people who believe otherwise are less likely to choose to live in a coastal county. The distance to a marsh feature was on average 394 meters. A public park also can provide amenities for nearby residents. However, close proximity to a public park may yield a disamenity because of traffic congestion. The calculated distance from each home to the nearest park (Park) was included in the model.
Among those with close marsh proximity, properties are affected to differing degrees according to these key features. The tax assessor data indicate which properties have a view of a marshland feature, and the variable Waterview captures this effect in the model. Similarly, the assessor's data indicate which ones have navigable water access (the Wateraccess variable) and which ones have water access via a boat dock (Dock). On average, 6% of the properties in our sample have a water view (Waterview), 1% of the properties have navigable water access with no dock (Wateraccess), and 2% of the properties have a dock (Dock). Each of these three effects is represented with a mutually exclusive binary variable, so approximately 9% of the parcels are affected by the marshland. Including a measure of view in hedonic regression along with proximity or access enables one to distinguish the passive aesthetic values from other active use-oriented values associated with fishing, boating, and so forth (Walls, Kousky, and Chu, Reference Walls, Kousky and Chu2015).
4. Empirical Results
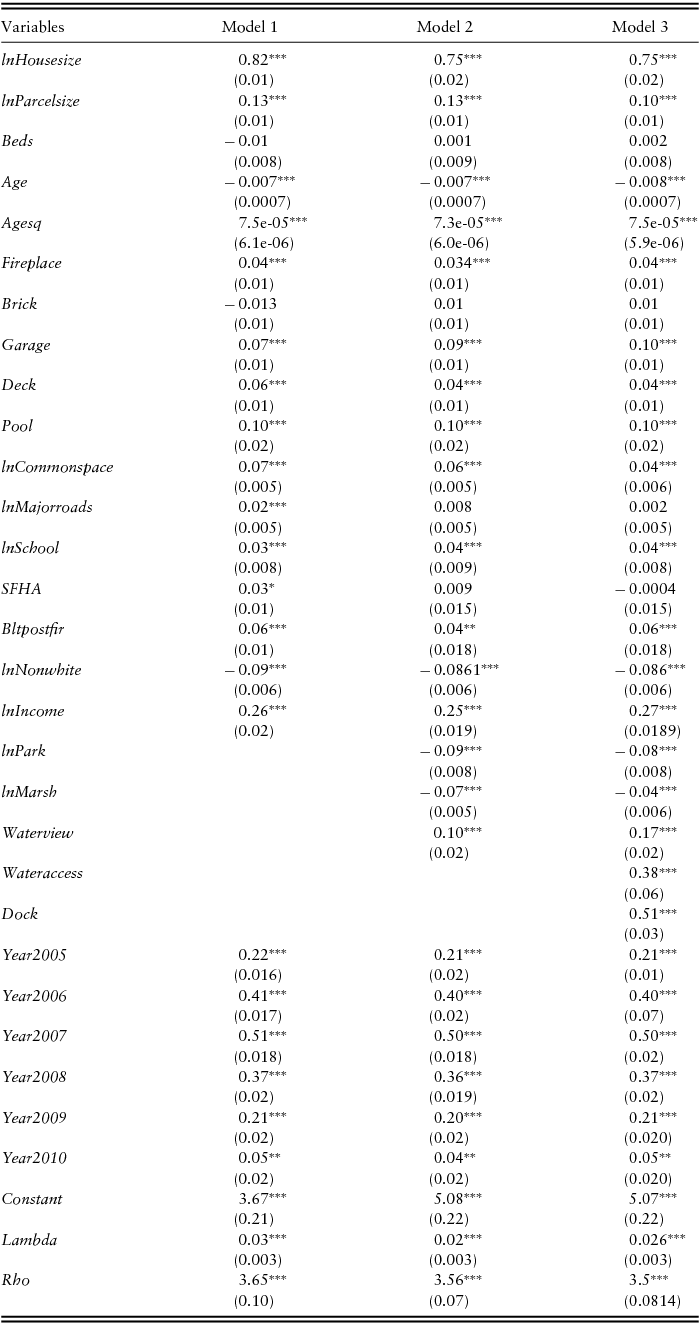
Table 3 presents the coefficient estimates of three versions of the SARAR model using an inverse distance matrix truncated at 200 meters. Model 1 includes all the structural attributes (Sh ) and neighborhood (Nh ) attributes. Model 2 includes variables in model 1 plus the environmental amenity (Eh ) variables. Model 3 is a full model that includes all the variables presented in Table 2; that is, model 3 also takes into account the accessibility to the environmental amenities that we believe influence the property prices the most. Several functional forms were compared, and the log-log functional form was found the most appropriate for this data set (i.e., all continuous variables were transformed to their natural logarithms).Footnote 5 Throughout, heteroskedasticity consistent standard errors are reported. The estimate for λ, the spatial autoregressive coefficient, is significant and in the expected direction indicating a positive adjacency effect; that is, a higher sale price of adjacent properties should result in a higher average sale price, ceteris paribus. Regarding the interpretation of the regression coefficients in the SARAR model, a marginal effect is calculated by multiplying an estimate into a spatial multiplier, 1/(1 − λ), as suggested by Kim, Phipps, and Anselin (Reference Kim, Phipps and Anselin2003).
Table 3. SARAR Model Results using an Inverse Distance Matrix Truncated at 200 Meters (dependent variable: lnPrice)
Notes: N = 11,011. Standard errors in parentheses. ***P < 0.01, **P < 0.05, *P < 0.1. SARAR, spatial autoregressive model with autoregressive residuals.
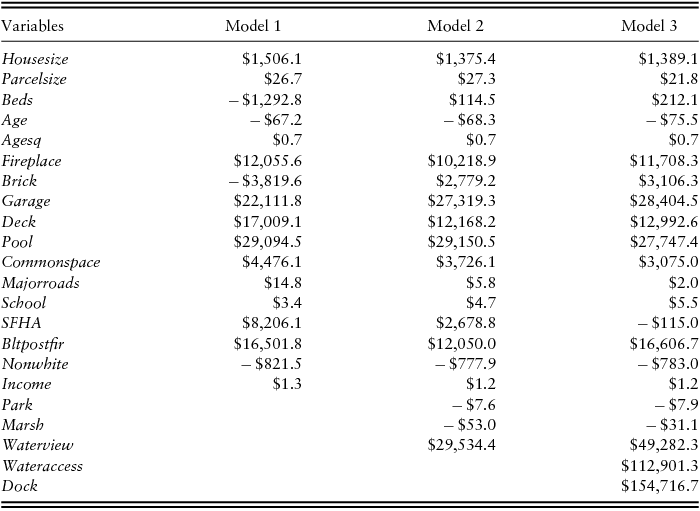
All coefficients for the structural variables have their expected sign and are statistically significant except Beds and Brick.Footnote 6 The quadratic specification for the variable Age seems to capture the diminishing marginal effects as shown by the positive and significant Agesq variable. Housesize and Parcelsize have significant impacts on property prices. A 1% increase in Housesize and Parcelsize increases property prices by 0.75% to 0.82% and 0.10% to 0.13%, respectively, which is equivalent to approximately $1,389 to $1,506 and $22 to $27 when evaluated for an average priced property across the three models (Table 4).Footnote 7 In Table 4, model 3 results indicate that a property with a fireplace (Fireplace), garage (Garage), deck (Deck), or pool (Pool), however, commands even higher price premiums equal to approximately $11,708, $28,404, $12,992, and $27,747, respectively, when evaluated for an average priced home.
Table 4. Marginal Effects Evaluated for an Average Property in Chatham County
Note: Marginal effect calculation takes into account the spatial multiplier.
All coefficients for neighborhood and location variables are of the expected sign and are statistically significant except the proximity to roads (lnMajorroads) and location in SFHA. In Chatham County, the coefficient of lnCommonspace indicates that a 1% increase in the percentage of common area in the neighborhood increases the property prices on average by approximately $3,075 when evaluated for an average price home. This result indicates that developers have an incentive to keep more common space in their design feature for greater revenue. The proximity to school significantly decreases the price of the property, which may be attributed to the level of noise from a school. An increase in the proportion of nonwhites in a community is negatively related to the property prices, whereas an increase in income is positively related to the property prices in Chatham County.
Regarding the environmental amenity variables, all of those included in the model have their expected positive sign and are statistically significant. The variables lnPark, lnMarsh, and Waterview all seem to be important factors adding value to a property. The finding that both lnCommonspace and lnMarsh are significant, positive contributors to property prices is surprising. The initial expectation was that home buyers in these real estate markets would regard these amenities as substitutes for each other because they both represent open space. However, buyers apparently view these as sufficiently dissimilar amenities. Although proximity to the marsh is important, accessibility seems to be even more important. Properties having navigable water access (Wateraccess) or water access via a dock (Dock) are much more highly valued than those just near to the marsh. For example, a 1% increase in the distance to the nearest marsh decreases the property prices by 0.04% as indicated in Table 3. However, a house having Wateraccess = 1 is valued 38% more (approximately $112,901 more when evaluated for an average priced home) than a comparable house without the water access. Similarly, having Dock = 1 is valued 51% more (approximately $154,716 more when evaluated for an average priced home) than a comparable house with no access to marsh water at all. Popular wisdom in Chatham's real estate market suggests that the effect of a boat dock is much larger. However, these findings suggest that mere water access accounts for the bulk of the price difference.
Overall, the results suggest that home buyers are willing to pay for more common space in their subdivisions, even in this environment where nature is already providing open space in the form of marshland features. Whether developers have an effective market-based incentive to provide more ecofriendly designs is the subject of the next section.
5. Alternative Development Scenarios
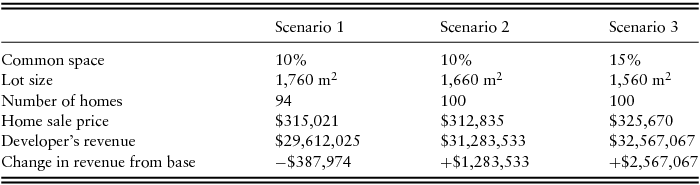
Simulation results for three different development scenarios are presented in Table 5. The simulations are based on the hedonic regression results from Table 3, and they incorporate the spatial parameters. The base case from which comparisons are made is the average house in this housing market, in a neighborhood with 20 hectares, containing 100 homes, with an average lot size of 0.176 hectare, roughly 0.43 acres. If each property can be sold for $300,000, then the developer's gross revenue would be $30 million. Of the 20 hectares, 5% (1 hectare) is initially set aside for common spaces. The developer can adjust the plan for the subdivision in a variety of ways, but here the focus is on three specific alternative designs.
Table 5. Residential Subdivision Design Simulations for Chatham County, Georgia
Notes: Base case is the conventional design, with 20 hectares, 100 homes, 5% common space, $300,000 per home, and $30 million revenue to the developer. Home prices are calculated from the spatially lagged, autoregressive error regressions.
With the total area of the subdivision fixed, the first design incorporates 5% more common space (i.e., an additional hectare of common space). To achieve the increase in the common space, 1 hectare worth of private land is converted to a park or other common space with permeable surface. Because the size of the lots is not changed, the developer has to forgo construction on six lots. The loss of salable properties leads to a net decrease in the developer's gross revenue of −$387,974.
The second scenario assumes the developer “buys into” the green growth strategy fully, and the increase in common area (10%) is accompanied with a reduction in lot size. Lot size falls from 0.176 hectare to 0.166 hectare, or −5.68%. This enables the number of salable lots to remain constant. Here, the increase in the common space has a positive effect on sale price, but smaller lot size has a negative effect. The loss of 100 meters per lot, however, is small relative to the gain from the common space, so the overall impact in this scenario is an increased sale price of approximately $12,835. Because the number of lots does not decrease from its base, the scenario produces approximately $1,283,533 more gross revenue.
The third scenario is similar to the second where the common space is increased to 15% while decreasing the size of the lot to 0.156 hectare. The number of salable lots remains the same at 100, so the gross revenue from this design is equal to $2,567,067, more than double the second scenario. This finding indicates that in the Chatham County real estate market, increasing the common space and decreasing the lot size leads to higher gross revenue, ceteris paribus.
6. Summary and Conclusions
Preserving open space is an important component of land use policy in rapidly urbanizing areas (Lichtenberg, Reference Lichtenberg2011). Hedonic studies of planned open space and natural areas have shown that the capitalization of these amenities in home prices varies greatly depending on the type of natural lands and various attributes of those lands (Walls, Kousky, and Chu, Reference Walls, Kousky and Chu2015). However, to best of our knowledge, this is the first study of the value of planned open space, or common space, in a tidal marshland environment. In this coastal environment, a complicating factor is that buyers may regard the marshland as a substitute for the open space that a developer has set aside with the result that existing marshland may have a “crowding out” effect on planned open space. However, we find that this is not the case in Chatham County, Georgia. Home buyers value the open space set aside by a developer to a similar degree as they value marshland. When the proximity to the marsh was not included in the hedonic model, the common space was valued more. However, when the proximity to the marsh was introduced into the model, the value was spread across the marsh and the open space. Also important was the accessibility to the marsh, which was valued much more than just the proximity to the marsh. This finding can be attributed to its potential recreational use value. Marshlands provide services that protect communities from flooding, naturally treat storm-water runoff, and allow for groundwater infiltration. Apart from these services that marshlands provide, we demonstrate that a nearby marshland also adds value to the property prices.
A series of property price simulations for Chatham County indicated that real estate developers have a market incentive to incorporate more open space and smaller lot sizes in their design of residential subdivisions. This study also shows that the trade-off between planned open space and lot sizes holds up in coastal areas where nature is already providing open space in the form of saltwater marshes, tidal rivers, and other water features. This is important because the marshland ecosystem is quite sensitive to pollution from storm-water runoff, and open space can reduce this. We conclude that although political motivations may act as a barrier, understanding and incorporating the values of environmental amenities into land use planning could reduce the negative impacts associated with urbanization.


 Open access