


Introduction
Despite the extensive literature on Alzheimer’s disease (AD), there is surprisingly little data about the cognitive course trajectories experienced by patients. This is important since appreciating course trajectories may inform clinical research and care. Historically, cognition in AD was thought to follow an inexorable linear downhill course (Hochstetler et al., Reference Hochstetler2015). However, later studies demonstrated a more heterogeneous course that comprised slow and fast cognitive decliners (Schmidt, Reference Schmidt2011). and even a subgroup that showed minimal or no decline (Clark et al., Reference Clark1999; Haaksma et al., Reference Haaksma2018). More recently, investigators identified between three and six cognitive trajectories that patients traverse over time (Haaksma et al., Reference Haaksma2018; Melis, et al., Reference Melis, Haaksma and Muniz-Terrera2019; Schmidt, Reference Schmidt2011). The trajectory studies demonstrated that Inferences based on a single mean trajectory score can lead to serious overestimations of the speed of cognitive decline (Haaksma et al., Reference Haaksma2018).
Earlier AD cognitive trajectory studies had several limitations. Some studies were based on longitudinal data of 3 years or less, whereas longer studies had small final samples (N < 150) with very few minority elders (Haaksma et al., Reference Haaksma2018; Hochstetler et al., Reference Hochstetler2015; Leoutsakos et al., Reference Leoutsakos2015; Wang et al., Reference Wang2019). Most of the recent trajectory studies used growth mixed models (GMMs), which is a type of clustering analysis that identifies latent groups in a sample. Design issues, including sample size and the number of measurement occasions, may affect the number of latent classes found (Hoeksma and Kelderman, Reference Hoeksma and Kelderman2006). Consequently, there have been difficulties in replicating the same trajectories across studies (Haaksma et al., Reference Haaksma2018; Melis, et al., Reference Melis, Haaksma and Muniz-Terrera2019; Wang et al., Reference Wang2019). Moreover, statistical models may identify configurations that do not reflect the granular patterns within the AD population. Closer inspection of the scatterplots of the cognitive trajectories in the literature suggested that there are stable and irregular trajectories, and even some with patterns of improvement (Haaksma et al., Reference Haaksma2018; Hochstetler et al., Reference Hochstetler2015; Leoutsakos et al., Reference Leoutsakos2015; Wang et al., Reference Wang2019). However, these were not identified as distinct trajectories, although they may be clinically relevant. By contrast, some studies found multiple classes of decline that did not seem to differ clinically (Haaksma et al., Reference Haaksma2018; Wilkosz et al., Reference Wilkosz2010).
This study addresses the clinical limitations of GMM and the paucity of long-term large-scale representative studies of course trajectories in AD. In so doing, we utilize a hybrid of qualitative and quantitative methods to examine individuals’ cognition longitudinally based on Mini-Mental State Examination (MMSE) scores. Following the methods of Tufte (Reference Tufte2001), we undertake an exploratory approach that examines the graphic patterns of cognitive functioning over time and then appraise empirically these patterns for their distinctness and associated variables. This approach is used to answer the following questions:
-
1. What are the 5-year global cognitive trajectories for persons diagnosed with AD?
-
2. What factors at intake are predictors of a specific trajectory?
Methods
We utilized data from the National Alzheimer’s Coordinating Center (NACC) Uniform Data Set (UDS; version 1-2) which collects information from approximately 36 Alzheimer’s Disease Research Centers in the United States. The UDS methods are described elsewhere (Morris et al., Reference Morris2006). After enrollment, participants undergo regular evaluations spaced about 1 year apart until either dropout or death. During this study’s data collection period (2005–2017), baseline AD was diagnosed using the National Institute of Neurological and Communicative Disorders and Stroke and the Alzheimer’s Disease and Related Disorders Association criteria (1984) (McKhann et al., Reference McKhann1984). We utilized the MMSE (Folstein, et al., Reference Folstein, Folstein and McHugh1975), a long-established measure of global cognition, as the basis for developing the cognitive trajectories. We included persons with an AD diagnosis and, to avoid floor effects, we excluded persons with severe dementia, that is, MMSE scores <10 (note: MMSE is scaled from 0 to 30). To ensure that complex course patterns were not overlooked, we included only persons with complete MMSE scores at baseline and for each of the subsequent 5 years. A total of 414 persons fulfilled these criteria.
Utilizing criteria established in prior longitudinal studies, we designated a cutoff score of ±3 or greater to indicate a meaningful change in the MMSE (Hensel, et al., Reference Hensel, Angermeyer and Riedel-Heller2007; Tombaugh, Reference Tombaugh2005) We created a taxonomy of trajectories using quantitative and qualitative methods. Following the suggestions of Tufte (Reference Tufte2001) regarding the importance of using graphic displays to fully appreciate the essence of the data, we initially examined the graphs of the cognitive trajectories of each subject and the revealed patterns were then operationalized empirically according to the following coded decision rules: (1) decliners: subjects with a decrease of ≥3 points from baseline on the MMSE at 5 years. The decliners were divided into slow and fast groups, with subjects in the latter group required to have a 5-year MMSE change score of at least 2 standard deviations below the mean baseline MMSE score for the entire sample (7.8 points); this cutoff approximated the median frequency of the change scores of persons in the decliner group (slow decliners’ MMSE 5-year change scores ranged from −3 to −7; fast decliners’ MMSE 5-year change scores ranged from −8 to −27); (2) improvers: an increase of ≥3 points from baseline on the MMSE at 5 years; (3) stable: no change of ≥3 points up or down on the MMSE from the prior year on each of the annual examinations over 5 years and the final year MMSE change scores was between ±2 points from baseline [Note: 20% of this group fluctuated slightly (±2) outside this range, but the final net change was between ±2.]; (4) zigzag stable: a change of ≥3 points up or down on the MMSE followed by a return of the change scores to ±2 points from baseline at 5 years. We also identified three subtypes within the slow and fast decliners: (1) zigzag decline: a change of ≥3 points up or down followed by a return of at least ±3 points, respectively, and the overall decline in the MMSE was ≥3 from baseline at 5 years; (2) late decliners: No change of ≥3 points up or down on the MMSE for at least the initial three annual exams, but overall MMSE decline was ≥3 points from baseline at 5 years; (3) curvilinear (nonlinear) decline trajectories of ≥3 point decline from baseline MMSE at 5 years.
Numerous variables have been found to predict the subsequent course of AD (Haaksma et al., Reference Haaksma2018; Schmidt, Reference Schmidt2011;, Melis, et al., Reference Melis, Haaksma and Muniz-Terrera2019;, Baker et al., Reference Baker2017; Eldholm et al., Reference Eldholm2018; Haaksma et al., Reference Haaksma2019; Wattmo, et al., Reference Wattmo, Minthon and Wallin2016). These risk factors were conceptualized into four categories (sociodemographics; family, personal history, and biological and genetic factors; clinical treatment; and clinical disorders, symptoms, and functioning) and operationalized into 21 predictor variables listed in Table 1.
Table 1. Bivariate analyses of the distribution of percentages and means of the baseline predictor variables by trajectory type
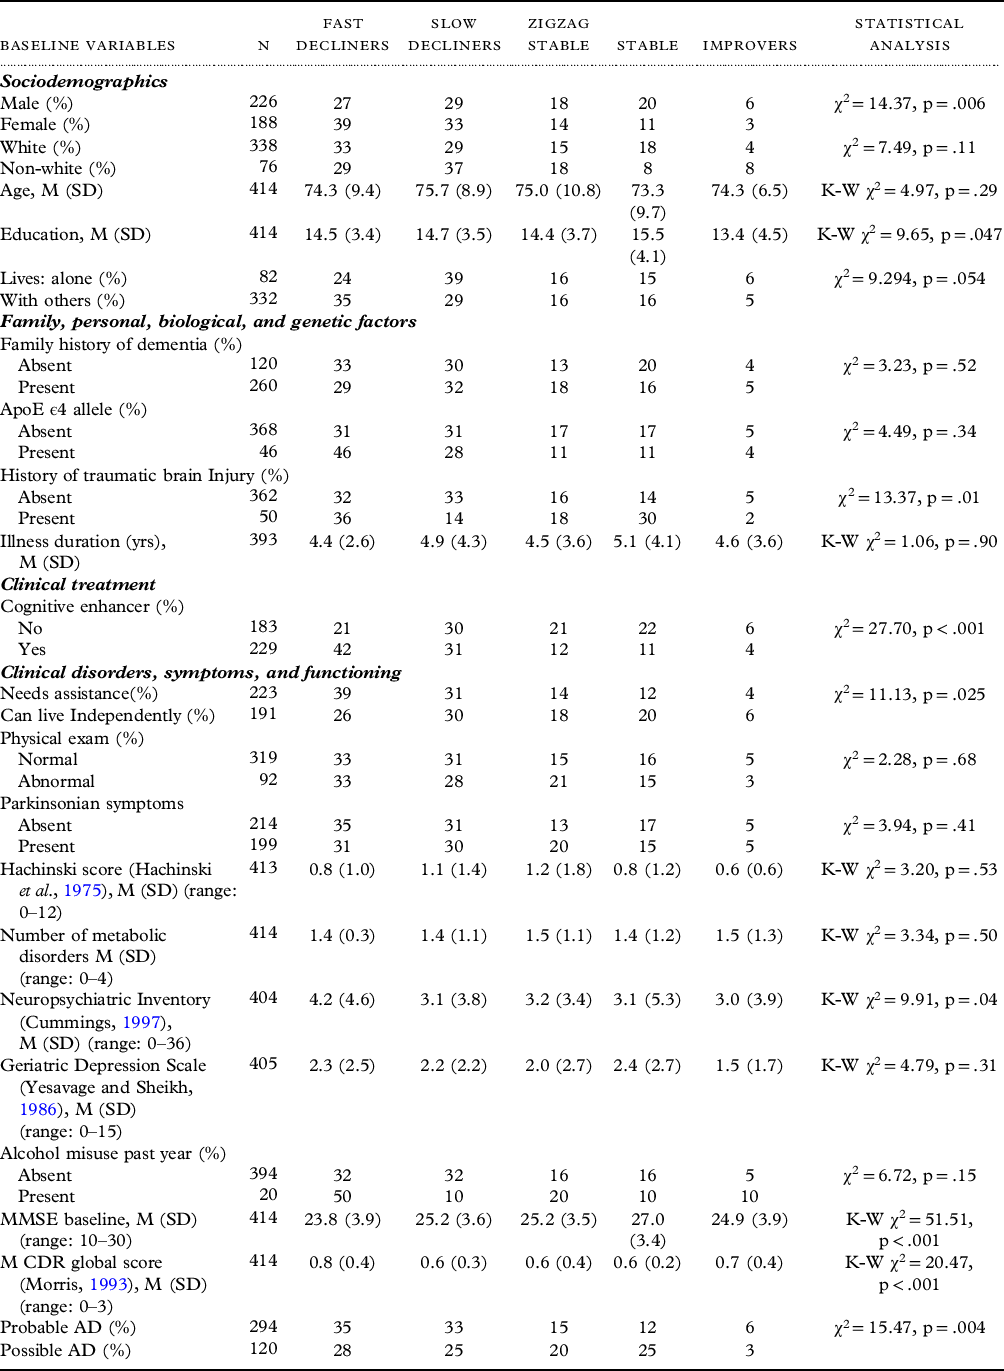
Some totals may not equal 100% due to rounding, df = 4 for all chi-square and Kruskal–Wallis (K–W) analyses.
MMSE = Mini-Mental State Examination; CDR = CDR® Dementia Staging Instrument; TBI = traumatic brain injury; M (SD) = mean (standard deviation).
Statistical analysis
To test the distinctness of each cognitive trajectory category, we compared their MMSE scores over time using repeated analysis of variance with a Huynh–Feldt correction. Assumptions of normality were met. To examine differences in the predictor variables among the five principal trajectories, we conducted bivariate analyses of the 21 variables in Table 1 using chi-square analysis and the Kruskal–Wallis (K–W) test for categorical and ordinal/continuous variables, respectively. Next, these predictor variables were entered into binary logistic regression analyses to determine the independent effects of these variables in distinguishing each trajectory from the other trajectories. There was no evidence of high collinearity among the predictor variables entered into the final analyses. As this is an exploratory study, we used a significance level of p < .05; however, p-values are listed for all tests.
Results
We confirmed five distinct cognitive trajectories: fast decliners, slow decliners, zigzag stable, stable, and improvers; these represented 32.7%, 30.7%, 15.9%, 15.9%, and 4.8% of the sample, respectively (Table 2). These categories corresponded well with changes in the CDR® Dementia Staging Instrument (Morris, Reference Morris1993) staging at 5 years (Table 2). The overall model of cognitive trajectory category × time with the MMSE scores as the dependent variable was significant [F(16.46,1682.99) = 94.25, p = <.001, η2 = 0.48]. A post hoc Tukey’s HSD test indicated statistically distinct patterns among all trajectories except for the improvers, which only attained a significant difference with the fast decliners.
Table 2. Distribution of trajectory patterns for entire sample and by gender
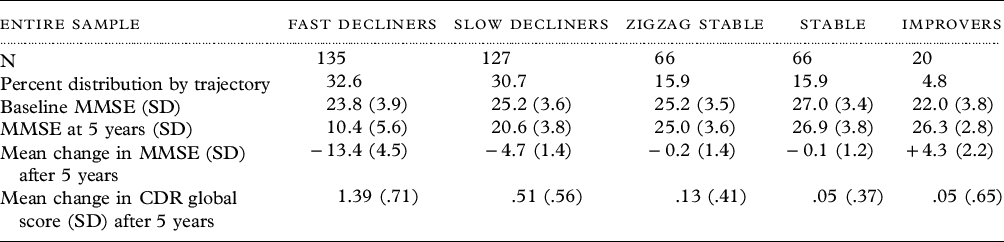
MMSE = Mini-Mental State Examination; CDR = CDR® Dementia Staging Instrument.
Within the two decliner categories, most people exhibited a curvilinear decline (n = 161; 61%); however, there were two large subtypes comprising zigzag decliners (n = 53; 20%) and late decliners (n = 48; 18%). Among the late decliners, five times as many subjects were in the slow decliners than the fast decliners (χ2 = 31.58, df = 1, p < .001). There were three patterns within the zigzag stable category: improve then decline (n = 24, 36%), decline then improve (n = 39, 59%), and double zigzags, that is, two occurrences of improvement alternating with decline (n = 3, 5%). Figure 1 illustrates the graphs of the trajectories; also see Supplementary Table 1 for a detailed description of subcategories.
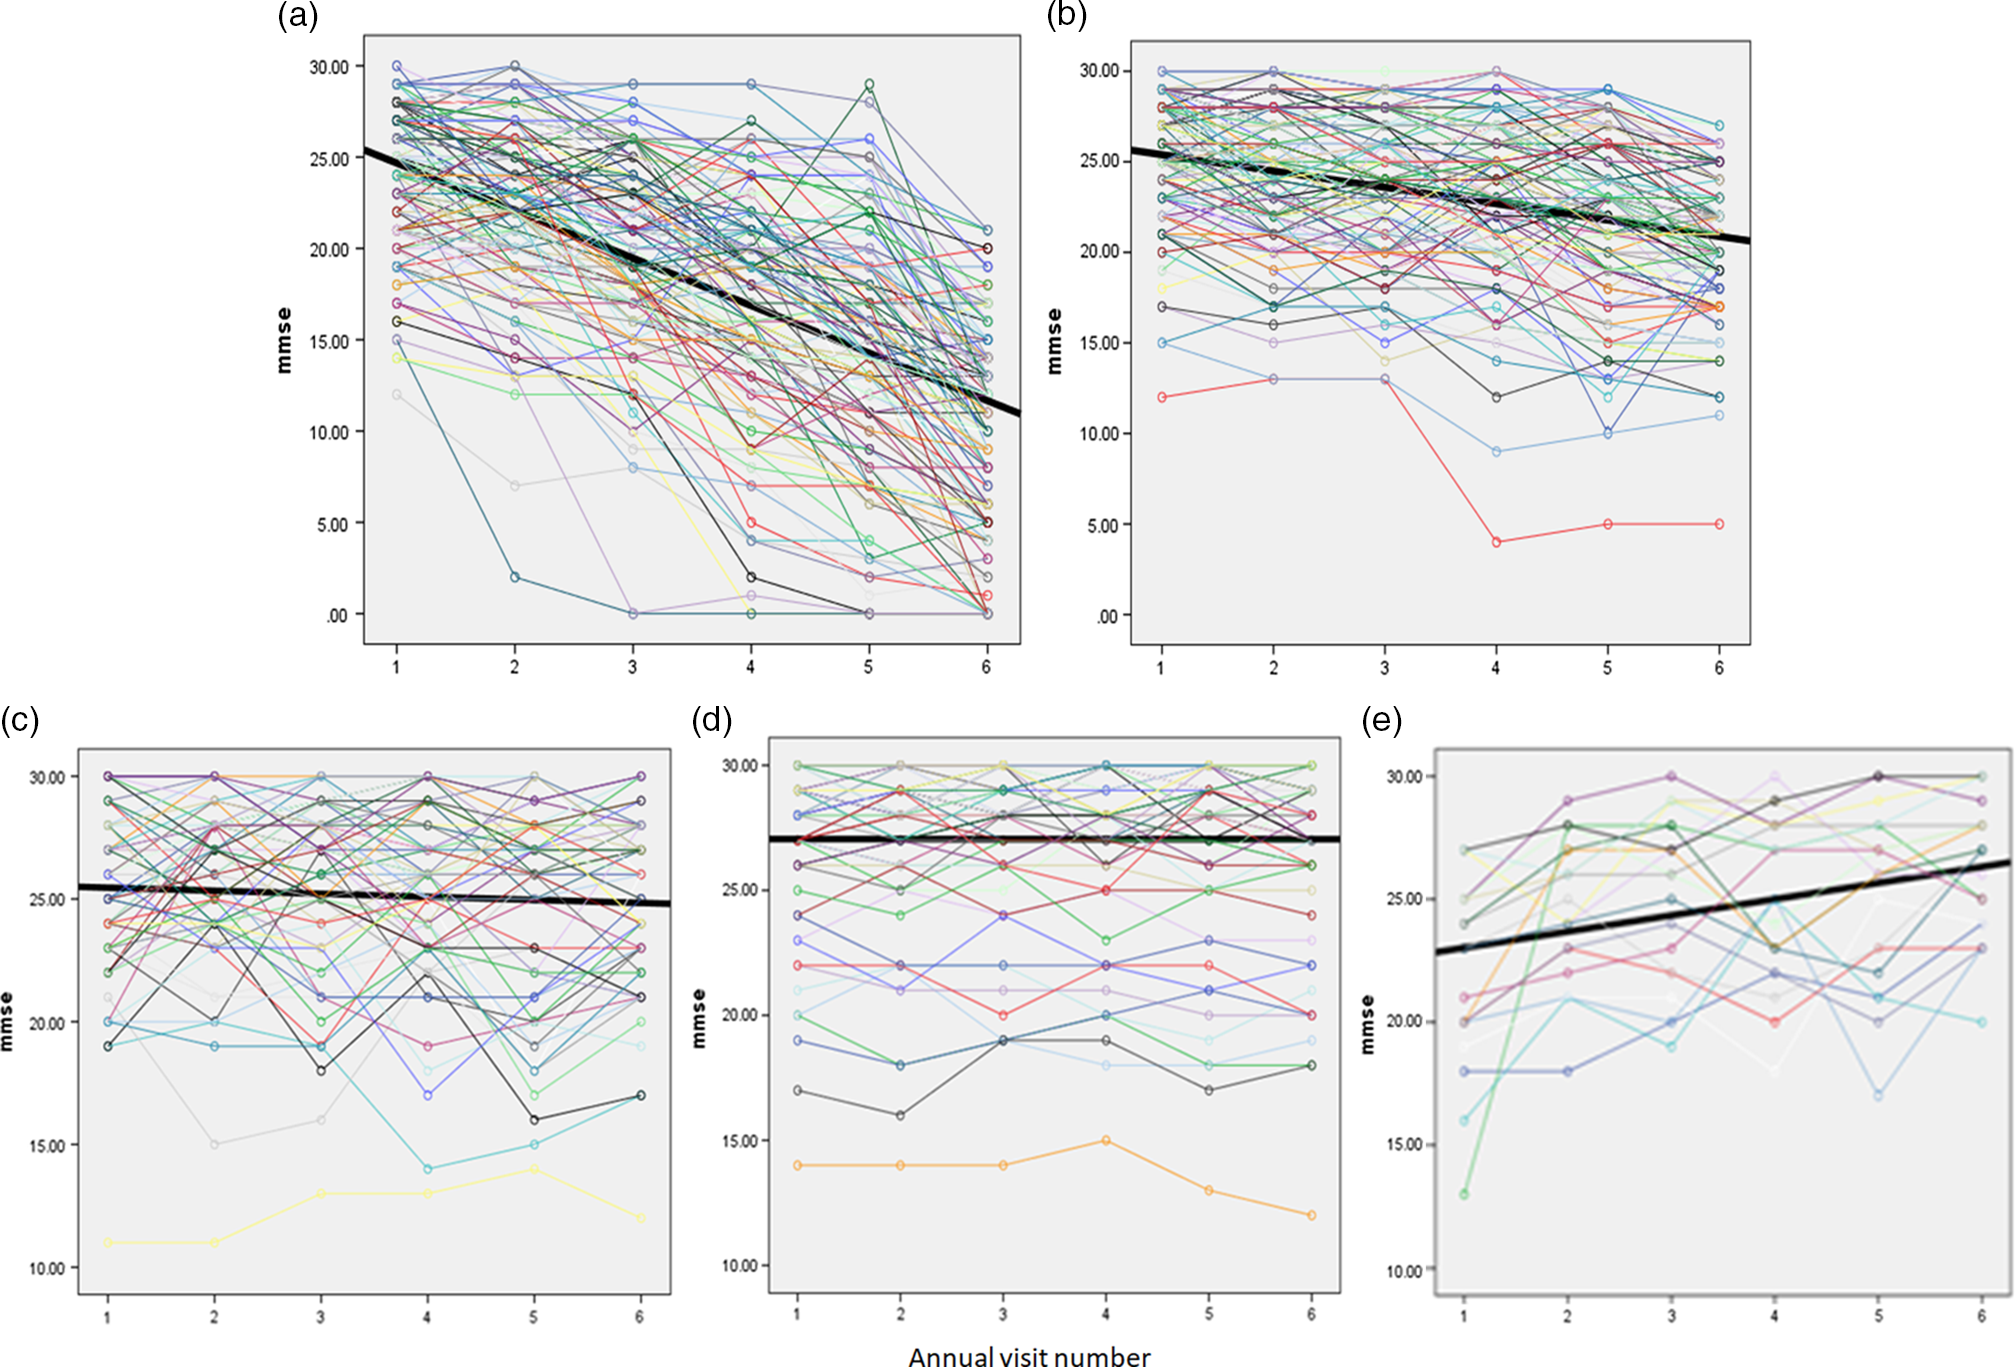
Figure 1. (a) Fast decliners; (b) slow decliners; (c) zigzag stable; (d) stable; (e) improvers. Time = intake (#1) and annual visit number (#2–#6).
After the first year, if a person’s MMSE declined by ≥3 points from baseline, the likelihood of ending up in one of the decliner groups after 5 years was 86% (Figure 2; Supplementary Table 2). The likelihood of being in one of the decliners groups rose each year for persons if the negative change score from intake was ≥3. Most eventual decliners were not apparent early in the follow-up period; only about one-third and one-half were evident in the first and the second year of follow-up, respectively. However, among fast decliners, 34% and 59% had ≥3 point declines by the first and second year, respectively. Predictability was affected in part by zigzaggers (n = 39) who initially demonstrated a pattern of decline and then returned to normal levels. The probability of being in one of the stable/improver groups after not showing a decline of 3 points from baseline was 43% in the first year, but this increased to 70% by the 4th year. Lower predictability in the stable/improver groups was due in part to the subgroup of late decliners (n = 48) that appeared stable but then declined.
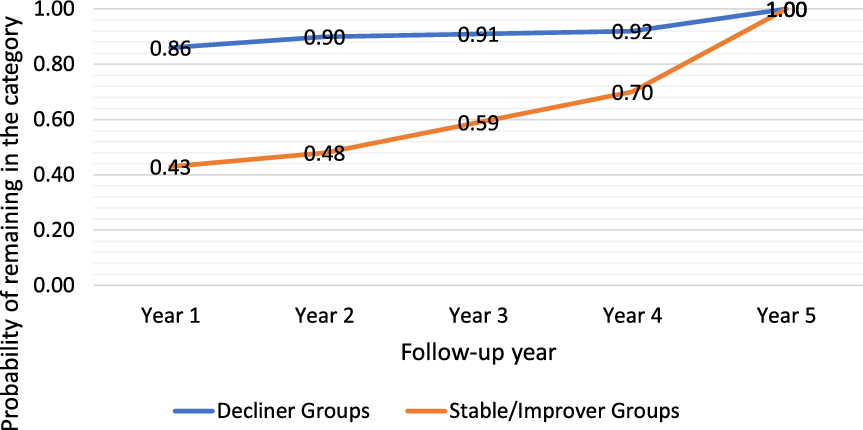
Figure 2. Probability of remaining in a trajectory group at 5 years based on status in a given year.
In bivariate analysis, 9 of 21 baseline variables (viz. gender, education, needs assistance, history of traumatic brain injury (TBI), Neuropsychiatric Inventory score, use of cognitive enhancers, MMSE score, CDR® Dementia Staging Instrument global score, and AD diagnostic certainty) had significant differences across the categories (Table 1). We used binary logistic regression analysis with 19 of these baseline variables to predict their independent effects on subsequent category membership (Table 3). Family history was eliminated because of missing data and the baseline CDR global scale was eliminated because of its high correlations with baseline MMSE scores (r = −.59; p < .001) that attenuated the effects of both variables when they were entered concurrently. The fast decliner trajectory was associated with female gender, a shorter length of illness, taking a cognitive enhancer, and a lower baseline MMSE score. The stable trajectory was associated with longer illness duration, higher baseline MMSE scores, a greater likelihood of TBI, and a lower prevalence of ApoE ϵ4 allele genotype. The slow decliners category was associated with a lower rate of prior TBI. The zigzag stable trajectory was associated with lower usage of cognitive enhancers. Improvers were associated with being male and lower baseline MMSE scores. When we excluded persons with possible AD and examined probable AD separately, the findings were similar, with most differences reflecting reduced statistical power (Table 3).
Table 3. Binary logistic regression analyses of each cognitive trajectory versus other trajectories
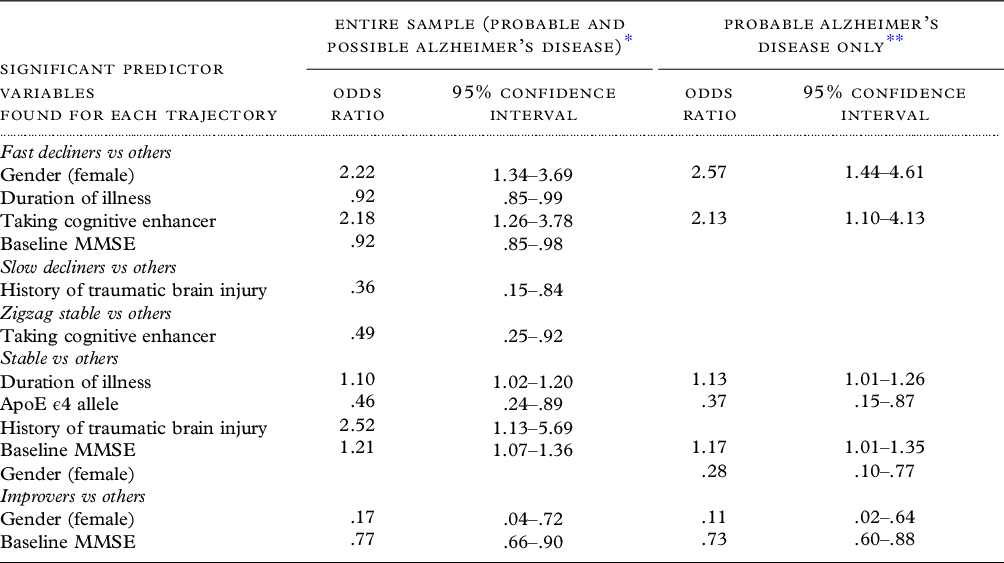
All predictor variables listed in Table 1 were entered together except for family history of dementia and CDR global score. For each regression analysis, the trajectory is examined versus the other trajectories.
* N = 387.
** N = 275.
There were a few potentially relevant significant differences between the 5-year sample used here and the UDS sample that had met initial eligibility criteria but had not completed five consecutive years of evaluations (n = 10,937), nearly two-thirds of whom had come for only one or two visits. Completers were more likely to be male (55% vs 46%; χ2 = 12.69, df = 1, p < .001) and have higher scores on baseline MMSE (24.9 vs 22.5; Mann–Whitney (M–W) U = 1575211, p < .001), but there were no significant differences between groups in age (74.7 vs 75.5 years; M-W U = 2162279, p = .12), education (14.6 vs 14.4 years; M–W U = 2165921, p = .24), non-White race (18% vs 19%; χ2 = .22, df=1, p = .64), or duration of illness (4.7 vs 4.8 years; M–W U = 1956885, p = .13). We conducted a post hoc analysis in which we adjusted the study sample so that the distribution of MMSE scores and gender were matched closely to those persons in the UDS who had not completed 5 years of participation. The adjusted sample consisted of 264 persons (46% male; 54% female). There were no significant differences between the completer and non-completers in the distribution of MMSE scores (χ2 = 30.15, df = 20, p = .07) or gender (χ2 = .00, df = 1, p = .97). The categorical distribution of the trajectories for the adjusted sample did not differ significantly from the original study sample (χ2 = 2.53, df = 4, p = .63).
We conducted a second post hoc analysis on 117 persons for whom there was postmortem neuropathological information. The positive predictive values (PPVs) for possible and probable AD were 79% and 90%, respectively (86% for the sample as a whole) for the presence of intermediate or high scores on the National Institute on Aging–Alzheimer’s Association AD Neuropathologic Change criteria (“ABC score”); (Montine et al., Reference Montine2012); this difference between AD groups did not attain statistical significance (χ2 = 2.60, df = 1, p = .11).
Discussion and conclusions
Our hybrid approach using quantitative and qualitative methods generated five distinct global cognitive trajectory categories and three subtypes within the decliner groups. This taxonomy provides a more nuanced and clinically meaningful picture than a single mean trajectory or the GMM-generated trajectories. Among persons who were in the decliner trajectories, roughly half were in the slow decliner category, and among the slow decliners about one-third were stable for the first 3 years. Moreover, among persons in the stable groups, 30% (39/132) exhibited a zigzag pattern that resembled decliners but then recovered. Among the decliners, rather than the sloping curvilinear curves portrayed in earlier studies, one-fifth showed a zigzag pattern.
It is now recognized that AD has a heterogeneous course; however, earlier studies focused on the diversity among decline curves and conflated slow decline, steady, and improving courses. An examination of the trajectories and scatterplots of several studies revealed early stability in cognition for AD and dementia (Haaksma et al., Reference Haaksma2018; Hochstetler et al., Reference Hochstetler2015; Leoutsakos et al., Reference Leoutsakos2015; Wang et al., Reference Wang2019; Wilkosz et al., Reference Wilkosz2010). Several clinic-based studies found stable cognitive functioning in 16% to 30% of patients for periods of 2–4 years (Clark et al., Reference Clark1999; Cortes et al., Reference Cortes2008; Hallikainen et al., Reference Hallikainen2013). More notably, a population-based study in Cache County found 30% of the sample declined less than 1 point per year on the MMSE after 5 years (Tschanz et al., Reference Tschanz2011). A trajectory not recognized previously is the zigzag pattern that was seen in half the persons who remained stable and in some decliners. When we examined scatterplots from earlier studies, it was evident that statistical models overlooked the irregular trajectories of many real-world patients.
Like other studies, we found only a few variables that could distinguish trajectory groups, and most of the odds ratios had small effect sizes. Using a 19-variable predictor model, we found fast decliners and the stable trajectory yielded the highest number of significant predictors. Female gender, lower baseline MMSE scores, shorter illness duration, and use of a cognitive enhancer increased the risk of being in a rapid decline group. In contrast, a longer duration of illness, a higher baseline MMSE, the absence of an ApoE ϵ4 allele, and higher rates of TBI increased the likelihood of following a stable course. These findings are consistent with a literature review by Sona et al (Reference Sona, Ellis and Ames2013) who found that women typically had a more rapid cognitive decline than men, and that fast decline was associated with more severe cognitive decline at disease onset, especially if diagnosed at an intermediate stage of illness. There have been inconsistencies in the literature regarding the impact of ApoE ϵ4 on clinical course, and it has been associated with rapid, slow, or no declines in AD (Eldholm et al., Reference Eldholm2018; Schmidt, Reference Schmidt2011; Sona, et al., Reference Sona, Ellis and Ames2013). Our observations that TBI was proportionately more common in the stable trajectory and proportionately less common in the slow decliner trajectory may reflect findings that TBI is associated with numerous types of dementia such as Lewy body accumulation and Parkinsonism (Ramos-Cejudo et al., Reference Ramos-Cejudo2018). Perhaps, the underlying comorbid neuropathology of people with a stable course differs from other trajectories. Increasingly, it has been recognized that various neuropathologies often coexist with AD pathology, perhaps exceeding 50%, and it is plausible that they may affect the course of the disorder (Barnes et al., Reference Barnes2015; Kapasi et al., Reference Kapasi, DeCarli and Schneider2017).
A strength of this study is that we used a hybrid methodological approach that provided a more granular clinical picture of AD cognitive course trajectories than those created by earlier statistical analyses. We identified patterns that were apparent in the scatterplots of earlier studies but were not considered relevant. Our trajectories were statistically distinct except for the improvers, which only differed from the fast decliners, and may ultimately warrant its inclusion with the stable group. We examined disease course over 5 years so that long-term outcome was not truncated, the sample size was sufficiently large to identify five clinically meaningful trajectories, the data were derived from racially and geographically diverse sources across the country, and the independent effects of risk factors were assessed using a multivariable approach.
While this study aimed to identify distinct long-term cognitive trajectory patterns in AD patients utilizing complete 5-year data, it is plausible that other samples might yield different proportions of persons within each trajectory. Nevertheless, our closer inspection of scatterplots from earlier studies provides compelling evidence that these patterns exist across samples, albeit the distributions may differ. Similarly, in our analysis, since only a small percentage of the UDS sample had complete 5-year MMSE data, it is uncertain whether the proportion of persons in the trajectories identified in this study would have reflected trajectories in the general community or the subsequent patterns of the broader group coming for evaluation to the Alzheimer’s Disease Research Centers. Indeed, there may be a survivor bias in that the completers remained alive and available for follow-up for 5 years. However, when we adjusted our study sample to resemble the MMSE and gender distributions of the non-completers (i.e., 54% female in the adjusted sample), there were no significant differences in trajectory category distribution between the adjusted and the original study samples. Other limitations include the absence of data on the use of anticholinergic agents, the potential effects of changes over time in the baseline clinical variables, and the impact of family or formal support systems, albeit we did include a variable on living arrangements. Although the sample size of 414 is modest in size, it is larger than other long-term trajectory studies at 5 years. Because of high dropout rates, it is difficult to obtain complete 5-year data, and all investigators must compromise between larger sample sizes with shorter durations that have truncated trajectory patterns versus smaller samples with longer durations of follow-up with more evolved trajectory patterns.
The MMSE poses a potential limitation concerning its reliability as the outcome measure. Although the MMSE has high test–retest reliability (.79–.99) (Clark et al., Reference Clark1999), there are still potential measurement errors. Clark et al (Reference Clark1999) argued that most errors could be obviated with a meaningful indicator of change (roughly 3 points) and a longer duration of analysis (e.g., 3 or more years). We have done both. Nevertheless, results may be affected by environmental factors, medications, problematic behaviors, medical conditions, or unmeasured confounders.
Finally, we must consider whether non-decliners may have been misdiagnosed by the Alzheimer’s Disease Research Centers. Indeed, when more stringent criteria (“probable” AD) were used, there were fewer people in the stable/improved trajectories, that is, 33% versus 37% in the combined probable/possible sample. However, the stringent criteria are somewhat tautological, since a history of steady decline is incorporated into the diagnostic criteria of probable AD, whereas possible AD allows for more atypical presentations (McKhann et al., Reference McKhann1984). On the other hand, postmortem neuropathology studies have found minimal differences in the PPVs for AD based on probable versus possible AD diagnoses (Beach et al., Reference Beach2012). Our post hoc analysis of postmortem findings demonstrated no significant differences in the PPV between the possible and probable AD groups. For our entire sample, the PPV of the clinical diagnosis of AD was 86%. Similarly, Beach et al (Reference Beach2012) found the UDS diagnosis of probable AD had about 5% greater neuropathological accuracy than the combined probable/possible diagnostic group. Another issue concerns the relevance of various biomarkers to course trajectories. Unfortunately, our sample had biomarker data for only 72 subjects, so comparisons between trajectories were not possible.
Our analysis may have important implications for clinicians. Global cognition manifests various trajectory patterns that evolve over time and identifying a patient’s trajectory type may inform care. For example, a clinically meaningful MMSE decline (≥3 points) from baseline in the first or second year appears to be an ominous sign, and the likelihood of remaining in a decliner group after 5 years was about 90%. While being in a decliner group after 1 or 2 years suggests a poorer prognosis, there is a subgroup among zigzaggers (9% of the overall sample) that showed a significant decline in the first few years, but then recovered to the stable range. On the other hand, it may take longer to determine who will remain cognitively stable. Among those who were stable after 2 years, only half remained in that category. This lack of certainty was accounted for by zigzaggers, the indolent pace of slow decliners, and by late decliners who did not decline until the 4th and 5th years. Finally, the probability of more rapid cognitive decline was higher for women and having lower baseline MMSE scores, shorter illness duration, or receiving a cognitive enhancer. A higher rate of TBI, the absence of an ApoE ϵ4 allele, and male gender were the strongest predictors of favorable outcomes.
Conclusion
Our hybrid methodological approach revealed a heterogeneous cognitive 5-year course for AD consisting of five distinct trajectories and a variegated pattern within the two broad groups of decliners and stable/improvers that was more consistent with real-world clinical experience than had been reported in earlier statistically modeled studies. Although we believe that these cognitive trajectories categories will be found in all sites, future investigations need to determine the consistency of the distribution of these categories across settings.
Acknowledgments
This study was funded by a grant from the Alzheimer’s Association GEENA-Q-19-596058.
• Dr. Reisberg’s work on this paper was supported in part by Zachary and Elizabeth M Fisher Educational Research Program at NYU Langone Medical Center and the Louis J. Kay and June E. Kay Foundation
• The NACC database is funded by NIA/NIH Grant U01 AG016976. NACC data are contributed by the NIA-funded ADRCs: P30 AG019610 (PI Eric Reiman, MD), P30 AG013846 (PI Neil Kowall, MD), P50 AG008702 (PI Scott Small, MD), P50 AG025688 (PI Allan Levey, MD, PhD), P50 AG047266 (PI Todd Golde, MD, PhD), P30 AG010133 (PI Andrew Saykin, PsyD), P50 AG005146 (PI Marilyn Albert, PhD), P50 AG005134 (PI Bradley Hyman, MD, PhD), P50 AG016574 (PI Ronald Petersen, MD, PhD), P50 AG005138 (PI Mary Sano, PhD), P30 AG008051 (PI Thomas Wisniewski, MD), P30 AG013854 (PI Robert Vassar, PhD), P30 AG008017 (PI Jeffrey Kaye, MD), P30 AG010161 (PI David Bennett, MD), P50 AG047366 (PI Victor Henderson, MD, MS), P30 AG010129 (PI Charles DeCarli, MD), P50 AG016573 (PI Frank LaFerla, PhD), P50 AG005131 (PI James Brewer, MD, PhD), P50 AG023501 (PI Bruce Miller, MD), P30 AG035982 (PI Russell Swerdlow, MD), P30 AG028383 (PI Linda Van Eldik, PhD), P30 AG053760 (PI Henry Paulson, MD, PhD), P30 AG010124 (PI John Trojanowski, MD, PhD), P50 AG005133 (PI Oscar Lopez, MD), P50 AG005142 (PI Helena Chui, MD), P30 AG012300 (PI Roger Rosenberg, MD), P30 AG049638 (PI Suzanne Craft, PhD), P50 AG005136 (PI Thomas Grabowski, MD), P50 AG033514 (PI Sanjay Asthana, MD, FRCP), P50 AG005681 (PI John Morris, MD), and P50 AG047270 (PI Stephen Strittmatter, MD, PhD).
Human subjects
Reviewed by SUNY Downstate Health Sciences University IRB and determined to be “Exempt.”
Supplementary material
To view supplementary material for this article, please visit https://doi.org/10.1017/S1041610222000047
Conflict of interest
None.
Description of authors’ roles
Dr. Cohen was responsible for conceptualization, funding acquisition, methodology, data analysis, project administration, and writing of the manuscript.
Dr. Reisberg was responsible for the conceptualization, methodology, and writing of the manuscript.
Dr. Yaffee was responsible for the methodology, data entry, statistical analysis, and writing of the manuscript.


 Open access