


In recent years, there has been growing concern about integrating the patient perspective in research, especially in the decision-making and study design processes including in the choice and assessment of clinical and health outcomes (Reference Doherty and Mendenhall1;Reference Taylor and Rutherford2). There is also a need to consider the patient’s perspective in economic evaluations within healthcare systems. Patient questionnaires are often used to collect data about their utilization of healthcare services and the costs of that utilization from the perspective of a healthcare organization or public and private insurers. However, there is seldom consideration and collection of costs from the patient and the societal perspective, despite recognition that costs of health care services for the patients may affect their utilization and their outcomes (Reference Drummond, Sculpher, Claxton, Stoddart and Torrance3). Data of good quality are essential for the development of appropriate health policies and interventions (4). Data quality refers to a measure of the condition of data based on factors such as accuracy, completeness, consistency, reliability, and timeliness (Reference Sánchez, Iraola, Unanue and Carlin5;6). Cost data are critical when conducting health economic assessments. As such, the reliability of cost data collection methods is particularly important in the context of public policy supporting healthcare management, and with the purpose of building public awareness about the factors that affect health (6;Reference Richards, Coast and Peters7). The use of patient questionnaires confirms that patients’ concerns are increasingly considered in decision making. When considering the patient perspective in economic evaluations, costs incurred by patients need to be measured with appropriate and adapted measurement instruments. As with many questionnaires, cost instruments should undergo psychometric testing and the results should meet accepted standards of reliability, validity, and responsiveness prior to their use in any assessment (Reference Lohr8). Without these properties, instruments will unlikely be widely used in research studies (Reference De Souza, Yap and Wroblewski9;Reference Rattray and Jones10). The reliability plays a central role in developing interpretative validity evidence in general and for the estimation of validity coefficients specifically (Reference Price11).
Reliability refers to (i) the ability of a scale to yield reproducible and consistent results and (ii) the extent to which a questionnaire’s score is free of random error (Reference Streiner, Norman and Cairney12;Reference Smith, Lamping and Banerjee13). An essential element of reliability is that the scores on tests are consistent when they are obtained under similar testing conditions (Reference Price11). The two relevant forms of reliability assessment are internal consistency (where “repeated measurement” is conceptualized as multiple “replicates” or items in a single administration) and test–retest reliability (which concerns consistency of scores across two separate measurements over time and is sometimes referred to as stability or reproducibility) (Reference Polit14). In health research, test–retest reliability is of greater recommended reliability method because it can be used to assess temporal fluctuations (Reference Polit14). The recommended test–retest reliability coefficients are the intraclass correlation coefficient (ICC) for continuous variables and Cohen’s Kappa coefficient for categorical variables (Reference Evans, Mertzanis and Abetz15).
Measurement instruments are often tested for validity and particularly content validity but another dimension that is important to measure is the reliability of an instrument. To our knowledge, there are currently very few costs questionnaires or health resource utilization instruments (Reference Ness, Haase and Kern16) available to measure the different types of health-related costs from the patient’s perspective that reported on the test–retest reliability in the context of economic evaluations. Recently, a comprehensive tool, namely the “Costs for Patients Questionnaire” (CoPaQ), was developed by Laberge et al. (Reference Laberge, Coulibaly and Berthelot17) to measure out-of-pocket costs for patients and their caregivers. The CoPaQ was intended to be applied to a diverse population of patients and is not condition specific. The development of the CoPaQ was conducted with the objective that it would be generalizable to ambulatory care patients in different healthcare systems. This tool measures the nonreimbursed costs (i.e., direct medical, direct nonmedical, and indirect) of a health condition for patients and their informal caregiver (Reference Laberge, Coulibaly and Berthelot17). The CoPaQ is thus recommended to researchers who wish to capture this category of costs in a standardized way. Before this measurement instrument can be used for research or economic evaluations, its reliability must be established (Reference De Souza, Yap and Wroblewski9;Reference Koo and Li18). The purpose of this study was to investigate the test–retest reliability of the CoPaQ.
Methods
Study Design and Participants
A test–retest reliability study design was conducted. To participate in the study, subjects had to be an adult (aged 18 years or older) and a patient meeting the following criteria: (i) have used health services during the reference period (i.e., between 1 Nov 2019 and 31 Jan 2020); (ii) have a condition that requires using healthcare services; and (iii) live in Quebec, Canada. Patients living in institutions were excluded from this study. The survey was conducted in French, the original language in which the CoPaQ was developed.
Sample Size Calculation
A small pilot test–retest was carried out in a previous study with eighteen participants. Based on these pilot data (Reference Laberge, Coulibaly and Berthelot17) and the number of people in Quebec, 385 participants were targeted in the recruitment. This sample size was estimated by setting respectively the statistical power and alpha risk at 95 and 5 percent for a Quebec population of 6.9 million adults. To achieve the target sample size and reduce potential missing data, 400 participants were targeted. We also oversampled to three times this sample size (400 × 3) for the first part of the test since the survey company indicated that there could be a large loss of participants between the test and the retest; generally, between 30 and 40 percent of their panelists participate in a second survey (informal communication). Finally, a total of 1,200 participants were invited to complete the questionnaire at the test. The same participants were then asked to complete the questionnaire again 2 weeks later, that is, at the retest. We closed the survey once the target sample size of 400 was reached.
Recruitment and Data Collection
Respondents were recruited among the online panel members of the survey company Dynata (Plano, TX) and were structured to achieve a random sample according to our eligibility criteria. Participants do not receive a compensation for their participation, but they earn points from Dynata’s partners redeemable for discounts, special offers, and member-only promotions. Data were collected from 14 Feb 2020 through 3 Mar 2020 via an online questionnaire. To carry out the CoPaQ’s test–retest reliability, the same respondents were invited to self-complete the electronic CoPaQ on two occasions, 2 weeks apart, but covering the same period for their costs. A 2-week interval was thought to be long enough for respondents do not simply remember their previous response, but short enough to avoid any major change in condition that could affect their perception of costs and to reduce memory bias.
Instrument/Questionnaire
The CoPaQ is a comprehensive tool to measure direct and indirect out-of-pocket costs of a health condition for patients and their families to various outpatient contexts (Reference Laberge, Coulibaly and Berthelot17). This tool was developed after a systematic review (Reference Poder, Coulibaly, Gaudreault, Berthelot and Laberge19). The objective of this systematic review was to identify validated tools to measure costs associated with a health condition from a patient’s perspective as well as the different components of health-related costs. Nine partially validated tools targeting distinct patient populations were found (Reference Poder, Coulibaly, Gaudreault, Berthelot and Laberge19). These tools measure costs for patients (direct and indirect), intangible costs, and costs for caregivers. Among these studies, few adopted a rigorous development and validation process, as evidenced by the results of our review (Reference Poder, Coulibaly, Gaudreault, Berthelot and Laberge19). In conducting the systematic review, we extracted all the cost elements used in the identified studies to make a preliminary list for the Delphi. The Delphi process involved fourteen panelists: six researchers with a clinical or health economics expertise and eight patients (Reference Laberge, Coulibaly and Berthelot17). Following the Delphi process, a small pilot test–retest was carried out with eighteen new participants on two different occasions separated by a 2-week interval (Reference Laberge, Coulibaly and Berthelot17). The participants of the pilot met the same eligibility criteria as patients from the Delphi panel (Reference Laberge, Coulibaly and Berthelot17). The pilot test–retest allowed to calculate the ICC and Kappa coefficients and to identify the items that lack clarity or that may not be appropriate for, or discriminate between respondents (Reference Rattray and Jones10). Six items that presented comprehension problems were identified and subsequently revised, and three items were removed (Reference Laberge, Coulibaly and Berthelot17). The CoPaQ is composed of forty-one items and subdivided into eight categories: (i) the patient’s costs (sixteen items), (ii) the time spent on accessing medical services (two items), (iii) the costs related to workforce participation (two items), (iv) the patient’s financial distress (one item), (v) the informal caregiver’s costs (seven items), (vi) the informal caregiver’s timer not directly related to medical services (three items), (vii) the patient’s sociodemographic characteristics (nine items), and (viii) a note to researchers (web link to complete the EQ-5D-5L questionnaire, one item). We calculated ICC (Table 1) and Cohen’s Kappa coefficients (Table 2) on eight and twenty-four items, respectively. We also calculated the median value of ICCs and Kappa coefficients to represent central tendencies that are not influenced by extreme scores or outliers. In total, three (6.1, 6.2, and 6.3) of the eight ICC items and three (5.5, 5.6, and 5.7) of the twenty-four Kappa items were specific to patients with an informal caregiver.
Table 1. Intraclass Correlation Coefficient (ICC) Results

Table 2. Kappa Results

Statistical Analysis
Once we completed data collection for the test–retest, we analyzed the distribution of responses for each item to find out the potential outliers. The descriptive statistics for the sociodemographic variables (i.e., age, gender, matrimonial status, education, income, urban or rural area) were determined. A reliable (or consistent) response to a question was defined as one where the same response level was provided at both time periods (Reference Al-Janabi, Flynn, Peters, Bryan and Coast20). The reliability was assessed by calculating the Kappa coefficient and ICC. The ICC statistic is the most suitable and most commonly used reliability parameter for continuous measures (Reference Terwee, Bot and de Boer21). The ICCs are reported with their 95 percent confidence intervals and the formula is
ICC = [MSP − MSE]/[MSP + (k − 1) MSE + (k/n) (MS0 − MSE)], where MSP is the mean square for participants, MSE is the mean square for error, MS0 is the mean square for observers, n is the number of participants, and k is the number of observers/measurements (Reference Koo and Li18). The Kappa statistic is a measure of “strength” agreement for categorical variables. It indicates the proportion of agreement beyond that expected by chance, that is, the achieved beyond-chance agreement as a proportion of the possible beyond-chance agreement (Reference Sim and Wright22). The Cohen’s Kappa coefficient (k) is calculated with the following formula: k = [Pr(a) − Pr(e)]/[1 − Pr(e)], where Pr(a) represents the actual observed agreement, and Pr(e) represents agreement by chance (Reference Streiner, Norman and Cairney12). Interpretations of ICC coefficients and Kappa values are suggested in Table 3 (Reference Koo and Li18;Reference Landis and Koch23;Reference Feinstein and Cicchetti24). To observe the outliers’ impact on the results, a sensitivity analysis was carried out. The analysis consisted of subdividing all the items into four categories as follows: category 1 (items 1.3, 1.5, 2.1, 2.2, and 3.2), category 2 (items 6.1, 6.2, and 6.3), category 3 (items 1.1, 1.2 [1.2.1, 1.2.2, 1.2.3, 1.2.4], 1.4, 1.7, 1. 8, 1.12, 1.14, 1.15, 1.16, 3.1, and 4.1), and category 4 (items 5.1, 5.2, 5.5, 5.6, and 5.7). We considered these subgroups because participants’ responses over time could be affected by these subgroups’ items. The categories 1 and 3 were related to items specific to the patients, and the categories 2 and 4 were related to items specific to the informal caregivers. Next, the median values of the ICC (categories 1 and 2) and Kappa coefficients (categories 3 and 4) were determined before and after the outliers’ exclusion. All analyses were performed using the statistical software R version 3.4.4 (2018-03-15). The statistical significance level was set at 5 percent for a two-tailed test.
Table 3. Interpretation of Intraclass Correlation Coefficient (ICC) and Cohen’s Kappa
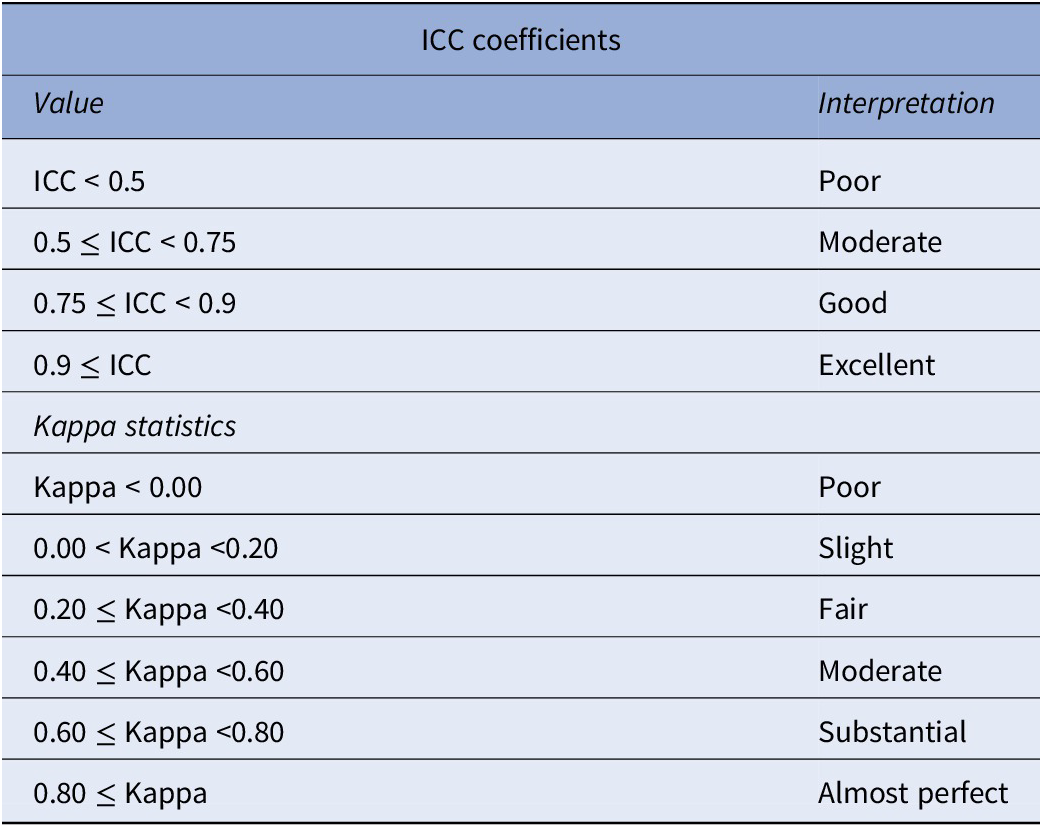
Koo and Li (Reference Koo and Li18); Landis and Koch (Reference Landis and Koch23); Feinstein and Cicchetti (Reference Feinstein and Cicchetti24).
Ethics
Ethics approval was obtained from the research ethics committee of the CIUSSS de l’Estrie-CHUS (Project #2019-3102–Écosanté 2). The data collected for this study were anonymous and only an identification code provided by the survey company could identify respondents. The confidentiality of the data was respected. Completing the survey online was considered as a consent to participate.
Results
One thousand and two hundred individuals participated in the first round of the test–retest reliability, and out of these, 403 participants completed both the test and the retest with a mean completion time of 8 min (SD of 5 min). After the two rounds, twenty-four respondents (5.9 percent) were excluded from further analysis because their sociodemographic information between the test and retest was highly inconsistent. For example, when the participant reported a different sex during the two rounds. Twenty-four outlier responses were identified from six ICC items, respectively, one (item 1.3), four (item 1.5), ten (item 2.1), three (item 2.2), four (item 6.2), and two (item 6.3). Each outlier response was imputed by the average of the responses to the test or retest of each concerned item (Reference Boulan25). Finally, the sample size used in the analysis was 379 participants, of which nineteen participants reported having an informal caregiver during their consultations at the healthcare center. The mean age of the respondents was 55 years, 48.29 percent were men and 51.71 percent were women and, 63.32 percent were married or partnered (Table 4). Half of this population had no paid job at the time of the survey, and nearly one-third lived in rural areas (Table 4). More detailed information regarding respondents’ characteristics is reported in Table 4. For each item of interest, only individuals that responded to the test and retest were considered to estimate the ICC and the Kappa coefficients.
Table 4. Characteristics of Test–Retest Participants

The test–retest reliability results show quite varied indices of temporal stability for both ICC and Kappa items. The results indicated that the range of values of ICC was from −0.00 to 0.98 [median (0.5) and interquartile range (Q3–Q1) (0.76–0.17)] and was poor (items 2.1, 2.2, 6.1, and 6.3), moderate (item 1.5), good (items 1.3 and 6.2), and excellent (item 3.2) (Table 1). The range of values of Kappa coefficients was from −0.004 to 0.65 [median (0.41) and interquartile range (0.51–0.26)] and was poor (item 1.11), slight (items 1.1, 1.2.2, 1.6, 1.9, and 5.6), fair (items 1.2.4, 1.10, 1.13, 1.15, 1.16, 5.1, 5.2, and 5.5), moderate (items 1.7, 1.8, 1.14, 3.1, 4.1, and 5.7), and substantial (items 1.2.1, 1.2.3, 1.4, and 1.12) (Table 2).
During this study, we asked participants for their opinion on the most appropriate period that should be covered to reduce the memory loss of the small ticket items. Among the respondents, 21.59 percent favored a 1-month period, 47.89 percent a 3-month period, 14.64 percent a 6-month period, 13.15 percent a 12-month period, and 2.73 percent had no opinion.
The sensitivity analyses indicated for the first category (i.e., items 1.3, 1.5, 2.1, 2.2, and 3.2), a median value of ICC at 0.30 before the exclusion of outliers. After the exclusion, the ICC ranged from 0.21 to 0.98 (median 0.70) (Table 5). For the second category (i.e., items 6.1, 6.2, and 6.3), the median value of ICC was 0.12 before the outliers’ exclusion. After the exclusion, the ICC coefficients ranged from −0.00 to 0.76 (median 0.04) (Table 5). For the third category (items 1.1, 1.2 [1.2.1, 1.2.2, 1.2.3, 1.2.4], 1.4, 1.7, 1.8, 1.12, 1.14, 1.15, 1.16, 3.1, and 4.1), the median value of the Kappa coefficient was 0.44 before the outliers’ exclusion. After the exclusion, the Cohen’s Kappa coefficients ranged from 0.09 to 0.65 (median 0.46). For the fourth category (items 5.1, 5.2, 5.5, 5.6, and 5.7), the median value of the Kappa coefficient was 0.32 before the outliers’ exclusion. After the exclusion, the Cohen’s Kappa coefficients ranged from 0.13 to 0.41 (median 0.30) (Table 5).
Table 5. Sensitivity Analyzes Results

ICC, intraclass correlation coefficient.
Discussion
In this study, the reliability of the self-administrated questionnaire for measuring the costs of a health condition for patients and their families (CoPaQ) was evaluated by the test–retest method. We found that the ICC coefficients varied from −0.00 to 0.98 (median 0.5) and the Kappa coefficients varied from −0.004 to 0.65 (median 0.45). The reliability test of the CoPaQ indicated that this instrument has a moderate reliability in terms of ICC (Reference Koo and Li18) and Kappa coefficients (Reference Landis and Koch23;Reference Feinstein and Cicchetti24).
We cannot compare these results with any other of similar patient costs tools because none of the tools that we identified in a systematic review had undergone such reliability testing using a test–retest (Reference Poder, Coulibaly, Gaudreault, Berthelot and Laberge19). The questionnaire’s reliability was examined by using tests of internal consistency in two included studies (Reference Lerner, Amick and Rogers26;Reference Duncan, Murphy and Man27). Therefore, the findings of our study that were estimated in terms of ICC and Cohen’s Kappa coefficients are not comparable to those produced by other studies. This would appear to confirm that our study seems to be the first to assess a test–retest reliability of a cost for patients questionnaire ICCs and Cohen’s Kappa coefficients.
In this study, reliability refers to the stability of the measuring instrument: a reliable instrument will obtain the same results or almost with repeated administrations of the test (Reference Sikandar and John28). The results of this study provide an idea of the reliability of the CoPaQ used to measure patient costs, which is of great interest for researchers conducting economic evaluations of healthcare interventions. Our results compare well with a previous pilot test–retest conducted on the CoPaQ with a small sample (n = 18). The results of this pilot showed that the ICC varied from −0.02 to 0.99 (median 0.62) and the Kappa coefficients varied from −0.11 to 1.00 (median 0.86) (Reference Laberge, Coulibaly and Berthelot17). These results suggested that the pilot version of the CoPaQ had a moderate to good reliability in terms of ICC and gives consistent results between the two measurement periods in terms of Kappa coefficients. However, these results must be interpreted with caution. The median coefficient values of ICC and Kappa dropped significantly when calculated with a larger sample size. There are a number of possible explanations of this difference. First, sociodemographic characteristics of participants in the pilot were different from those of the larger sample size. For instance, 10 percent of participants in the pilot were unemployment and 5.5 percent lived in rural areas, while in the larger sample size, half had no paid job at the time of the survey, and nearly one-third lived in rural areas. Another explanation is that respondents in the pilot test–retest may have responded more carefully than those recruited by the survey company. Participants of the pilot test–retest were recruited through the research team members’ networks, whereas those recruited by the survey company were rewarded for completing surveys, which could affect the time that they spend on each survey.
Considering an item-by-item analysis, several items did not reach the threshold of the moderate value of the reliability coefficient (between 0.41 and 0.60) (Reference Landis and Koch23;Reference Bujang and Baharum29). There has been considerable debate in the literature regarding the most appropriate threshold of the reliability coefficient (Reference Streiner, Norman and Cairney12). According to some authors, there is no “cut-off” point associated with an appropriate coefficient threshold (Reference Costa-Santos, Bernardes, Ayres-de-Campos, Costa and Costa30;Reference Fortin31). A high test–retest reliability (ICC = 0.96) was found for the item 3.2 (“What is your rough estimate [net amount] of the incurred loss of income?”) in this study. This suggested that the participants’ responses were highly stable for this item because the patient out-of-pocket costs could have a direct effect on their loss of income. In contrast, a lower ICC (−0.00) was obtained for the item 6.3 (“How long is the estimated waiting time experienced by your caregiver or the person accompanying you during your nonmedical consultations [e.g., massotherapy, chirotherapy, naturopath]?”). This low ICC implies either a lack of stability of the informal caregiver’s waiting time or a lack of stability of the measure (Reference Grafton, Foster and Wright32). Another possible explanation is that the respondents were not directly concerned by this item. This result is not surprising because the informal caregivers were not asked directly about the waiting time during all the medical consultations. The 3-month period chosen in this study as time frame could also lead to a memory bias because the participants did not remember the waiting time spend by their informal caregivers.
The lack of stability of some items (e.g., cost and time) over time suggested that participants responded differently between the two periods, leading to a high variability. This is more reflected with items that do not affect them directly (e.g., items specific to the informal caregivers). This situation could be due to participants having less knowledge of their informal caregiver’s expenses. The reactivity effect, which is a systematic factor that can affect stability in over time, could also be a reason. Reactivity refers to a phenomenon in which respondents are sensitive to the specific issues examined by an instrument and demonstrate a change in their response at the second time (Reference Torkzadeh and Doll33). Generally, it occurs when respondents who are unfamiliar with the items think about questions between the two points in time and the phenomenon is particularly common when respondents are not used to answering detailed questions (Reference Torkzadeh and Doll33). There are reasons to believe that reactivity effect could be larger in our study for the items of cost and time. In fact, the CoPaQ is a new instrument and participants should remember the cost or time related to the use of health services in the past 3 months. This time frame could lead to participants forgetting small ticket items and time elements. It is most likely that between the test and retest, participants remember some amounts and duration and modify their response at the retest 2 weeks later.
In the sensitivity analyses, the reliability coefficients based on the items which were specific to the patients (category 1 and 3) were higher than those that were specific to the informal caregivers (category 2 and 4), indicating a better reliability of items concerning specifically the participants. This finding suggests that if the informal caregivers could complete themselves the items that are specific to them, the reliability rates could potentially be increased.
The CoPaQ could be administered by an interviewer or be self-administered. In this study, the time spent for the self-administration (including reading the explanation and the instructions, and completion time) was about 8 min. When addressing parsimony in an instrument, it is useful to think of both length and psychometric properties (Reference Ferketich34). The length of the questionnaire and the completion time are very important because they could impact the nonresponses and the missing data rates. For example, in their comments, some participants considered that the CoPaQ was too long to complete. However, an 8-min mean completion time seems appropriate in light of the literature which reports a completion time between 5 and 10 min for a similar type of questionnaire (Reference Juniper, Guyatt and Epstein35). Although the time frame can easily be determined by researchers to align with their study objective, the majority (47.89 percent) of the participants favored a 3-month period recall. This period should allow them to reduce the oversight of the small ticket items.
Strengths and Limitations
The study has multiple strengths. First, we planned for and recruited more participants than the minimum size requirement to make up for any possible loss of data due to dropouts or missing data (Reference Bujang and Baharum29). The test–retest with these larger sample and diverse patient groups followed a rigorous process as described in this study. Second, the format of the CoPaQ is suitable for data analysis and the nonresponse rate in this study was relatively low during the test and the retest. The study also has some limitations. Firstly, using a survey company has disadvantages, because the participants are not like those in a clinical trial who have a vested interest in the study. Hence, there could be poor engagement. Secondly, no further psychometrics properties were evaluated apart from the content validity in previous studies (Reference Laberge, Coulibaly and Berthelot17;Reference Poder, Coulibaly, Gaudreault, Berthelot and Laberge19) and the measure of the test–retest reliability, and such tests could be conducted in the future to increase the thoroughness of the CoPaQ. Despite this, we believe that there are several reasons why the CoPaQ can be used in the field. First, the way in which it was developed ensures content validity in that it is comprehensive and represents costs that are important to patients and their informal caregivers (Reference Laberge, Coulibaly and Berthelot17). Second, the process used to construct the CoPaQ is well established and has been used successfully in constructing specific questionnaires for patients (Reference Juniper, Guyatt and Epstein35).
Study Implications and Future Research
In practice, estimating the stability of test scores involves administering the same test to the same people twice in as similar conditions as possible. Once the data are collected, one correlates the scores of two test administrations. Reliability estimation yields a coefficient of stability. From this coefficient, a researcher could know how consistently people respond to the same test at different times. In this context, the interest is in how a person’s observed scores are stable over time. Kappa scores indicate how the observed values compare themselves to the expected values for each item. We note that for some items interpreted as “slight” or “fair,” the level of agreement is very high, but Kappa scores may be affected by the high expected scores. Researchers may consider not only ICC and Kappa overall scores but also the level of agreements on each item to make their own judgment. The CoPaQ may be useful for researchers who would like to measure patient-related costs as well as their informal caregivers’ costs. The participants were consulted about the best time frame to reduce the memory loss of the small ticket items. Their responses helped us to recommend a 3-month recall period for CoPaQ users. The validity and responsiveness tests should be evaluated in the future. A user guide is currently under development and will be made available to researchers wishing to estimate costs from the data set collected with the CoPaQ. Finally, a translation of the CoPaQ into English was foreseen.
Conclusion
Based on the findings of this study, we can conclude that the CoPaQ has a moderate reliability in terms of ICC and Kappa coefficients. The moderate test–retest reliability (i.e., approximately half of values are similar over time) observed gives additional support for the applicability of this tool in economic evaluations. The CoPaQ could be used by researchers who wish to capture out-of-pocket costs of a condition for patients and their caregivers. Additional studies including on other properties (validity, responsiveness) and a cultural adaptation could further enhance the use of the tool.
Ethics approval
The study protocol was approved by the research ethics committee of the CIUSSS de l’Estrie-CHUS (Project #2019-3102—Écosanté 2). All participants were familiarized with the purpose and principles of the study and informed about the possibility of withdrawing from the study at any stage.
Consent to participate
An online informed consent was obtained from all subjects included in the study. Data collected in the study were anonymized and do not allow identification of individual study participants.
Funding statement
This study was funded by the Quebec Support Unit of the Strategy for Patient Oriented Research (SPOR). The funder had no role in the design and conduct of the study; collection, management, analysis, and interpretation of the data; preparation, review, or approval of the manuscript; and decision to submit the manuscript for publication.
Conflicts of interest
The authors declare that they have no conflicts of interest.
Author contributions
Acquisition of data: T.G.P., L.P.C., M.L.; Analysis and interpretation of data: T.G.P., L.P.C., A.I.H., B.C., M.L.; Concept and design: T.G.P., L.P.C., M.L.; Critical revision of the paper for important intellectual content: T.G.P., L.P.C., M.L., A.I.H., B.C; Drafting of the manuscript: L.P.C., A.I.H; Methodology: T.G.P., L.P.C., A.I.H., M.L. All authors were involved in revising the article and approved the final manuscript.


 Open access