


1. Introduction
Forest gene resource management is a daunting task requiring balancing utilization and conservation goals (Yanchuk, Reference Yanchuk2001) for large, long-lived organisms covering vast ecological regions (Ying & Yanchuk, Reference Ying and Yanchuk2006). While the genetic improvement of economic traits is of primary importance, the maintenance of broad genetic diversity is essential to meeting changing breeding goals (Namkoong et al., Reference Namkoong, Kang and Brouard1988) and guarding against unpredictable temporal and global environmental contingencies such as climate change (Eriksson et al., Reference Eriksson, Namkoong and Roberds1993). Most tree improvement programmes follow recurrent selection schemes, consisting of multiple populations, including base populations where initial phenotypic selections are made, breeding populations where crosses among the selected individuals are created and tested and deployment populations (e.g. seed orchards) harbouring elite genotypes for seed production (Namkoong et al., Reference Namkoong, Kang and Brouard1988). Breeding arboreta are commonly established to safeguard the genetic legacy of original and subsequent selections and to facilitate breeding. Breeding populations are managed to maintain higher levels of genetic variability for sustained long-term genetic response while capturing genetic gain is the sole function of production populations (Namkoong et al., Reference Namkoong, Kang and Brouard1988).
Predetermined mating designs are considered essential for creating structured, pedigreed families for genetic testing, facilitating accurate assessment of genetic parameters (breeding values, heritabilities, genetic gain, genetic variances and covariances and genotype–environment interactions), and the selection of elite genotypes for advanced breeding and seed orchards establishment (Lambeth et al., Reference Lambeth, Lee, O'Malley and Wheeler2001). Forest geneticists often use rather complex schemes, such as the disconnected partial diallel mating design (Namkoong, Reference Namkoong1979) to meet these objectives; however, the large numbers of crosses create logistical difficulties requiring years to complete and often the parental authenticity of the resulting offspring is not error-free (Adams et al., Reference Adams, Neale and Loopstra1988; Devey et al., Reference Devey, Bell, Uren and Moran2002). Phenotypic selection was proposed by Cotterill (Reference Cotterill1986) and its efficiency was evaluated by Andersson et al. (Reference Andersson, Spanos, Mullin and Lindgren1998) to simplify and reduce tree breeding efforts. However, while simple, phenotypic selection is expected to cause cryptic build-up of coancestry along the selection cycles; thus the incorporation of genetic markers and parentage analyses would be of great value for this scheme implementation.
The recent development of highly informative DNA markers and advanced pedigree reconstruction methods made it possible to determine the genealogical relationships among offspring produced from natural mating among individuals (see Jones & Ardren, Reference Jones and Ardren2003 for a review). Attempts to incorporate the use of DNA markers and parentage analysis into tree breeding were made by Lambeth et al. (Reference Lambeth, Lee, O'Malley and Wheeler2001) and Grattapaglia et al. (Reference Grattapaglia, Ribeiro and Rezende2004) ; however, these were proposed to meet specific scenarios such as the complementary polycross mating design and a special case of Eucalyptus inter-specific hybridization, respectively (see the Results and discussion section). In the present study, we extended the pedigree reconstruction approach to open-pollinated managed forest tree breeding populations for reconstructing mating relationships without making crosses and using the result to estimate genetic parameters for parental genetic evaluation and selection of superior individuals. Our approach allows the capture of a substantial amount of the genetic gain attained through conventional tree breeding. This is accomplished without any controlled pollination and simplified testing and the approach could be extended to eliminate the use of elaborate experimental field testing altogether. The method, called ‘breeding without breeding’ (BWB), combines the use of phenotypic or genotypic pre-selection of superior individuals to minimize fingerprinting efforts, pedigree reconstruction of offspring to assemble naturally created full- and half-sib families and quantitative genetics analyses to identify elite genotypes. We demonstrated our method using a retrospective study of Douglas-fir (Pseudotsuga menziesii (Mirb.) Franco) consisting of progenies produced from 150 controlled crosses among 60 parents and established on three sites. These findings were supported by theoretical expectations demonstrating expected minimum genetic gain compared with conventional approaches.
This is the first large-scale, operationally oriented study demonstrating the utility of partial- or full-pedigree reconstruction to assemble naturally created full- and half-sib families for forest trees breeding and extends the results to propose not only avoiding crosses, but also to simplify or even bypass traditional progeny testing.
2. Materials and methods
(i) Plant materials (retrospective study)
Eight-year height data from a subset of large-scale Douglas-fir progeny trials described in Yanchuk (Reference Yanchuk1996) was used to illustrate BWB. In brief, the data consisted of ten 6-parent disconnected partial diallels planted in replications over three test sites, where each individual (a total of 7442) is identified by site, replication and its male and female parents.
(ii) Simulation of BWB
The original data set (both parents known: full-sib model (FS model)) is regarded as the benchmark for comparisons. To illustrate the utility of BWB, two strategies were modelled, the first (half-sib model (HS model)) where all male parents' information was ignored, thus resembling the classical half-sib progeny trial (Namkoong, Reference Namkoong1966). While in the second (phenotypic-selection model (PH model)), all parents were considered unknown, representing completely unstructured field progeny trial. Modelling BWB's strategies preceded the following three steps:
Step 1 – Data analysis. Data analysis under all models (FS, HS and PH) utilized the mixed model fitted with the ASReml software (Gilmour et al., Reference Gilmour, Gogel, Cullis and Thompson2006), featuring the restricted maximum likelihood to partitioning the phenotypic variance into causal components. Under the FS model, the evaluation followed the diallel mating scheme (Griffing, Reference Griffing1956) where the best linear unbiased prediction (BLUP; Henderson, Reference Henderson1975) utilizing the animal genetic evaluation model resulted in prediction of additive genetic (=breeding) values (BV FS), optimally combining measurements on all individuals in the pedigree (Lynch & Walsh, Reference Lynch and Walsh1998). Genetic evaluation under the HS model followed the same animal genetic model, while assuming simple half-sib genetic evaluation (only female parents were revealed in forming the additive relationship matrix) and individuals' breeding values (BV HS) were predicted. Under the PH model, ANOVA was used to produce site-adjusted phenotypic values by removing site and replication effects, thus increasing the power of detecting genetic differences.
Step 2 – Genotypic or phenotypic pre-selection. To substantially reduce the fingerprinting efforts under the HS and PH models, we applied the phenotypic pre-selection method described in El-Kassaby & Lindgren (Reference El-Kassaby, Rudin and Yazdani2007) and extended the concept to include genotypic pre-selection. Simply, all individuals were ranked based on either their BV HS or site-adjusted phenotypic values followed by truncation selection. The selection intensity applied varied among the studied scenarios (see below).
Step 3 – Pedigree reconstruction. Pedigree reconstruction was simulated on truncated, pre-selected populations consisting of 2000 individuals for the PH model and 500, 1000 and 2000 for the HS model. We assumed 100% success rate of the pedigree reconstruction; thus male parents were revealed for all individuals in the truncated HS population(s) or both parents for the PS model.
Step 4 – Forward selection. We used a mathematical programming framework to optimize genotypic contributions to the deployment population (seed orchard) and thereby the response to selection is maximized. The objective function is formulated as
where ○ is the n×1 vector of predicted breeding values and p is the corresponding vector of genotypic contributions, subject to the optimization, where ![]() and 0⩽pi
⩽1, and n is the total number of selection candidates (both parents known), which depends on the strategy used (Step 3).
and 0⩽pi
⩽1, and n is the total number of selection candidates (both parents known), which depends on the strategy used (Step 3).
To maintain a desired level of gene diversity, the solution is constrained by the following function that sets a minimum effective population size value:
where A is the n×n additive relationship matrix (Henderson, Reference Henderson1984) and θmax is the maximum group coancestry, converted from the minimum effective population size (status number, N S, Lindgren et al., Reference Lindgren, Gea and Jefferson1996)
Note that when A is a scalar matrix of the form 0·5I (where I is the identity matrix), the solution is equal to the Linear Deployment method of Lindgren & Matheson (Reference Lindgren, Cui, Son and Sonesson1986), and in such a case, the resulting contributions are in linear association with corresponding breeding values. In other cases (including scenarios of the current study), the association deviates from the linearity.
The optimization was conducted using the MOSEK® software (Anonymous, 2002). It solves large-scale mathematical optimization problems, including linear, quadratic and quadratically constrained ones and general convex nonlinear problems, covering all scenarios presented in the current study. Further, optimality tolerance level was controlled and purposely set high (using the default value of 10E-07), suggesting that the optimization output is within the 0·00001% range of the true optimum. From the practical point of view, we therefore regard all results as optimum.
Variance of the genetic response (eqn 1) is
where σ2(○ i) is the variance associated with the selection criterion prediction in the ith individual, and σ{○ i, ○ j} is the expected genetic covariance between individuals i and j. In this study, we assumed that ![]() , where
, where ![]() is the additive genetic variance and r i, j is the fraction of the additive genetic variance appearing in the covariance (Falconer & Mackay, Reference Falconer and Mackay1996). The contribution of additional genetic effects to the covariance was assumed negligible (Hill et al., Reference Hill, Goddard and Visscher2008).
is the additive genetic variance and r i, j is the fraction of the additive genetic variance appearing in the covariance (Falconer & Mackay, Reference Falconer and Mackay1996). The contribution of additional genetic effects to the covariance was assumed negligible (Hill et al., Reference Hill, Goddard and Visscher2008).
Confidence intervals for the genetic response prediction were constructed as follows:
where t* is the critical value for the t distribution.
(iii) Theoretical efficiencies of HS and PH strategies
Three possible sources of information enter the genetic evaluation, i.e. the phenotypic measurement of an individual (P 1, all strategies), the average record of m respective half-sibs (P 2, HS and FS), and that of n full-sibs (P 3, FS). Correspondingly, we constructed a selection index (Smith, Reference Smith1936; Hazel, Reference Hazel1943)
where the b's are weighting factors, optimizing the three sources of information relative to the index value (selection criterion). The solution is provided by
where (using the rules described in Rönningen & Van Vleck (Reference Rönningen and Van Vleck1985) and assuming a single measurement per individual)
and

where h 2 refers to the narrow-sense heritability, and σP2 is the phenotypic variance. The first, second and third rows in G (and corresponding columns in P) refer to the inclusion of respective information under PH, HS and FS strategies. The accuracy of selection (correlation between the index and true breeding value) is then
where σA2 is the additive genetic variance.
Under the PH strategy, r IA(PH)=h, considering only the first row (column) of the G (P) matrices. Inclusion of the second row (column) leads to the accuracy of selection under the HS strategy r IA(HS), and in the same way, inclusion of all three rows (columns) leads to the accuracy of selection under the FS strategy r IA(FS).
Predicted genetic response to selection (Falconer & Mackay, Reference Falconer and Mackay1996) is
where i is the selection intensity.
Assuming i and σA remain constant across strategies, relative efficiencies of the PH and HS over FS are E PH/FS=r AI(PH)/r AI(FS), and E HS/FS=r AI(HS)/r AI(FS), respectively. Despite the assumption made to accommodate the current material, the comparison methodology is general to include unequal heritabilities or selection intensities.
3. Results and discussion
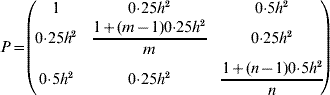
Compared with the FS analysis, the HS strategy approximately captured 85% of the genetic gain across all N S values (Fig. 1). Furthermore, all HS truncations (500, 1000 and 2000) produced the same genetic response irrespective of the applied pre-selection intensity. The PH strategy produced even more surprising results, capturing 75% of the genetic gain available under the FS model across all the diversity range (N S values, Fig. 1). As expected, under the HS and PH strategies, any increase in genetic diversity was associated with a steady decrease in genetic gain, mirroring that of the original FS analysis. Selection intensity played an important role in determining the relative efficiency magnitude of BWB's partial (HS) and full (PH) pedigree reconstruction methods to that of the conventional breeding (FS) (Fig. 2). Additionally, the observed relative efficiency showed steady improvement with increase in the heritability estimate of the trait under question (Fig. 2).
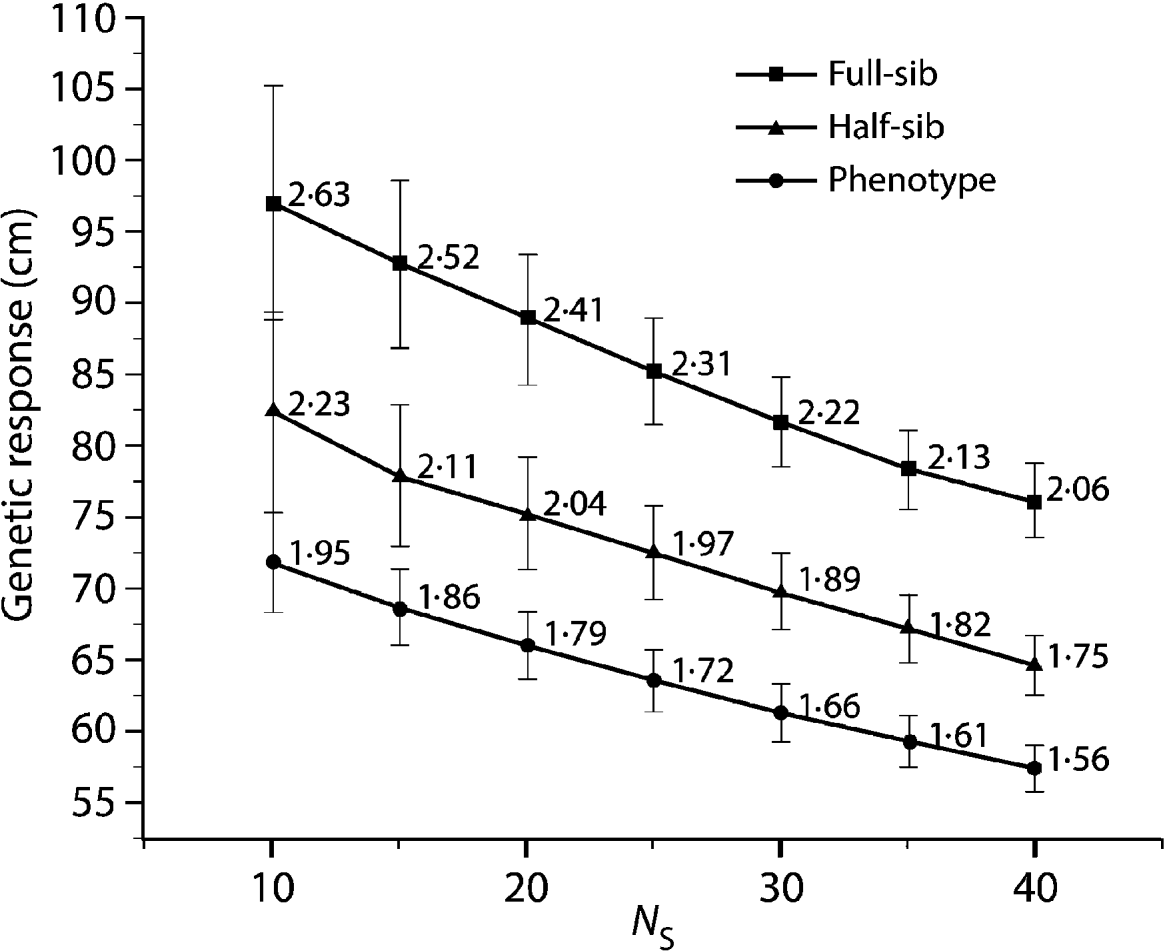
Fig. 1. Eight-year height average breeding value (genetic response) comparison for the HS and PH models relative to the diallel (FS) model for a range of effective population sizes (N S=10–40), values are plotted along with 95% confidence intervals. Data labels indicate genetic response in units of standard deviation from a candidate population mean of (0·0).

Fig. 2. BWB's theoretical relative efficiency for the HS and PH models to the diallel (FS) model for heritability values of 0·1 and 0·3 over ranges of different HS and FS family sizes.
Unlike crop improvement programmes where the best genotypes are commonly released, forestry deployment concurrently considers balancing genetic gain and diversity, even if gain is intentionally sacrificed (El-Kassaby & Askew, Reference El-Kassaby, Askew, Walter and Carson2004). Therefore, the observed decline in average genetic gain with increased diversity is not a cause for concern and in fact most deployment populations (seed orchards) harbour a high number of parents, so the commonly observed attrition in reproductive output among orchard's parents is buffered (El-Kassaby et al., Reference El-Kassaby, Fashler and Crown1989a; Roberds et al., Reference Roberds, Friedman and El-Kassaby1991; Savolainen et al., Reference Savolainen, Karkkainen, Harju, Nikkanen and Rusanen1993; Lindgren et al., Reference Lindgren and Matheson2004).
The observed trend of genetic gain, over the range of diversity, followed theoretical quantitative genetics expectations (Falconer & Mackay, Reference Falconer and Mackay1996) with reduced efficiency from FS to HS to PH (Fig. 1). The genetic gain captured by either the HS or PH strategy relative to the FS model is striking, given the reduced effort associated with the former methods. Conventional breeding programmes are structured around systematic repeated cycles of breeding, testing and selection requiring substantial planning and resources. Our BWB strategies require much less effort and capitalize on the assembly of natural crosses among selected parents (see Fig. 3, for methods' timeline comparison). This approach could be extended to existing operational regeneration plantings such as single or mixed family blocks (McKeand et al., Reference McKeand, Mullin, Byram and White2003) as a substitute for classical progeny testing trials. In the case of single family blocks where maternal parents are known, individuals are ranked based on their BV HS and partial pedigree reconstruction is only required for the truncated portion to identify the paternal parent. The efficiency of selecting within single family blocks is proportional to the number of deployed families. In cases where few higher-ranking families are deployed to maximize the response to selection (i.e. high selection intensity), then selection within these families is not recommended as it leads to a substantially reduced effective population size (N e), and it would minimize our ability to attain high gain through the identification of superior offspring. This can be explained by the relatively small variation that exists among these elite families, as opposed to that of within-family (Lstibůrek et al., Reference Lstibůrek, Mullin and El-Kassaby2006). So, we recommend this approach only when a large number of families exist or selection from the simplified HS testing after revealing the full pedigree of the candidate population. On the other hand, when mixed family blocks are used, full pedigree reconstruction is required on the phenotypically selected individuals to determine their maternal and paternal parents. If ‘operational’ plantings will be considered as a substitute for ‘groomed’ progeny testing trials, then it is recommended that site spatial variation removal techniques should be implemented to improve the efficiency of either genotypic and/or phenotypic pre-selection and thus increase the effectiveness of truncation selection. Site spatial variation removal techniques are commonly used as a tool for detecting global site heterogeneity or environmental gradients in agriculture and forestry (Dutkowski et al., Reference Dutkowski, Costa-Silva, Gilmour and Lopez2002; Cappa & Cantet, Reference Cappa and Cantet2007). When unstructured populations are used, it should be expected that the precision of the estimated genetic parameters would be lower than expected from the FS option (see below). The PH selection method is presented to highlight the range of options available with the use of DNA fingerprinting and pedigree reconstruction. This option should be considered in situations where modest gain increments are better than no gain. For example, when breeding resources are distributed among multiple species and/or among several breeding zones within a species, programmes are always restricted to species or zones with the highest return on investment (ROI). The use of the PH option would offer an opportunity to include some of the economically lesser species and/or extend testing to zones with lower ROI.
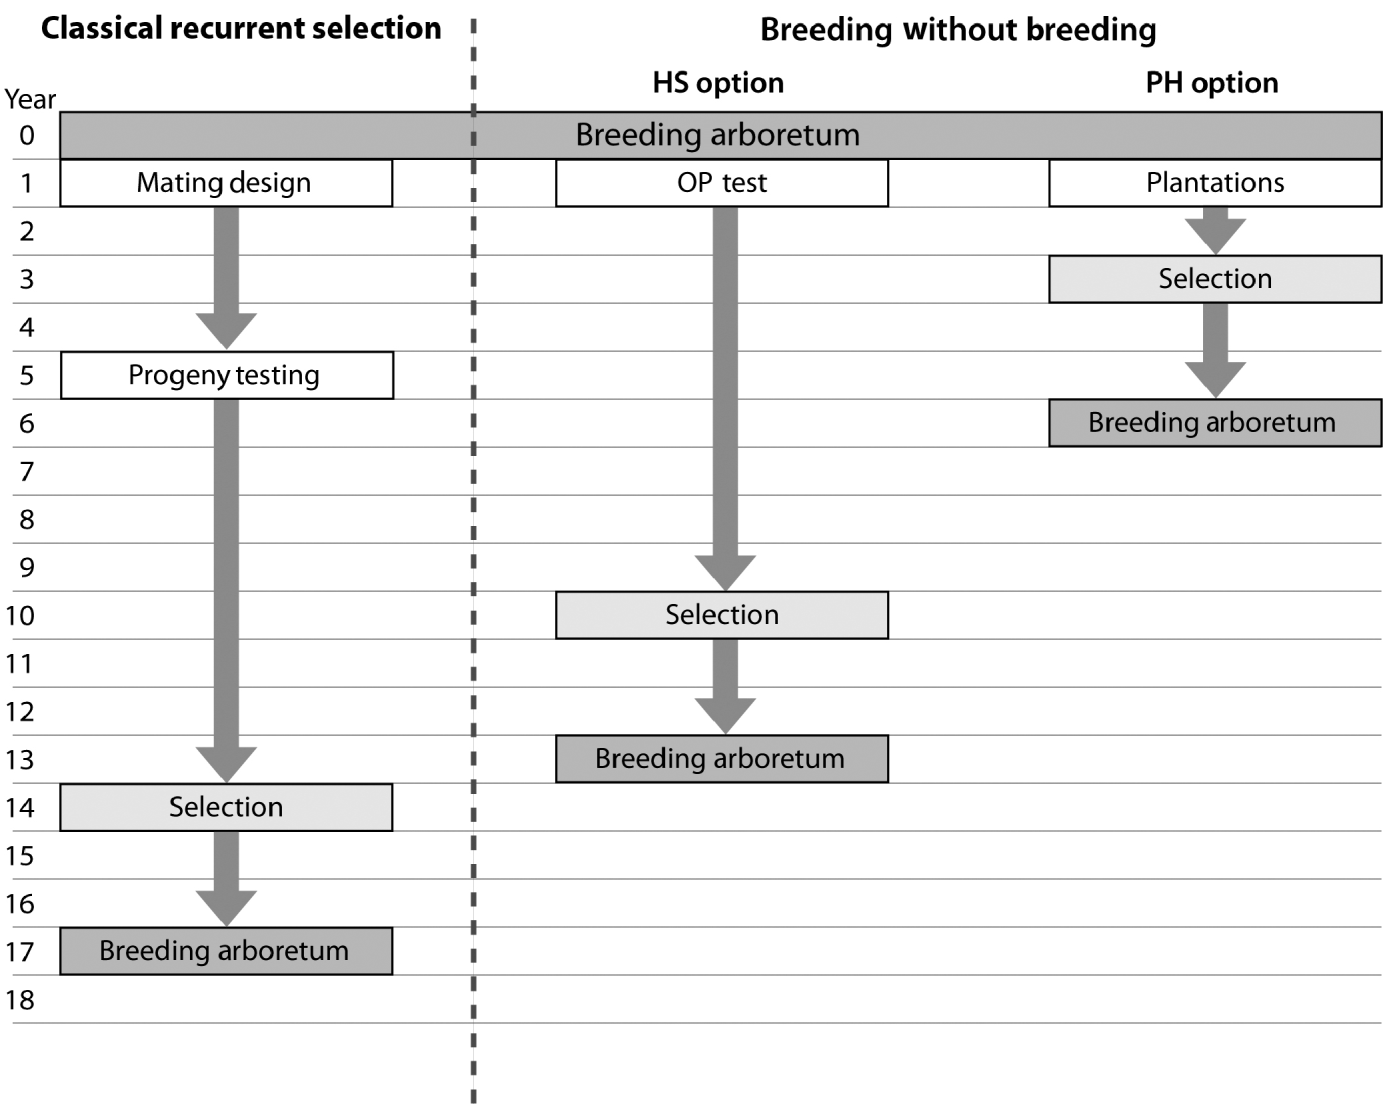
Fig. 3. Flowchart depicting the timeline for a ‘classical’ recurrent selection scheme and the two BWB proposed options (HS: simplified OP testing; PH: no testing (mass selection)). This comparison assumes that the initial breeding arboretum is sexually mature, with already established plantations of mixed families, and progeny evaluation is conducted 8 years after planting followed by selection and the establishment of the next generation breeding arboretum 2 years after selection. Both BWB options assume that phenotypic assessment, site variability removal, genetic and/or phenotypic ranking and truncation are conducted in 1 year and DNA fingerprinting is conducted the following year. Infusion through the use of supplemental-mass-pollination and introduction of new tested and/or untested parents is assumed for all breeding arboreta.
Our method provided the means to estimate the genetic parameters, particularly breeding values and coancestry, needed for capturing genetic gain and managing diversity. Genetic parameters obtained from structured mating designs and conventional testing, while potentially more accurate, are associated with a substantial amount of added efforts and costs that do not necessarily contribute much to the captured gain. The retrospective study demonstrated the usefulness and applicability of BWB; however, it should be pointed out that all the presented genetic gain estimates were relative to and dependent on the available information from the FS model. Accordingly, we derived a simplified method to predict the relative efficiency of partial (HS) and full pedigree (PH) reconstruction strategies over that of the commonly practised FS evaluation (Fig. 2). The theoretical method developed is solely based on the original breeding or phenotypic values produced from the pre-selected individuals for either the HS or PH strategy; thus it represents minimum baseline gain estimates. According to our theoretical quantitative evaluation, narrow-sense heritability and the within-population genetic relatedness (size of FS and HS families) are the two key factors affecting the relative genetic efficiency of BWB.
Using the 8-year height's narrow sense heritability estimate from the FS analysis (h 2=0·19; S.E.M.=0·045), our minimum relative efficiency estimations of BWB compared with the FS model are 84·4 and 61·9% for the HS and PH, respectively (Fig. 2). Comparing these theoretical expectations with the results obtained for the BWB simulation (Fig. 1) indicates that the HS strategy is close to attaining its expected efficiency estimate, whereas the PH was higher than expected. Since we used the 8-year height narrow sense heritability estimate produced from the diallel conventional testing, it is safe to assume that it is higher than what is expected under ‘less than ideal’ situation (i.e. after pedigree reconstruction family sizes would be different). It should be stated that even with the balanced data used as the initial ‘set-up’ in the present study, a ‘less than ideal’ scenario is expected to emerge after ranking and truncation selection (i.e. a subset of the original data with unequal representation of the tested parents). The theoretical impact of this genetic and statistical imbalance on estimating the genetic parameters (i.e. prediction of breeding values) by BLUP using the animal (individual tree) models will be unbiased if all known additive relationships are accounted for in matrix A even in the presence of selection. This situation remains unchanged even in the presence of fertility variation among the breeding arboretum parents (Henderson, Reference Henderson1988; Kennedy et al., Reference Kennedy, Schaeffer and Sorensen1988).
The PH option results, although lower and less precise than the other options, confirm earlier breeding strategy comparisons that highlighted the increased long-term efficiency of phenotypic selection as compared with other breeding schemes (Cotterill, Reference Cotterill1986; Andersson et al., Reference Andersson, Spanos, Mullin and Lindgren1998). However, as indicated in the Introduction section (above), while phenotypic (mass) selection is tempting for its simplicity, this approach requires DNA fingerprinting and pedigree reconstruction augmentation to detect the unnoticeable build-up of coancestry that will ultimately negate the method's advantages. It is also important to mention that when the relative efficiency comparisons were made, both the size and genetic structure of the selected individuals were instrumental in both options' success (Fig. 2). The ideal situation arises when many small full-sib families are available within half-sib families (Fig. 2).
The proposed method is anchored around pedigree reconstruction, which, in the present study, was assumed to be error-free. Critical factors in pedigree reconstruction are the number of loci used, their polymorphic information content (Botstein et al., Reference Botstein, White, Skolnick and Davis1980) and the rate of genotyping error (Vandeputte, et al., Reference Vandeputte, Mauger and Dupont-Nivet2006; Kalinowski et al., Reference Kalinowski, Taper and Marshall2007; Wang, Reference Wang2004, Reference Wang2007). While most pedigree reconstruction methods account for genotyping error, the ability to estimate its magnitude and adjusting its impact are essential so individuals selected for either future breeding or production populations are all authentic. A limited number of informative loci have proved to be very effective in pedigree reconstruction (Gerber et al., Reference Gerber, Mariette, Streiff, Bodénès and Kremer2000; El-Kassaby et al., Reference El-Kassaby, Barnes, Cook and MacLeod2006); however, increasing the number of informative loci has proved to be instrumental in reducing type I error (false assignment) and type II error (false exclusion) (Vandeputte et al., Reference Vandeputte, Mauger and Dupont-Nivet2006). Additionally, the level of immigration into the breeding arboreta is expected to proportionally increase the fingerprinting efforts (Pompanon et al., Reference Pompanon, Bonin, Bellemain and Taberlet2005). However, we expect that most of the individuals resulting from immigration/contamination (unselected parents) will rank low during either the genotypic or phenotypic pre-selection as a result of the selection deferential between the breeding arboretum and contamination source and thus most of the individuals sired by outside pollen will be eliminated even under the known high migration rate observed in many seed orchards (Friedman & Adams, Reference Friedman and Adams1985; El-Kassaby et al., Reference El-Kassaby, Lstibůrek, Liewlaksaneeyanawin, Slavov and Howe1989b). Highly ranked individuals, even if they are generated from pollen migration, should be retained in the testing population and their inclusion in further breeding and/or production selection could be considered as an infusion. In a parallel western larch (Larix occidentalis Nutt.) field testing experiment consisting of 14 open-pollinated families collected from a 41-parent seed orchard with 22% pollen contamination, we successfully constructed the pedigree and several FS families were identified within either the tested 14 females or the orchard's 41 males. The pedigree reconstruction resulted into the emergence of a mating design with females sired by an average of 16 males and males mated with an average of five females, producing a testing population with ample mating bridges for the prediction of breeding values using the BLUP analysis (Funda et al., Reference Funda, Chen, Liewlaksaneeyanawin, Kenawy and El-Kassaby2008). Additionally, the rate of pollen contamination into the orchard/breeding arboretum could be reduced with pollen augmentation techniques (e.g. supplemental-mass-pollination: Wakeley et al., Reference Wakeley, Wells and Campbell1966). This technique has proved to be effective in reducing pollen contamination (El-Kassaby & Davidson, Reference El-Kassaby and Lindgren1990) and successfully siring up to 8% of the offspring using only one pollen application (El-Kassaby et al., Reference El-Kassaby and Davidson1993). Thus pollen augmentation could also be viewed as a means to expand the size of the breeding arboreta (i.e. the number of parents) through the introduction of new parents.
The cost associated with BWB implementation is mainly dependent on the number of individuals requiring genotyping (i.e. the intensity of pre-selection). Considering the lack of observed differences in the genetic response among the three intensities (HS 500, 1000 and 2000) used in this study, it could be argued that further reduction in the number of individuals for genotyping could be possible. However, a balance between the number of genotyped individuals and the accuracy of pedigree reconstruction should be considered. The primary role affecting the pre-selection intensity is limiting false assignments and improvement of the exclusion probabilities of pedigree reconstruction.
Cost comparisons between FS breeding and either of the two proposed options should be viewed in general terms to avoid any species- or case-specific scenarios. Fair comparison should account for all important cost and time components (see Fig. 3). In the present study, we have only focused on presenting a general methodology to calculate genetic-based efficiency, which by definition is expected to be lower than 1, as the BWB strategy is based on a less informative evaluation scheme. Additionally, net present value of the BWB and FS strategies should be calculated and their ratio should be reported as the ‘relative efficiency of the BWB’.
Incorporating the DNA fingerprinting and partial pedigree reconstruction into tree breeding was first attempted by Lambeth et al. (Reference Lambeth, Lee, O'Malley and Wheeler2001) in the complementary polycross mating design and followed by Grattapaglia et al. (Reference Grattapaglia, Ribeiro and Rezende2004) in a unique case of Eucalyptus inter-specific hybridization. While DNA fingerprinting and parentage assignment were restricted to the identification of a limited number of male parents forming the polymix (i.e. pollen mix donors) following controlled crosses, Lambeth et al.'s (Reference Lambeth, Lee, O'Malley and Wheeler2001) method successfully transformed the polycross liabilities (less genetic gain potential and limited potential for forward selection) into assets (simplicity and complete pedigree information). This approach has gained increased attention and evidence for unequal paternal contributions was reported (Wheeler et al., Reference Wheeler, Payne, Hipkins, Saich, Kenny and Tuskan2006; Kumar et al., Reference Kumar, Gerber, Richardson and Gea2007; Doerksen & Herbinger, Reference Doerksen and Herbinger2008). Grattapaglia et al.'s (Reference Grattapaglia, Ribeiro and Rezende2004) inter-specific hybridization work, on the other hand, only involved six E. urophylla males and a single E. grandis female clones. These males were effectively further reduced to only three due to an incident of parental labelling error and a very limited reproductive output from two other males (lack of (0/149) or extremely reduced (1/149) contribution), thus reducing the number of tested males to three. Notwithstanding the originality of the two approaches listed above, it should be stated that they differ substantially from our proposed BWB approach, which is targeted at operational tree breeding programmes aiming at capturing general combining ability with unrestricted number of parents, possibly in much larger population sizes (thousands of selection candidates), and the obvious lack of control crosses.
In conclusion, we believe that BWB is a competitive strategy to current breeding programmes, providing an effective and economic method to breed outcrossing species. In the same way, the method is fully applicable within zones of lesser economic value that do not warrant the establishment of a full structured programme such as minor species and respective gene management/conservation programmes. As the cost of DNA fingerprinting is steadily declining due to the availability of commercially independent high-throughput laboratories, the ease of accessing numerous sources of primers for many species in the Internet and/or scientific journals (e.g. Molecular Ecology Research is the default depository for most developed markers), and the cross amplification of conspecific, congeners and confamilial markers, all reduce the need for a species-specific primer, thus making BWB a viable option for developing countries, where the resources are too limited to support classical breeding programmes. More importantly, breeding programmes are in themselves an efficient means of gene conservation and the development of a low-cost but efficient approach to tree improvement would provide an incentive for countries that would have not otherwise developed breeding/conservation programmes.
We thank Michael Stoehr for the retrospective study data, Trudy Mackay (Executive Editor) and three anonymous referees for constructive comments, and our colleagues for comments on earlier drafts. We acknowledge support from the Natural Sciences and Engineering Research Council of Canada (Discovery and IRC Grants) and the Johnson's Family Forest Biotechnology Endowment to Y. A. E. and from the Czech Science Foundation (GAČR; research grant number 521/07/P337) and the National Agency for Agricultural Research (NAZV; research grant number QH81172) to M. L.


