


Introduction
Solid samples for oxygen isotope δ18O measurements are commonly stored in silver cups. However, silver cups tarnish (Ag2S) upon exposure to H2S in the air even at parts-per-billion concentrations of H2S (Franey et al., Reference Franey, Kammlott and Graedel1985), especially near the opening of the cups where they are pressed to avoid the samples from falling out (Fig. 1). Other than Ag2S, a small amount of AgO, Ag2O, Ag2SO3, Ag2SO4 can also form on the cup (Franey et al., Reference Franey, Kammlott and Graedel1985; Sanders et al., Reference Sanders, Verreault, Frankel and Allen2015), particularly in the presence of ozone in the air (Wiesinger et al., Reference Wiesinger, Martina, Kleber and Schreiner2013). Some laboratories store the silver cups in ovens to avoid moisture, which can speed up the oxidation process. Even if the silver cups are stored in room conditions, they can still turn yellow after storage for about a year.
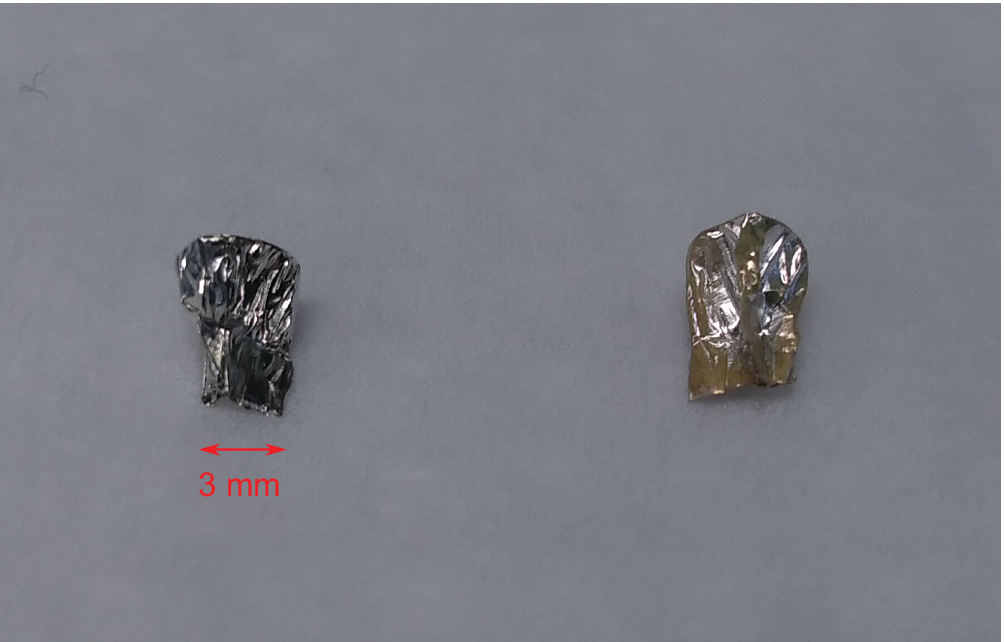
Figure 1. A new silver cup (left) and an old silver cup that has held samples for over a year in room conditions (right). Notice the old cup has turned slightly yellow, especially at its pressed opening.
Objective
Silver oxides or sulfate on silver cups can potentially affect the δ18O measurements. In this study, we explore this problem and the circumstance that the oxidized silver cups become a concern. We measure the δ18O of silver cups that appear pale yellow, in order to identify if oxidation of the cups can skew δ18O measurements of small solid samples. We use measurements of oxygen isotope ratios from BaSO4 standards to illustrate the effects of the oxidized silver cups.
Methods
We put two silver cups into an 80°C oven to speed up the process of oxidation. The cups turn to pale yellow after a month. We also have a silver cup that has sat in room conditions for over a year and turned pale yellow. We then measure the δ18O of these three silver cups with a Hekatech high-temperature pyrolysis furnace and a continuous flow isotope ratio mass spectrometer system (CF-IRMS, Finnigan MAT 253 in continuous flow mode using a Conflo III open split interface). Before the measurements, the system passed the linearity test, background test and zero test. In the same run, we measure the δ18O of IAEA-SO-5 BaSO4 standard to compare the oxygen peak sizes from standard sulfate and the silver cups. δ18O values (V-SMOW) are calibrated with international standards for oxygen isotopes: IAEA-SO-5, USGS-32, NBS-127 and IAEA-SO-6. The standard deviation of the measurements is 0.18‰.
Results
The three yellow silver cups give small peaks of oxygen in the mass spectrum results (Fig. 2a). The cups stored in an 80°C oven show amplitude-28 of only 141 mV and 112 mV. The amplitude-28 of the cup stored in room conditions for over a year is larger, at 219 mV. δ18O values (9.4‰, 11.5‰, −4.5‰) from such small amounts of oxygen are not accurate and are only for reference here.
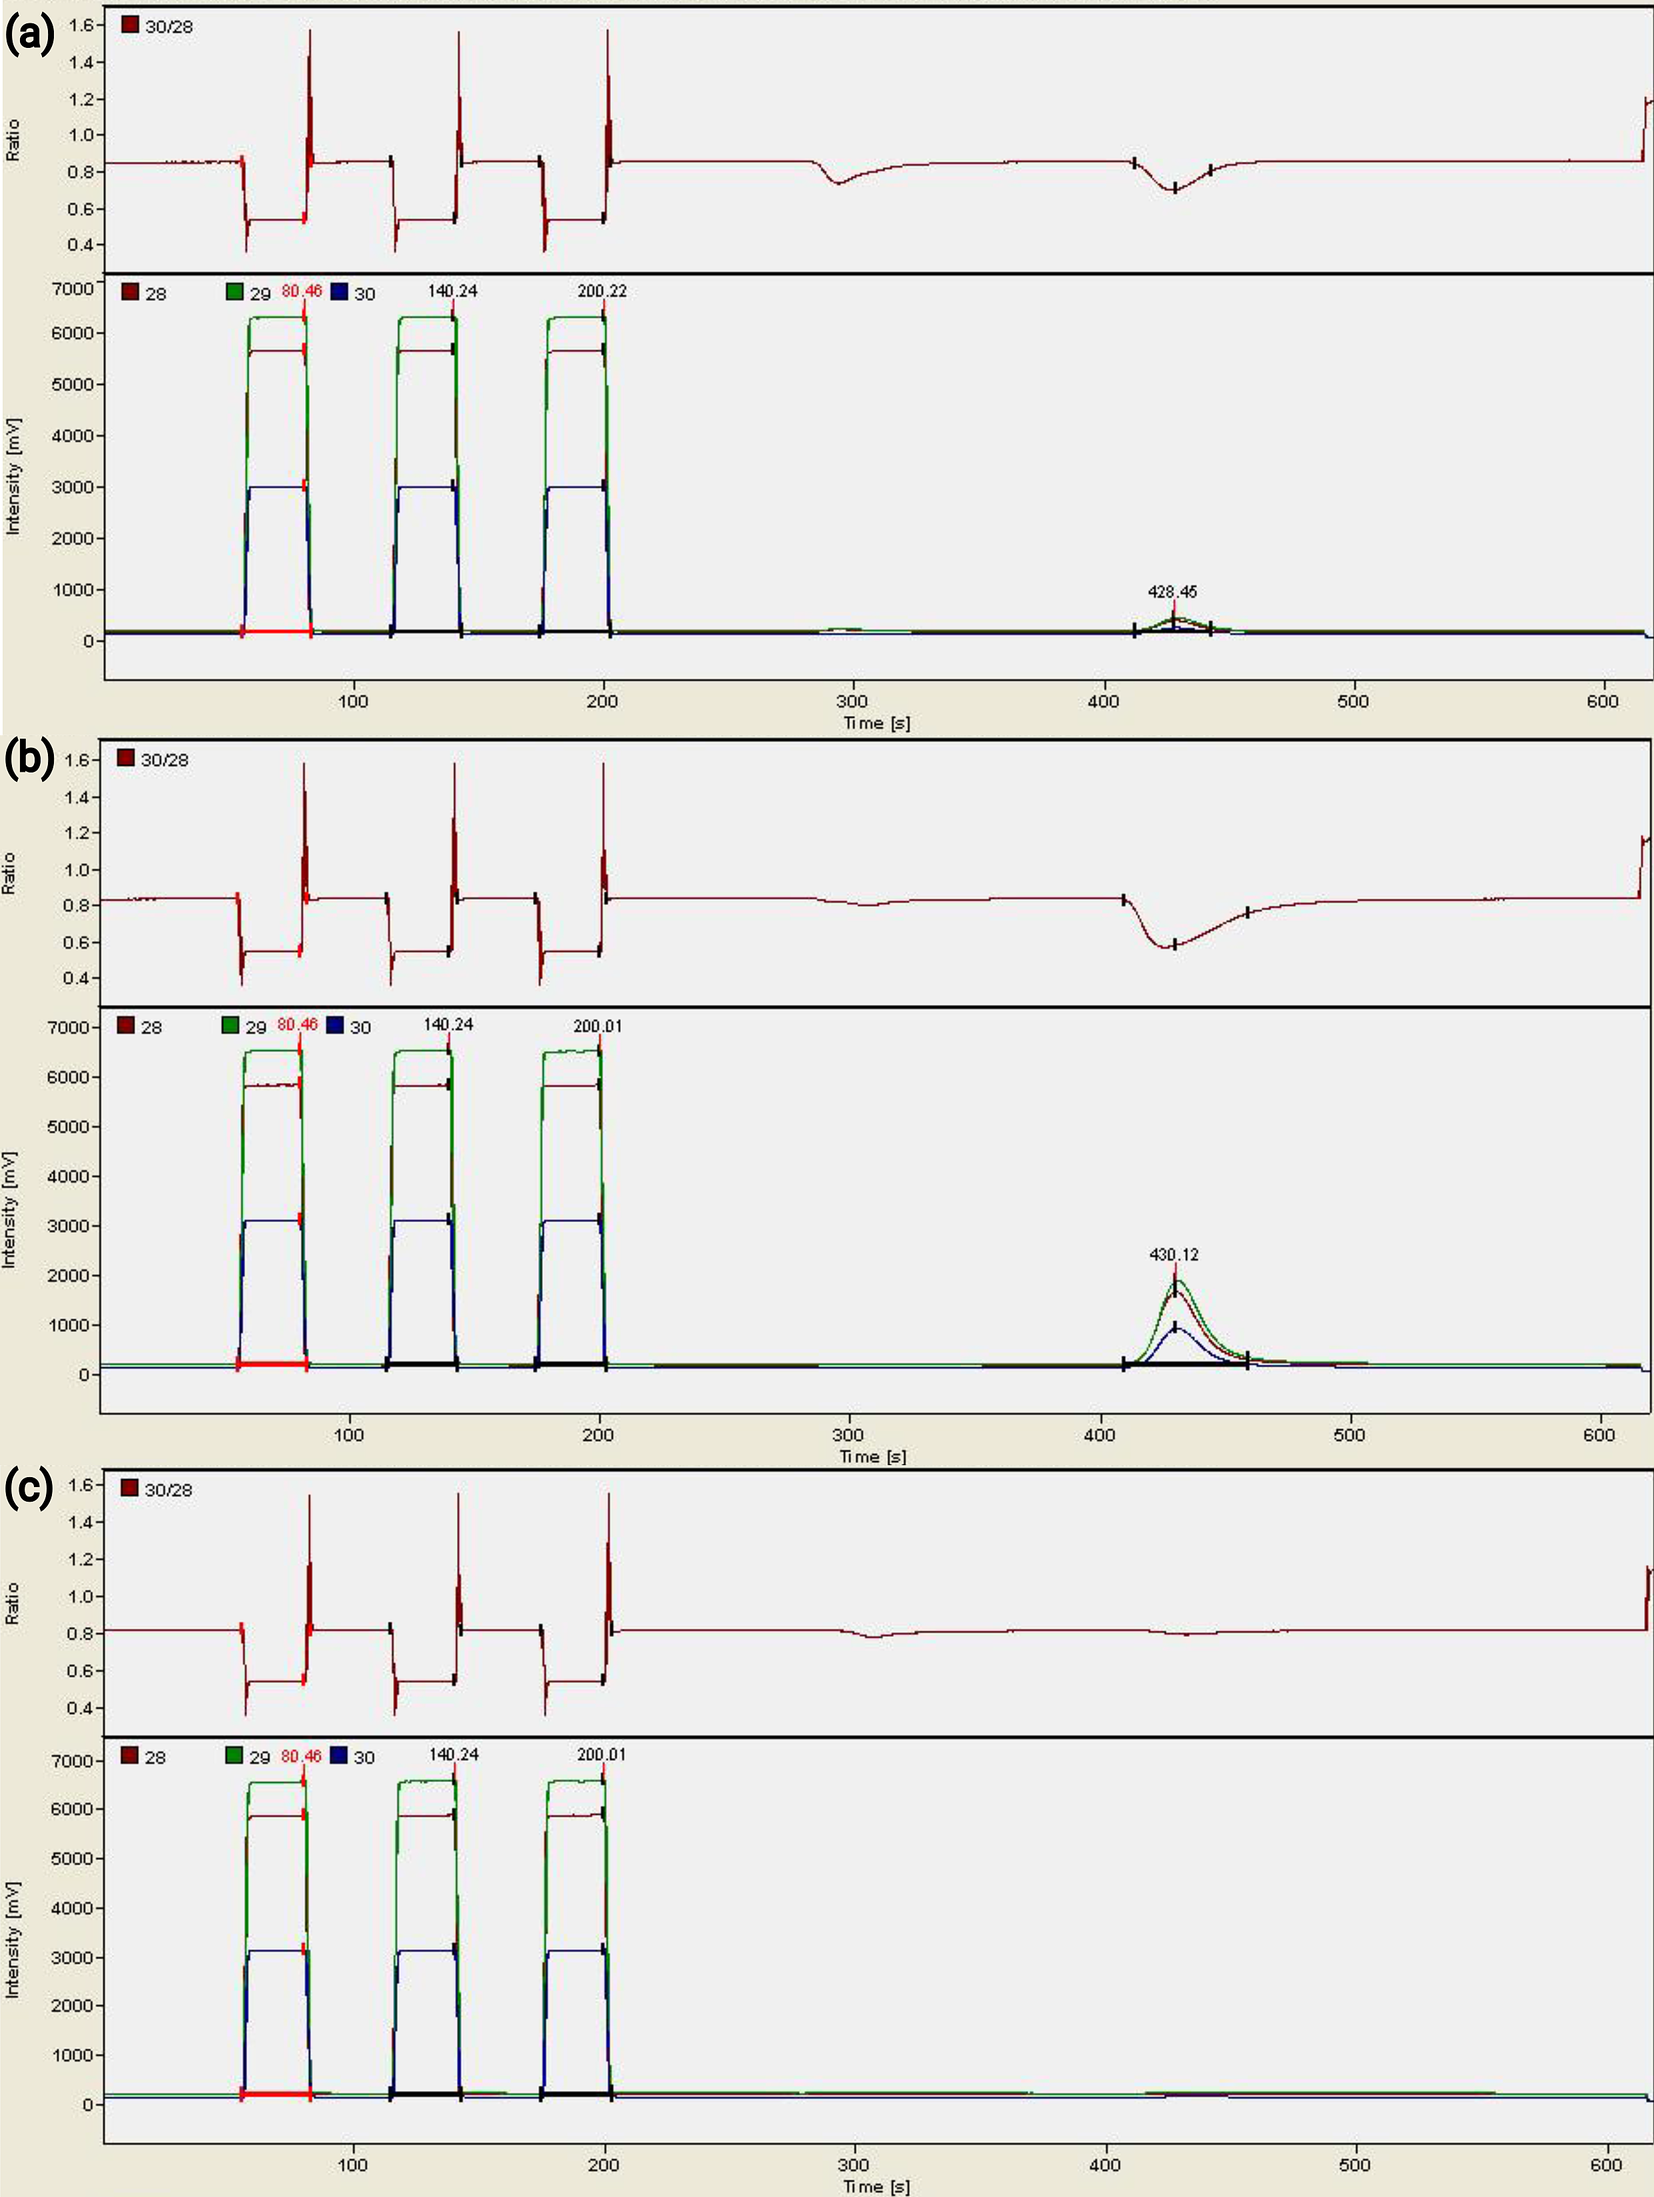
Figure 2. Mass spectrum results from the mass spectrometer. In each mass spectrum, the first three peaks at the left are from the reference gas (tuned for measuring 200 μg of BaSO4) and the fourth peak is the peak of the oxygen from the sample. (a) An old, pale yellow silver cup gives a small oxygen peak. (b) 43 μg of BaSO4 gives an oxygen peak larger than that in (a). (c) In comparison, a new silver cup gives no oxygen peaks in the mass spectrum.
In the same run, ~200 μg of BaSO4 (IAEA-SO-5, about 27% of the mass is from O) produces an amplitude-28 at about 6,500 mV, and 43 μg BaSO4 at about 1,500 mV (Fig. 2b). This means when 200 μg BaSO4 is used for BaSO4-δ18O measurements, the oxides from the silver cup contribute less than ~3.5% of the oxygen being measured. However, when only 43 μg BaSO4 is measured, the oxides from the silver cup can contribute roughly 13% of the oxygen.
Discussions
Our experiment demonstrates that when using conventional sample sizes (e.g., 200 μg BaSO4), the oxidized silver cups are not a concern for the accurate measurements of δ18O. However, when only a small sample is available, or the sample is impure so the oxygen content is lower than expected, the oxides on the silver cups can skew the δ18O results.
The scale of the skewness can vary, depending on the time of storage, the quantities of oxygen compounds and the isotope compositions of oxidants. For instance, δ18O of both atmospheric O2 and H2O vary according to environmental conditions (e.g., Craig, Reference Craig1961; Klots & Benson, Reference Klots and Benson1963; Benson & Krause, Reference Benson and Krause1980). These oxidants on silver cups will skew δ18O results differently.
If prolonged storage of samples in silver cups is unavoidable, simple methods to postpone the oxidation process include vacuum-sealing the sample holders and storing the samples in a desiccator. Storing samples in an argon- or nitrogen-filled environment may be considered for storage over an extensive period. The laboratory condition, e.g., whether natural gas is present, matters as natural gas contains a minor amount of H2S. An effective and clean heating, ventilation, and air conditioning (HVAC) system of the laboratory should also help lessen the oxidation problem.
Conclusions
Our results demonstrate that if small or impure samples are measured for their oxygen isotope compositions, oxidized silver cups that hold the samples can skew the measurements. Our finding suggests that proper sample storage is also an important step for accurate isotope measurements. When small sample sizes are unavoidable, we recommend shortening the storage period with the silver cups and vacuum-sealing the sample holders to delay the oxidation process.
Acknowledgements
We thank the reviewer for the useful comments that help improve this manuscript.
Author Contributions
MYT and KT designed the study and performed the experiments. MYT, WY and KT analyzed the data and wrote the article.
Funding Information
This research received no specific grant from any funding agency, commercial or not-for-profit sectors.
Data Availability Statement
The data that support the findings of this study are available in Supplementary Material.
Conflict of Interest Declaration
MYT, WY and KT declare none.
Supplementary Materials
To view supplementary material for this article, please visit http://dx.doi.org/10.1017/exp.2020.15.


 Open access
Comments
Comments to the Author: The authors study a well-defined laboratory question and the paper is well-written. A few comments:Line 12 measuring oxygen isotope ratio (d18O) OF THE SOLIDS (ORGANIC AND INORGANIC)Line 27 OTHER THAN Ag2SLine 75-76, can result in THAT … COULD SKEW d18O results differentlyLine 126, MASS spectrumIn some newly built laboratory building, the air is controlled by HVAC system as that I expect H2S and O3 concentrations are monitored and should be even less than a trace value, so in my experience the silver cups do not seem to decay in color. Also, rather than consider the mass balance in d18O, why do not just measure the same standard BaSO4 sample in a separate run in a new silver cup and a tarnished cup and see how much permille of d18O is skewed?