


Introduction
Meta-analyses have become an indispensable tool to integrate large, often complex and sometimes conflicting fields of research, and to translate the results of this research into treatment recommendations, guidelines and advice for policy measures (Higgins & Green, Reference Higgins and Green2011). The methods for conducting meta-analyses have been developed into sophisticated standards and procedures, not in the least thanks to the groundbreaking work of the Cochrane Collaboration (Higgins & Green, Reference Higgins and Green2011). Unfortunately, however, not all meta-analyses use the best available methods.
In this paper, we will focus on meta-analyses that use a specific type of effect size of included studies, the so-called pre-post effect size and we will show why such meta-analyses have a high risk to result in wrong and biased outcomes. Several meta-analyses that have received considerable attention in their field and in the media used this method. One example is the highly cited paper by Kirsch et al. (Reference Kirsch, Deacon, Huedo-Medina, Scoboria, Moore and Johnson2008) in which they showed that anti-depressant medication (ADM) has small effects in mild depression and is only clinically relevant in severe depression. Another example is a meta-analysis in the Journal of the American Medical Association, showing that long-term psychodynamic psychotherapy is effective in the treatment of mental disorders (Leichsenring & Rabung, Reference Leichsenring and Rabung2008). And more recently a meta-analysis suggested that the effects of cognitive behaviour therapy for depression have declined over time (Johnsen & Friborg, Reference Johnsen and Friborg2015).
The effect size, also called the standardised mean difference (SMD) or Cohen's d, is one of the most used ways to express the outcome of an intervention in biomedical research, next to outcomes based on dichotomous outcomes like the relative risk and odds ratio. It is calculated as the difference in means between a treatment and comparison group, divided by the pooled standard deviation of the two means. So the SMD indicates the difference between the treatment and comparison group after the treatment, or alternatively, the difference between the change in the outcome in the treatment group and the change in the outcome in the comparison group.
However, as indicated, some meta-analyses do not use this ‘regular’ type of SMD (the between-group SMD), but prefer to use the pre-post SMD, indicating the difference between the outcome score before the intervention (at pre-test) and the score after the intervention (at post-test). So, the pre-post SMD indicates the improvement within one group, while the between-group SMD indicates the difference between two groups (the treatment and comparison group).
The pre-post SMD is problematic for several reasons, which will be detailed further.
Pre-post SMDs do not give reliable information about treatment effects
The most important reason why pre-post SMDs are problematic is that it only calculates the change within one group. That means that the pre-post SMD is uncontrolled and it is impossible to disentangle which proportion of the SMD is caused by the intervention and which by natural recovery or other processes. This is not so much a problem of the pre-post SMD in itself, but is caused by the design of the studies for which the pre-post SMD is calculated.
This uncontrolled feature of the SMD is especially problematic in situations where natural or spontaneous change is large, like in depression. It is well-known that spontaneous recovery in depression is very high, with up to 40% of patients recovering within a few months with or without treatment (Cuijpers et al. Reference Cuijpers, Karyotaki, Weitz, Andersson, Hollon and van Straten2014a ). If the pre-post SMD of different studies covers different time spans, then the differences between the SMDs must be considerable, due to natural recovery alone. These variations are not related to the effects of the intervention in any way.
But it is not only spontaneous change that affects the pre-post SMD. Studies are conducted in different populations, with varying recruitment strategies, with diverse inclusion criteria, in various settings, communities, countries. Moreover, variables related to the treatment such as expectations of the patients or hope to recover soon can have an impact on the pre-post SMD. Of course that is also true for between-group SMDs indicating the difference or change between the intervention and the comparison group. The important difference between between-group SMDs and pre-post SMDs is, however, that in the former both the treatment and the control group are influenced by these variables. That means that the pre-post SMD is always influenced by such variables, while the between-group SMD is only influenced by such variables if these are related to the effects of the treatment. For example, the time between pre-test and post-test is always influencing the pre-post SMD, but in the between-group SMD both the treatment and the control group have the same time to follow-up. This means that the between-group SMD will only be influenced by time to follow-up if this is associated with the effects of the treatment, while the pre-post SMD is always influenced by that.
The most important consequence of this is that the size of the pre-post SMDs is not informative about the effects of the intervention, because it can be influenced by many uncontrolled variables that have nothing to do with the intervention. Another corollary is that there are typically large differences between pre-post SMDs across studies, resulting in high levels of heterogeneity. Heterogeneity refers to the variability in the effect sizes that are found for included studies in a meta-analysis. If there is significant heterogeneity, it means that the observed effect sizes are more different from each other than what would be expected due to chance (random error) alone. In meta-analyses using pre-post SMDs, heterogeneity can be extremely high, sometimes more than 90% (Johnsen & Friborg, Reference Johnsen and Friborg2015). This makes the interpretation of the results of these meta-analyses very uncertain, because the true effect size in a specific context is likely very different from the true effect size in another and hence it is impossible to say under which circumstances a given effect size could be expected.
Pre-test and post-test scores are not independent from each other
Another important problem with pre-post SMDs is that the scores on the outcome measures at pre-test and those at post-test are not independent of each other, and the correlation between these two scores should be accounted for in the calculation of the pre-post SMDs. The character of this problem is not so much related to the design of the studies, like the previously discussed problem of the pre-post SMD, but is more an improper way of calculating it.
In some meta-analyses the correlation between pre-test and post-test is just ignored and the SMDs are calculated as if the pre-test and post-test scores are independent of each other. Other authors assume a fixed value for this correlation, because the value for this correlation is hardly ever reported in trial reports. The best value to use in such situations would be the correlation based on existing reports of correlations. In one report of 811 within-group correlation values the median within-group correlation across all included 123 studies was r = 0.59 (Balk et al. Reference Balk, Earley, Patel, Trikalinos and Dahabreh2012). However, many authors use a fixed value that is not based on any empirical data, for example the value of r = 0.75 or r = 0.7 is used in many studies (Hesser et al. Reference Hesser, Weise, Westin and Andersson2011; Hofmann et al. Reference Hofmann, Wu and Boettcher2014; Johnsen & Friborg, Reference Johnsen and Friborg2015). Furthermore, the empirical value of the within-group correlation of 0.59 is based on the average of many questionnaires and this does not mean that this correlation in a specific study in a specific meta-analysis takes indeed this specific value. The value for this correlation can (and probably is) different for each instrument in each specific study.
So does this use of a fixed value for this correlation affect the pooled pre-post SMD in a meta-analysis? Because this has not been examined empirically, we decided therefore to examine this in an individual patient data meta-analysis of 16 randomised controlled trials directly comparing cognitive behaviour therapy (CBT) with ADM for adults with major depression. The details on the identification, inclusion and data extraction have been reported elsewhere (Cuijpers et al. Reference Cuijpers, Weitz, Twisk, Kuehner, Cristea, David and Hollon2014b ; Weitz et al. Reference Weitz, Hollon, Twisk, van Straten, Huibers, David and Cuijpers2015; Vittengl et al. Reference Vittengl, Jarrett, Weitz, Hollon, Twisk, Cristea and Cuijpers2016). In these data we could calculate the exact value of the correlation between the outcome measures at pre-test and post-test in both CBT and ADM, and examine how much that influenced the outcomes of meta-analyses compared with the outcomes when standard values for the correlation are used.
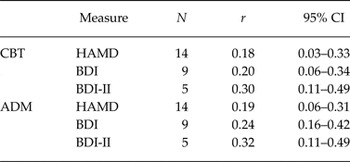
First, we calculated the correlation between pre-test and post-test for each of the 16 studies (based on completers in these studies), separately for each of the CBT and ADM conditions. We did that for the three main depression measures that were used as outcome in the 16 studies (Hamilton Depression Rating Scale (HAM-D; Hamilton, Reference Hamilton1960); Beck Depression Inventory (BDI; Beck et al. Reference Beck, Ward, Mendelson, Mock and Erbaugh1961); the BDI Second Edition (BDI-II; Beck et al. Reference Beck, Steer and Brown1996). Then we pooled the correlations separately for each instrument and separately for CBT and ADM, in a series of meta-analyses. We used the computer program Comprehensive Meta-Analysis (version 3.3.070; Biostat Inc., 2015) to calculate pooled correlations, using a random effects model. The pooled correlations across all studies are given in Table 1. As can be seen these are considerably smaller than the 0.75 that is assumed in many meta-analyses using pre-post SMDs, and the 0.59 that was found as the median correlation in a systematic review (Balk et al. Reference Balk, Earley, Patel, Trikalinos and Dahabreh2012).
Table 1. Pooled correlations between pre-test and post-test scores on the HAM-D, BDI and BDI-II in CBT and ADM for adult depression

CI, confidence interval; CBT, cognitive behavioural therapy; ADM, anti-depressive medication; HAM-D, Hamilton rating scale for depression; BDI, Beck's depression inventory; BDI-II, BDI second edition.
Then we calculated the pre-post SMDs for each study, separately for CBT and ADM, and for each of the outcome measures, using two methods: (1) using the correct correlation between pre-test and post-test for each study (the best estimate of the true SMD); (2) using different fixed values for the correlations between pre and post-test. The results are presented in Table 2. As can be seen, the differences between the best estimate SMD and the ones based on fixed correlations ranged overall from ∆SMD = −0.38 to + 0.07. The largest values for ∆SMD are found when the difference between the fixed value for the correlation and the true value is large (r = 0.90 in our case) and when this difference is small (in our case r = 0.00–0.5) the ∆SMD is also relatively small. This illustrates that using fixed values for pre-post correlations can have considerable impact on the estimations of the pre-post SMD, especially when the estimate of the correlation differs much from the true value.
Table 2. Pre-post effect sizes based on different values for the correlations between pre-test and post-test

SMD, standardised mean difference; CI, confidence interval; CBT, cognitive behavioural therapy; ADM, anti-depressive medication; BDI, Beck's depression inventory; BDI-II, BDI second edition.
It should also be noted that the correlation between pre-test and post-test can often be estimated, for example from change score variances. So it is often not necessary to use a fixed value for the correlation between pre-test and post-test, and realistic estimates of this correlation will result in better estimates of the pooled effect sizes.
Other problems with the pre-post SMD
Besides the impossibility to differentiate between the effects of treatment and natural processes and the unknown impact of the correlation between pre-test and post-test, there are additional problems with the pre-post SMD.
In some meta-analyses, pre-post SMDs of open studies (without a comparison group) are combined with pre-post SMDs of randomised trials (in which only the SMD for the treatment group is calculated) (Johnsen & Friborg, Reference Johnsen and Friborg2015). This is problematic because patients from open studies typically participate in a study where they get treatment, while in a randomised trial they know that it will be chance that decides whether they get a treatment or not. This means that the populations in open studies and randomised trials can differ considerably and it cannot be assumed that they are comparable enough to be combined into one meta-analysis.
In other meta-analyses, pre-post SMDs are calculated separately for the treatment groups and comparison groups in randomised trials, and then it is tested whether the SMDs from treatment and control groups differ from each other (e.g., Leichsenring & Rabung, Reference Leichsenring and Rabung2008). This method is also wrong, however, as we explained earlier, because the pre-post SMDs are still influenced by natural processes and characteristics of the patients and settings, in contrast to the between group SMDs.
Discussion
In this paper we described why pre-post SMDs should be avoided in meta-analyses. The most important reason to avoid pre-post SMDs, however, is that they are influenced by natural processes and characteristics of the patients and settings, and these cannot be discerned from the effects of the intervention. Between group SMDs are sounder because they control for such variables. Another important reason why pre-post SMDs should be avoided is that the scores from pre- and post-intervention are not independent from each other. The value for the correlation between these two time points should be used in the calculation of the SMD, but this value is typically not known. We showed that this can lead to considerable errors in the estimation of the SMDs.
So does this mean that pre-post SMDs should not be used at all? When the limitations of the pre-post SMDs are taken into consideration they can be useful in some cases. For example, in some meta-analyses pre-post SMDs are used to compare improvement found in routine practice with improvement found in patients participating in randomised trials (van der Lem et al. Reference van der Lem, de Wever, van der Wee, van Veen, Cuijpers and Zitman2012a , Reference van der Lem, van der Wee, van Veen and Zitman b ). In other meta-analyses pre-post SMDs are used to examine what happens during natural follow-up in trials when no control group is available anymore (Hesser et al. Reference Hesser, Weise, Westin and Andersson2011). Such meta-analyses can still be informative, despite the disadvantages of the SMDs.
We can conclude that insofar as possible pre-post SMDs should be avoided, because they can contribute to biased outcomes and do not give reliable information about treatment effects. The results of highly cited and influential meta-analyses based on the pre-post SMDs are probably biased.
Acknowledgements
None.
Financial support
Ioana A. Cristea was supported for this work by a grant of the Romanian National Authority for Scientific Research and Innovation, CNCS - UEFISCDI, project number PN-II-RU-TE-2014-4-1316 awarded to Ioana A. Cristea. No other specific grant from any funding agency, commercial or not-for-profit sectors was received for this research.
Conflict of interest
None.
Contributions of the authors
P. C. had the idea for this paper, did the analyses and wrote all drafts of the paper. J. T. contributed to the design and general content of the paper. E. W. contributed to the data collection. I. C. and E. W. read all versions of the paper and revised it critically for important intellectual content. All authors approved the final version and agreed to be accountable for all aspects of the work.
Statement of Interest
Researchers interested in the data of this paper can contact the first author for the conditions under which these are made available.


Target article
Pre-post effect sizes should be avoided in meta-analyses
Related commentaries (1)
Every effect size has its place: a commentary on the avoidance of pre–post effect sizes