


Introduction
Hepatitis C is an infectious disease caused by hepatitis C virus (HCV) infection [Reference Webster, Klenerman and Dusheiko1], which is the main cause of liver cirrhosis and hepatocellular carcinoma [Reference Shi2, Reference Taherkhani and Farshadpour3]. It has become a serious public health problem in the world because its susceptible populations are widely distributed, coupled with the fact that it has a poor prognosis. According to the WHO statistics, in 2017, there were about 150 million cases of chronic HCV infection, increasing at a rate of 3–4 million per year, and the number of deaths due to HCV infection reached 400 000 per year [Reference Jacobson4, 5]. In recent 10 years, the incidence of hepatitis C in China has been on the rise and has not been effectively controlled. There are still gaps in research on the transmissibility of hepatitis C. In China, HCV infection is mainly blood-borne [Reference Shi2]. Unsafe injections/blood transfusions and contaminated equipment used in medical-related procedures are the main causes of hepatitis C infection [Reference Mohsen6]. Currently, another major cause of hepatitis C transmission is injecting drugs. In the Eastern Mediterranean and European countries, cases of infection due to injection of drugs account for a large proportion of new infections [Reference Mohsen6–Reference Mitruka8]. HCV infection can be effectively controlled in the future if blood products can be strictly tested, blood transfusion agencies strictly regulated and injection safety controlled.
Currently, mathematical models are an effective method to evaluate the transmissibility of various infectious diseases, predict future morbidity and evaluate the effectiveness of prevention and treatment [Reference Cui9–Reference Breban16]. There are a few model studies on hepatitis C; curve regression model, SEACR dynamic model and multi-stage SEIR model, which are widely used [Reference Shi and Cui11, Reference Pan and Chakrabarty17–Reference Kitagawa19]. Our previous study explored the principle of a susceptible-infectious-chronic-recovered (SICR) model, and used the next-generation matrix approach to deduce the equation of the basic reproduction number (R 0) of hepatitis C [Reference Cui9]. However, the transmissibility of hepatitis C in a mixed population still remains unclear.
In this research, the SICR model of mixed population was used, and R 0 and the number of newly transmitted cases per month by a primary case (MNI) were applied as indicators to quantitatively estimate the transmissibility of HCV infectious individuals. The SICR model was established for hepatitis C cases in various districts of Xiamen from 2004 to 2018 to evaluate the reliability of the model and predict the transmissibility of hepatitis C.
Methods
Ethic statement
This effort of investigation was part of CDC's routine responsibility in Xiamen City. Therefore, institutional review and informed consent were waived by Medical Ethics Committee of Xiamen Center for Disease Control and Prevention on the following grounds: (1) all data were anonymised; (2) neither medical intervention nor biological samples were involved; (3) study procedures and results would not affect clinical management of patients in any form.
Data collection
During this study, the cases from 1 January 2004 to 31 December 2018 were collected from six areas (Huli District, Siming District, Jimei District, Xiang'an District, Haicang District and Tong'an District) in Xiamen City. For each case, the following information was obtained: age, sex, occupation, date of onset of disease, date of diagnosis, classification of cases (acute cases, chronic cases and unclassified cases), date of death, etc. Data on the incidence of hepatitis C were used to assess the local transmissibility of hepatitis C. The demographic data of Xiamen City came from the Statistical Yearbook of Xiamen City. This study collected monthly data on the mortality rate for chronic hepatitis C in China from January 2004 to December 2018, released by the national health commission of the People's Republic of China.
Transmission model
The SICR model was established based on the natural history of hepatitis C. Since re-infection of HCV is not included in the data reporting system in China, re-infection of HCV was not considered in this model. The model was based on the following assumptions:
(1) The model divides the population into susceptible population (S), acute hepatitis C (I), chronic hepatitis C (C) and recovering population (R).
(2) Acute cases of hepatitis C have the same infectious power as chronic cases of hepatitis C. The transmission rate of acute or chronic hepatitis C cases is denoted as β.
(3) It is assumed that a part of acute cases (pγI) can be transformed into chronic hepatitis C cases, and the other parts ([1 − p]γI) cases will develop into R. The rate from I to C and R is proportional to the number of the corresponding population, and the proportionality coefficient is γ.
(4) Considering the natural birth and death of the population, there is no vertical transmission of the disease, and newborns of all groups are susceptible. We assumed that the natural birth rate is a and the natural death rate is b.
Therefore, the flow chart of SICR model without intervention is as shown in Figure 1. The model is represented by the differential equations as follows:

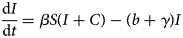
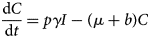

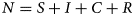
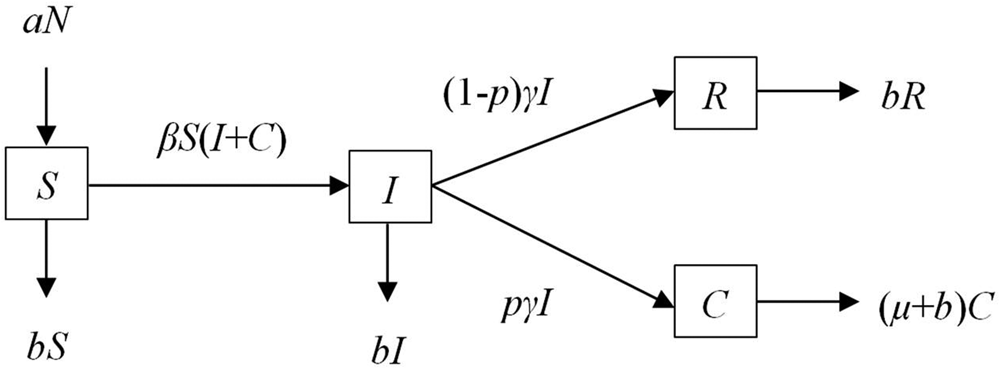
Fig. 1. Flow chart of SICR model.
The left-hand side of the equation represents the instantaneous rate of change of S, I, C and R at time t; whereas β, p, γ, a, b and μ respectively indicate the relative rate of transmission, the proportion of chronic cases, removal rate parameters for infected individuals, birth rate, natural death rate and case fatality rate.
Parameter estimation
The annual parameter β of each district, county and city was estimated by the model. Based on previous studies [Reference Hart and Ferguson18], the time for acute hepatitis C cases to develop into chronic hepatitis C cases is as long as 6 months, that is, the course of infectious hepatitis C disease is 1–6 months, and chronic hepatitis C cases will develop further on this basis. Therefore, the time limit between acute hepatitis C and chronic hepatitis C is generally 6 months, and this study used 6 months as the course of disease to simulate, so it follows that γ = 1/6, γ = 0. 1667. Parameters a and b were calculated from the collected demographic data. The parameters p and µ were calculated from the collected epidemiological data. Natural birth and death rates of the people of Xiamen were derived from the Xiamen statistical yearbook published by the Xiamen bureau of statistics (2004–2018).
Index of transmissibility
R 0 and MNI were used in this study to quantify the transmissibility of hepatitis C. The R 0 represents the number of new cases transmitted directly within the infectious period of a source of infection, and is a parameter used to determine whether the disease is prevalent. Based on our previous study [Reference Cui9], the equation of R 0 was shown as follows:
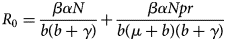
MNI is also used to quantitatively estimate the transmissibility of an infectious individual, and is represented by the following equation:

Simulation and statistical analysis
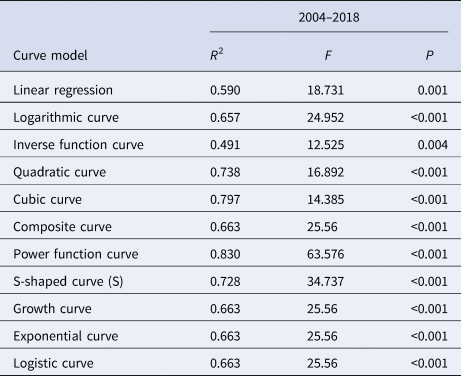
Eleven models, linear regression (LIN), logarithmic curve (LOG), inverse function curve (INV), quadratic curve (QUA), cubic curve (CUB), composite curve (COM), power function curve (POW), S-shaped curve (S), growth curve (GRO), exponential curve (EXP) and logistic curve (LGS) models, were used in SPSS 21.0 to fit the curve of R 0 and MNI, and the optimal model of quantitative indicator MNI was determined by the size of R 2 and P value. Meanwhile, the 95% confidence interval (CI) of the R 0 and MNI curve was predicted for interval estimation.
The 11 curve models and equations are as follows (‘Y’ represents R 0 or MNI, ‘x’ represents the time (year)):
-
Linear regression (LIN): Y = b 0 + b 1x
-
Logarithmic curve (LOG): Y = b 0 + b 1ln(x)
-
Inverse function curve (INV): Y = b 0 + b 1/x
-
Quadratic curve (QUA): Y = b 0 + b 1x + b 2x 2
-
Cubic curve (CUB): Y = b 0 + b 1x + b 2x 2 + b 3x 3
-
Composite curve (COM): $Y = b_0 + b_1^x$

-
Power function curve (POW): $Y = b_0 + x^{b_1}$
-
S-shaped curve (S): $Y = {\rm e}^{\lpar b_0 + b_1/x\rpar }$
-
Growth curve (GRO): $Y = {\rm e}^{\lpar b_0 + b_1x\rpar }$
-
Logistic curve (LGS): $Y = 1/\lpar 1/\mu + b_0b_1^x \rpar$
-
Exponential curve (EXP): $Y = b_0{\rm e}^{b_1x}$


Berkeley Madonna 8.3.18 software was used for mathematical simulation. According to optimal parametric results of the software's calculation and output of the minimum root mean square, the hepatitis C epidemic curve was constructed. SPSS 21.0 curve fitting was used for goodness of fit test. R 2 and P values were used to compare the fitting degree between model fitting data and actual data, based on our previous study [Reference Zhang20].
Result
Epidemiological characteristics
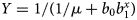
From 2004 to 2018, 2888 HCV cases were reported in Xiamen City, including 224 acute cases (7.76%), 1524 chronic cases (52.77%) and 1140 non-classified cases (39.47%). The variation trend for incidence of various cases from 2004 to 2018 is shown below (Fig. 2).
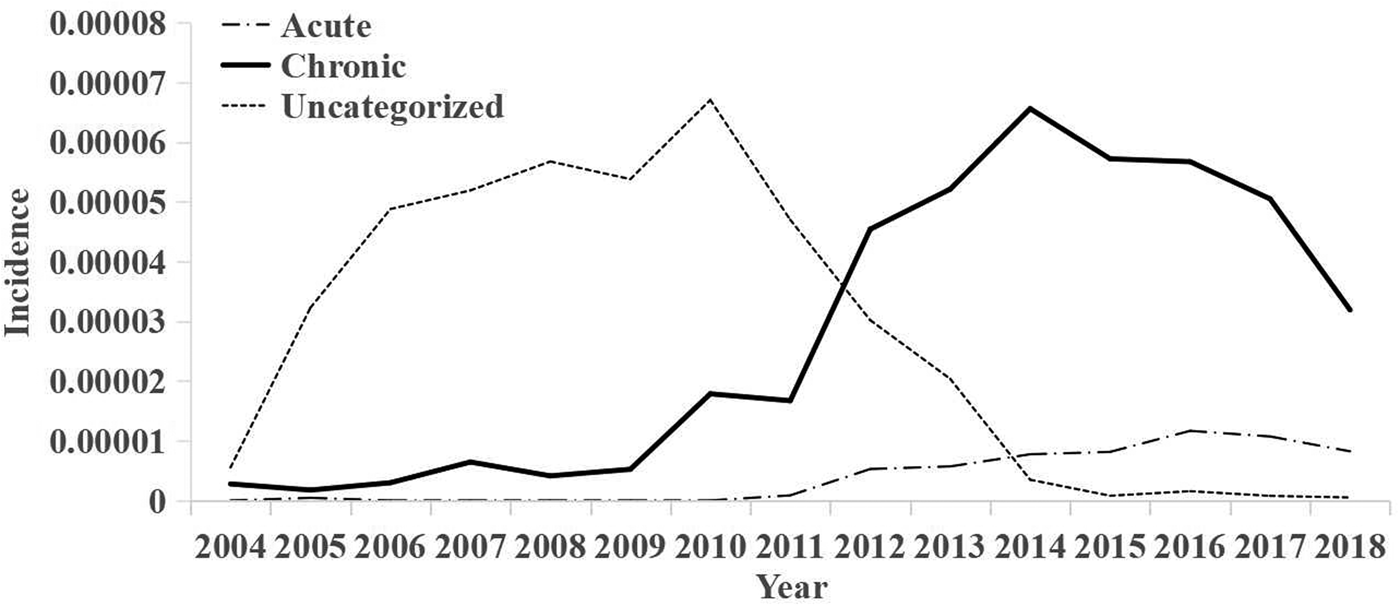
Fig. 2. Annual trends of acute, chronic and unclassified morbidity.
There were 1703 male cases (59.0%) and 1185 (41.0%) female cases. The changes of hepatitis C incidence among different genders in Xiamen from 2004 to 2018 are as follows (Fig. 3).
Fig. 3. Incidence rates by gender for each year.
According to the statistics of the time of onset and diagnosis for a single case, the mean value of the interval between the onset and time of diagnosis for each case was calculated in months (Fig. 4). From 2004 to 2018, the interval between onset and diagnosis showed a general decreasing trend.
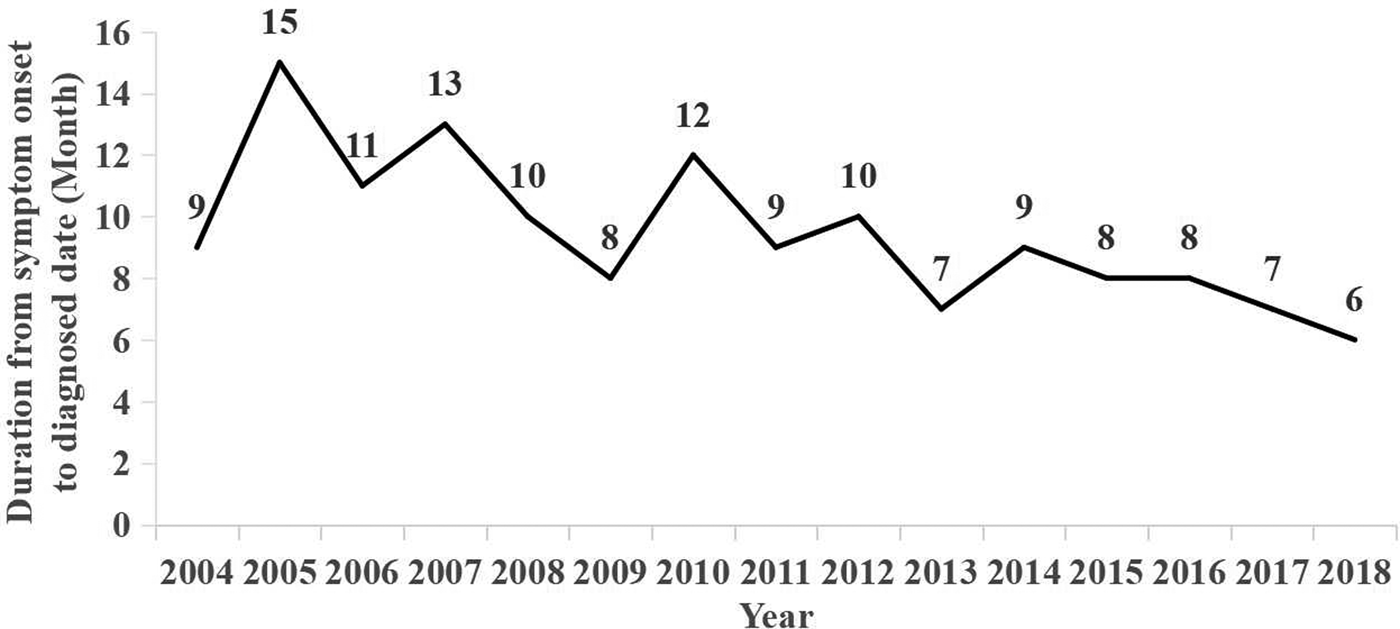
Fig. 4. Mean time interval between time of onset and diagnosis (in months).
The incidence of hepatitis C in all districts and counties (cities) of Xiamen City from 2004 to 2018 is described as follows (unit/1 million): the mean incidence of HCV was 52.95 (95% CI 42.86–63.04) in Huli district, 79.07 (95% CI 63.82–94.32) in Siming district, 44.42 (95% CI 31.56–57.28) in Jimei district, 50.48 (95% CI 29.61–71.34) in Xiang'an district, 63.38 (95% CI 45.45–81.31) in Haicang district and 35.77 (95% CI 27.62–43.91) in Tong'an district. Spatial coordinates of the incidence of hepatitis C in six districts of Xiamen from 2004 to 2018 (Fig. 5) show that the incidence of hepatitis C in all districts of Xiamen City was at a low level from 2004 to 2006. The incidence rates in Siming district and Huli district were the highest in Xiamen from 2005 to 2014, and the incidence rates in Siming district and Huli district were lowest among all districts of Xiamen from 2015 to 2018. Therefore, the incidence rates in Siming district and Huli district decreased rapidly after 2015. In general, the incidence of disease in all districts of Xiamen City after 2009 was significantly higher than that before 2009.
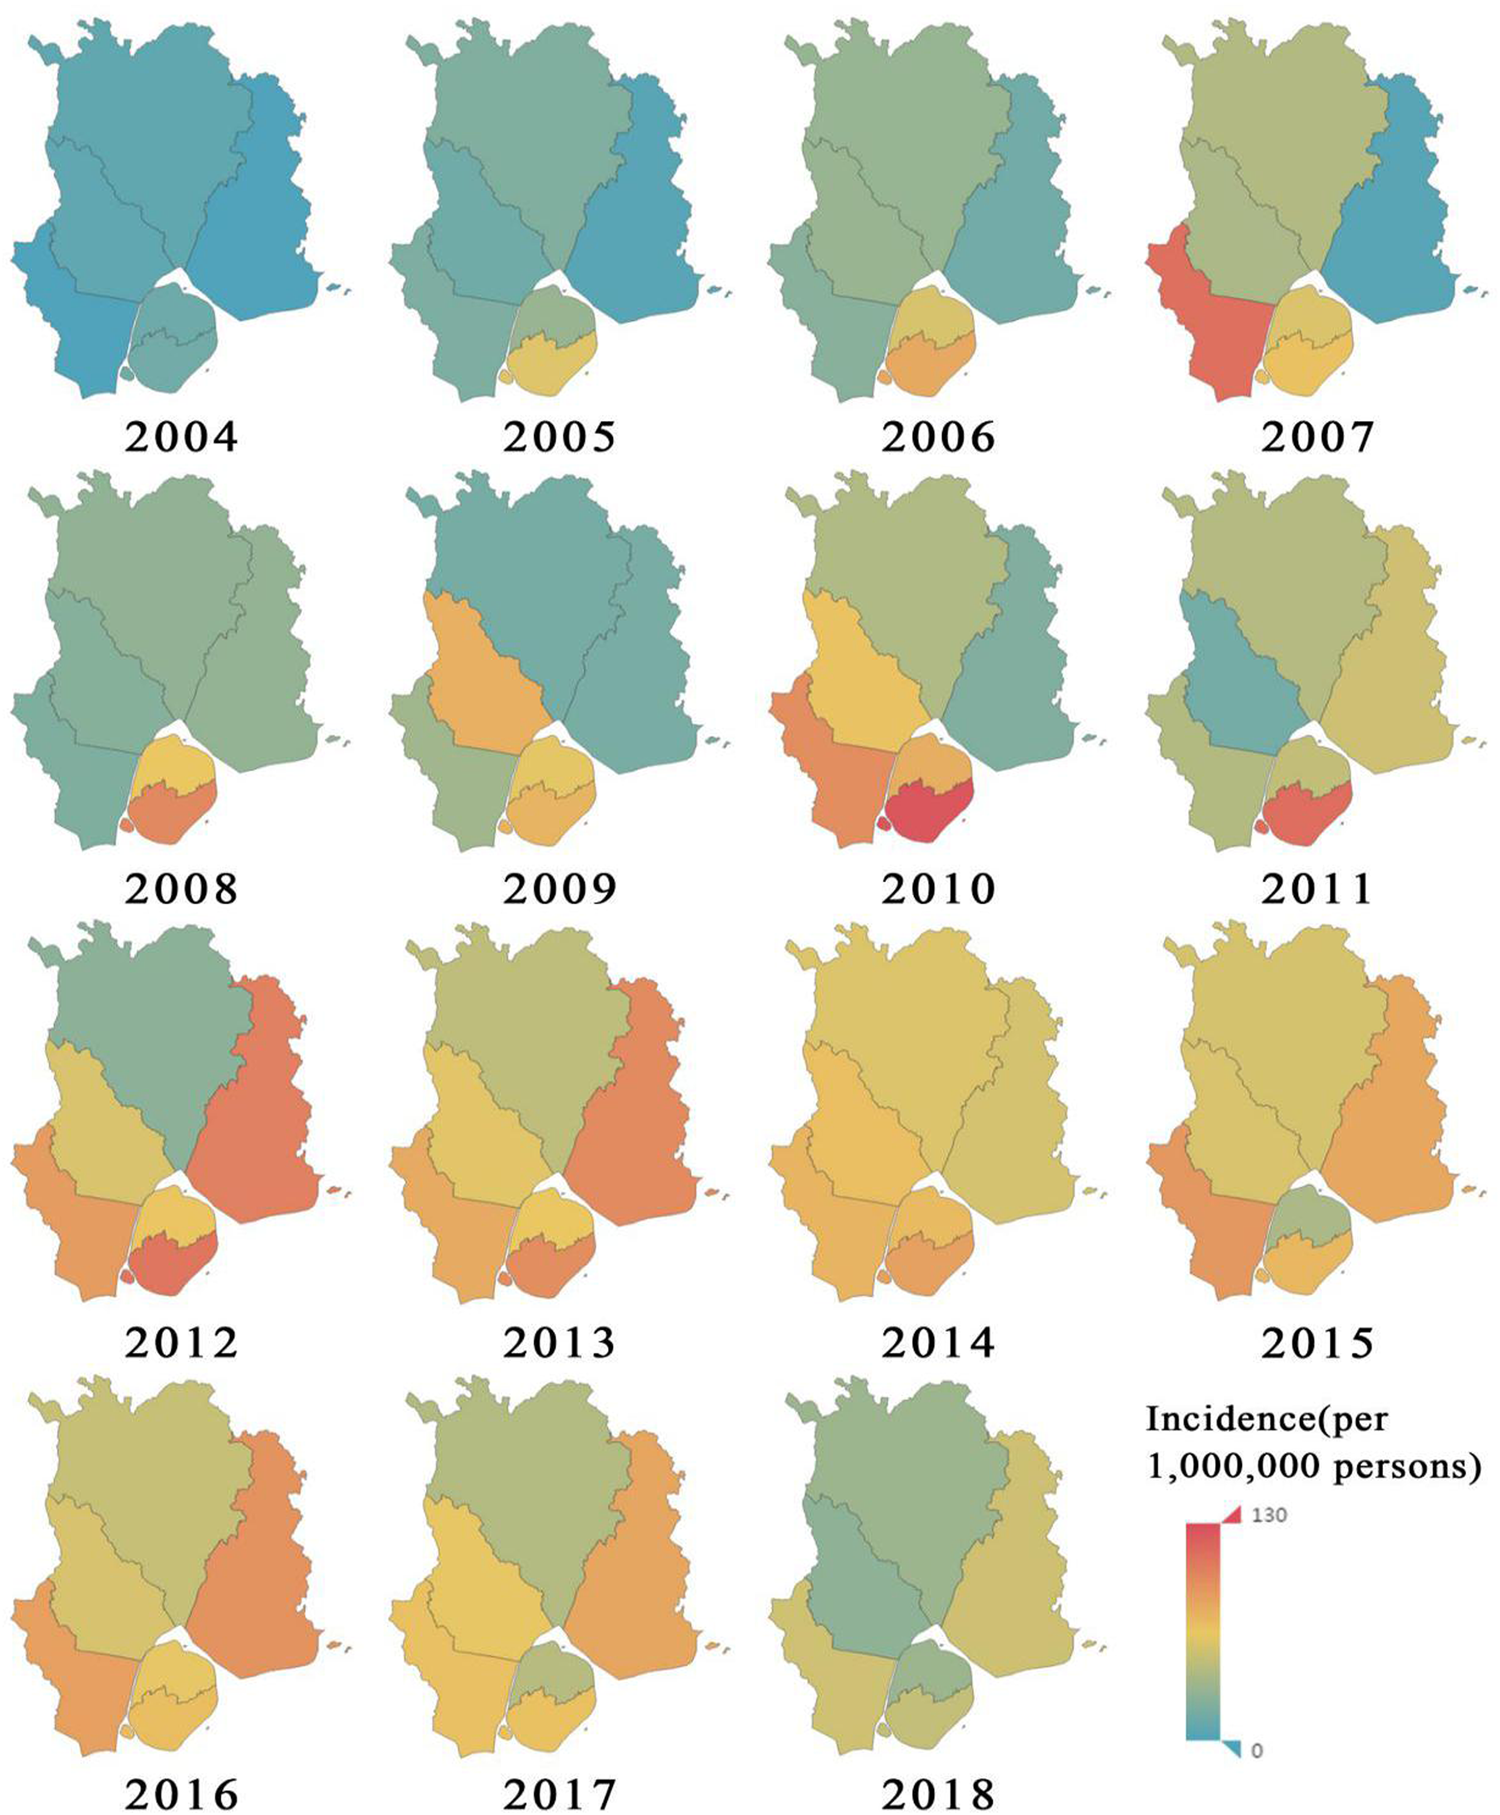
Fig. 5. Statistical chart of annual incidence of hepatitis C in various districts of Xiamen City.
Transmissibility of hepatitis C
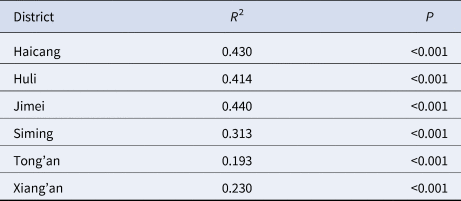
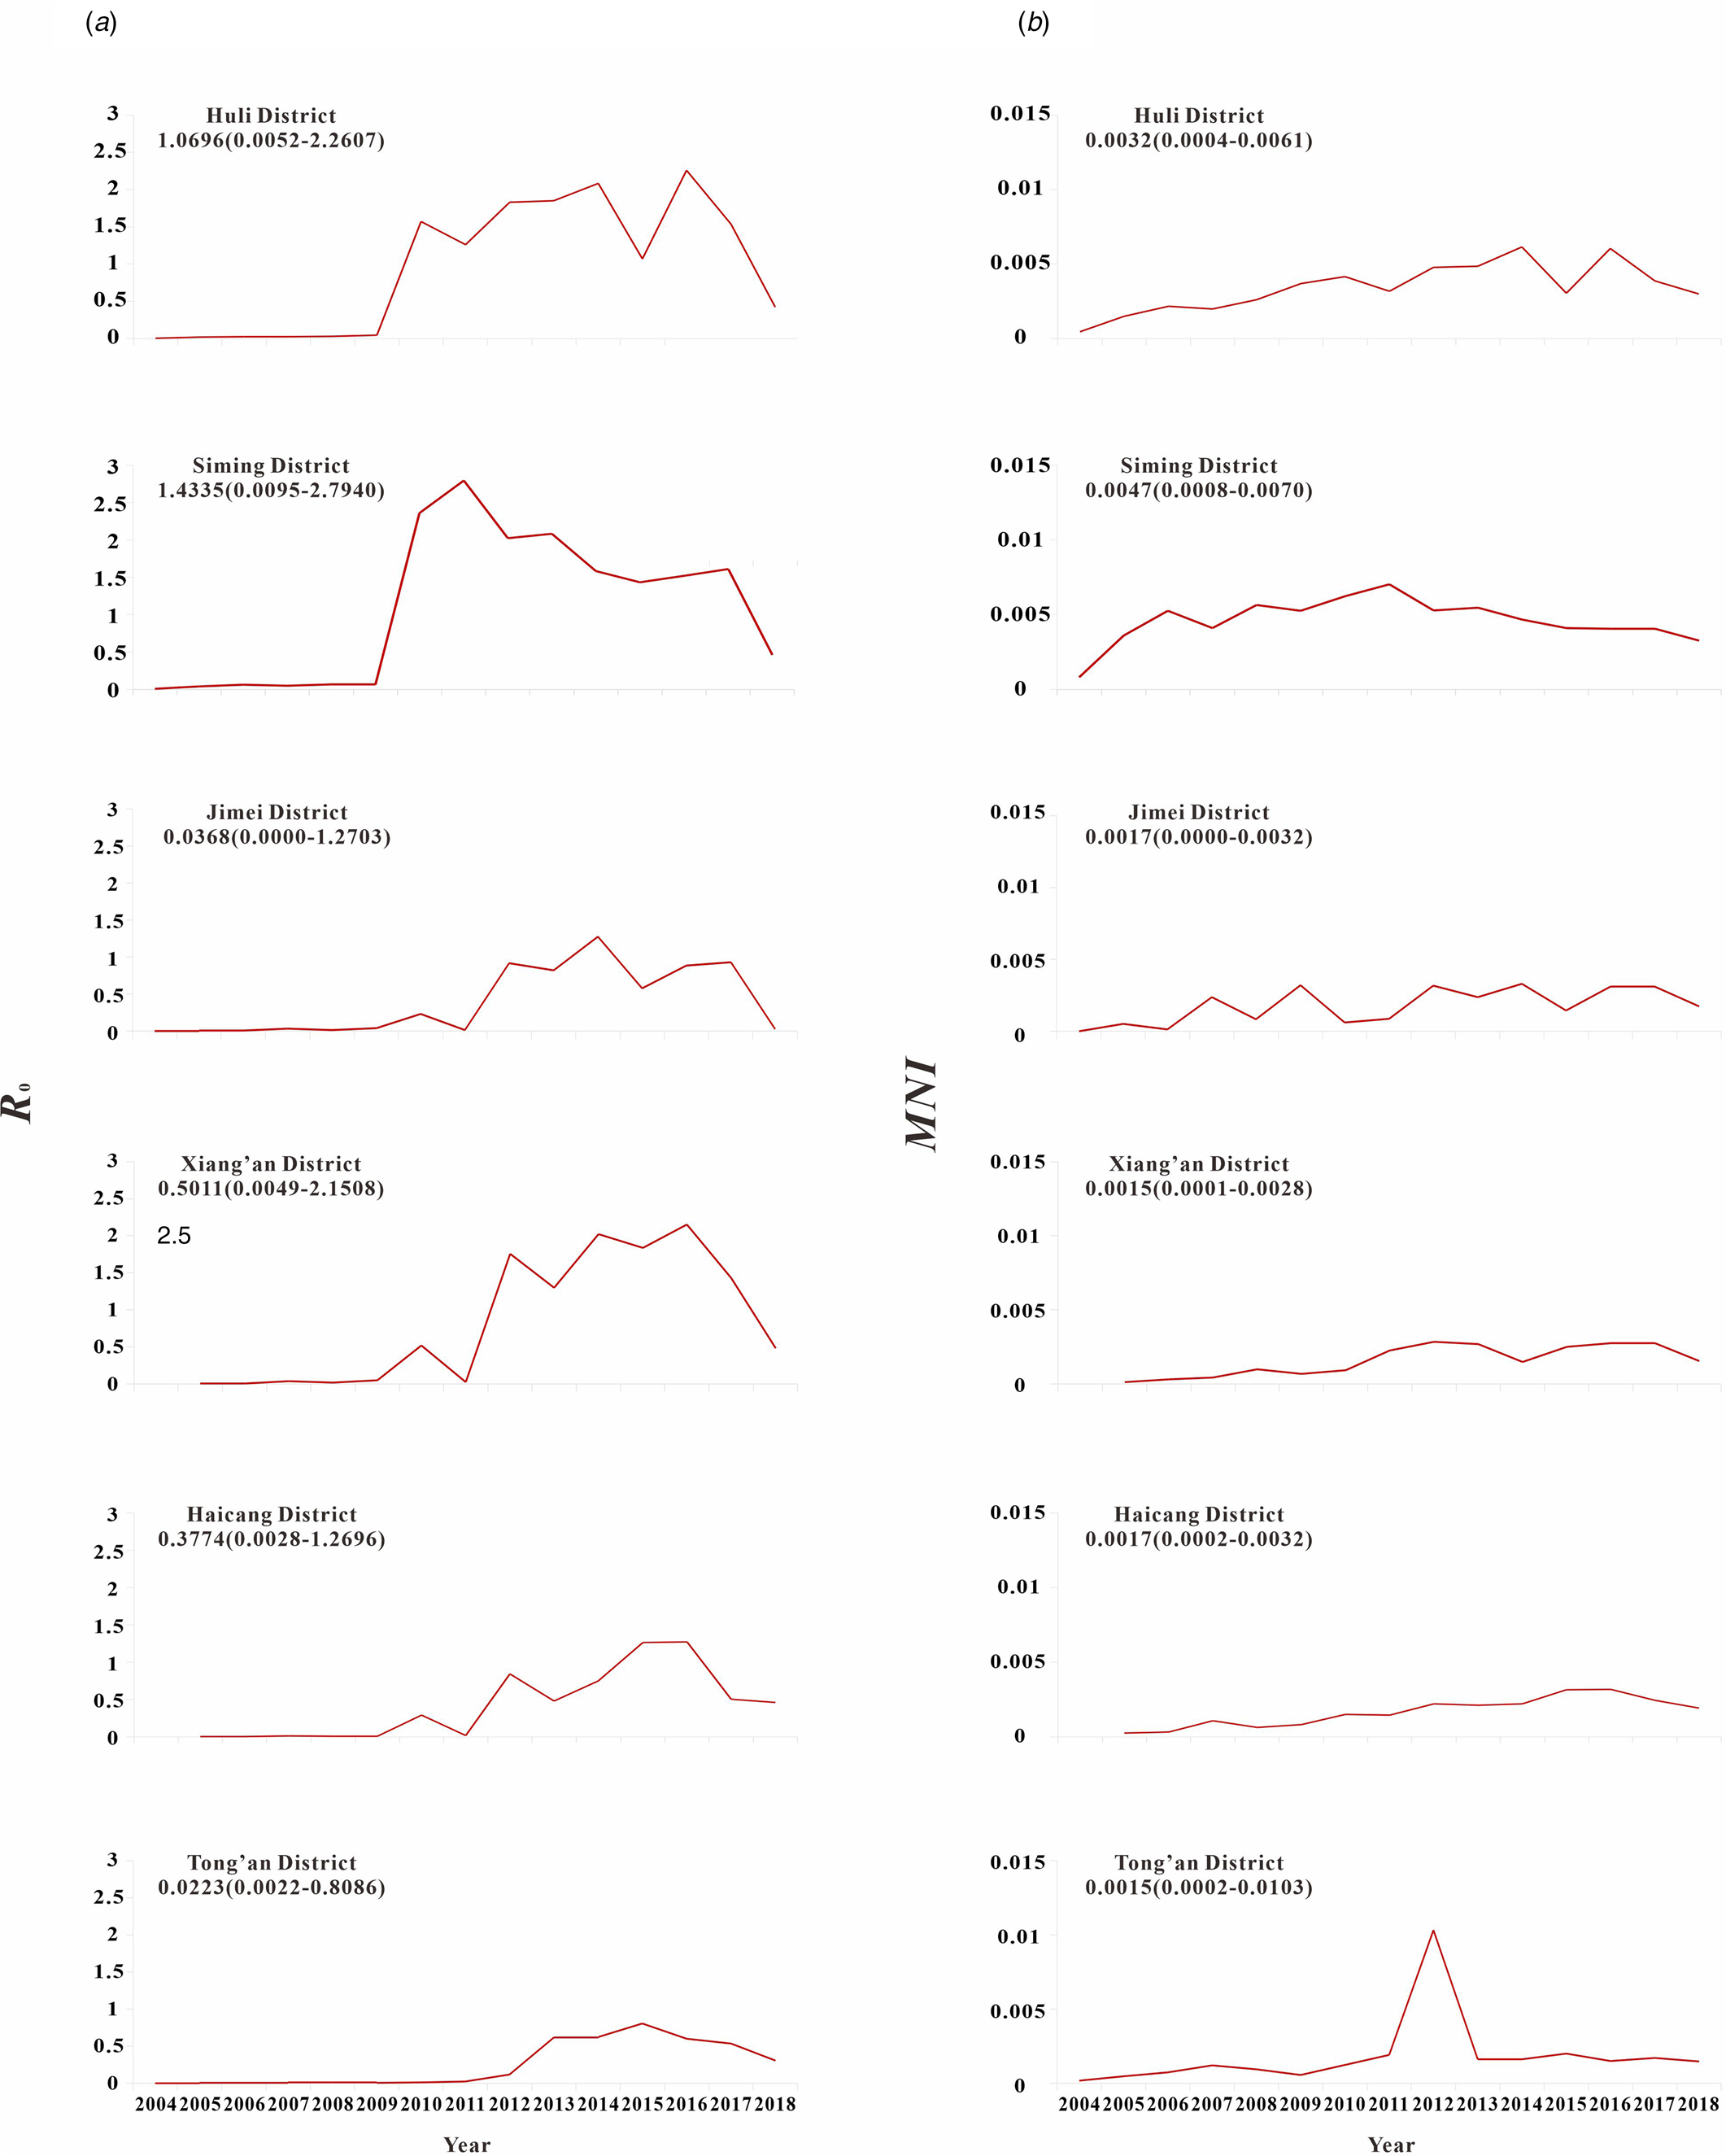
The results of model fitting curve and actual case change curve shows that the fitting effect of the curve between the predicted number of chronic disease cases per month and the actual number of chronic disease cases per month in six districts of Xiamen City was statistically significant, with an R 2 range of 0.193–0.440, P < 0.01 (Fig. 6 and Table 1). From 2004 to 2018, R 0 values and MNI values in the six districts of Xiamen increased initially, and then decreased slowly (Fig. 7). The median value and threshold of R 0 in each district are described as follows: 1.07 (0.01–2.26) in Huli district, 1.43 (0.01–2.79) in Siming district, 0.04 (0.00–1.27) in Jimei district, 0.50 (0.00–2.15) in Xiang'an district, 0.38 (0.00–1.27) in Haicang district and 0.02 (0.00–0.81) in Tong'an district. The median MNI and threshold values in each district are described as follows (unit/10 thousandth): 31.75 (4.49–61.40) in Huli district, 46.61 (8.21–70.31) in Siming district, 17.27 (0.03–32.81) in Jimei district, 15.11 (1.23–28.34) in Xiang'an district, 17.15 (2.45–31.83) in Haicang district and 14.80 (1.92–103.15) in Tong'an district. From 2004 to 2018, the median, minimum and maximum variation curves of R 0 value and MNI value in all districts of Xiamen City are shown in Figures 8 and 9. According to the curve change of median R 0 value, it can be seen that it was at a low level before 2009, increased from 2009 to 2014 and decreased from 2014 to 2018. According to the change of MNI median value curve, it can be seen that it showed an upward trend from 2004 to 2012, and a downward trend from 2012 to 2018. The overall median values of R 0 and MNI from 2004 to 2018 were 0.4059 (0.0037–1.4262) and 0.0020 (0.0003–0.0040), respectively.
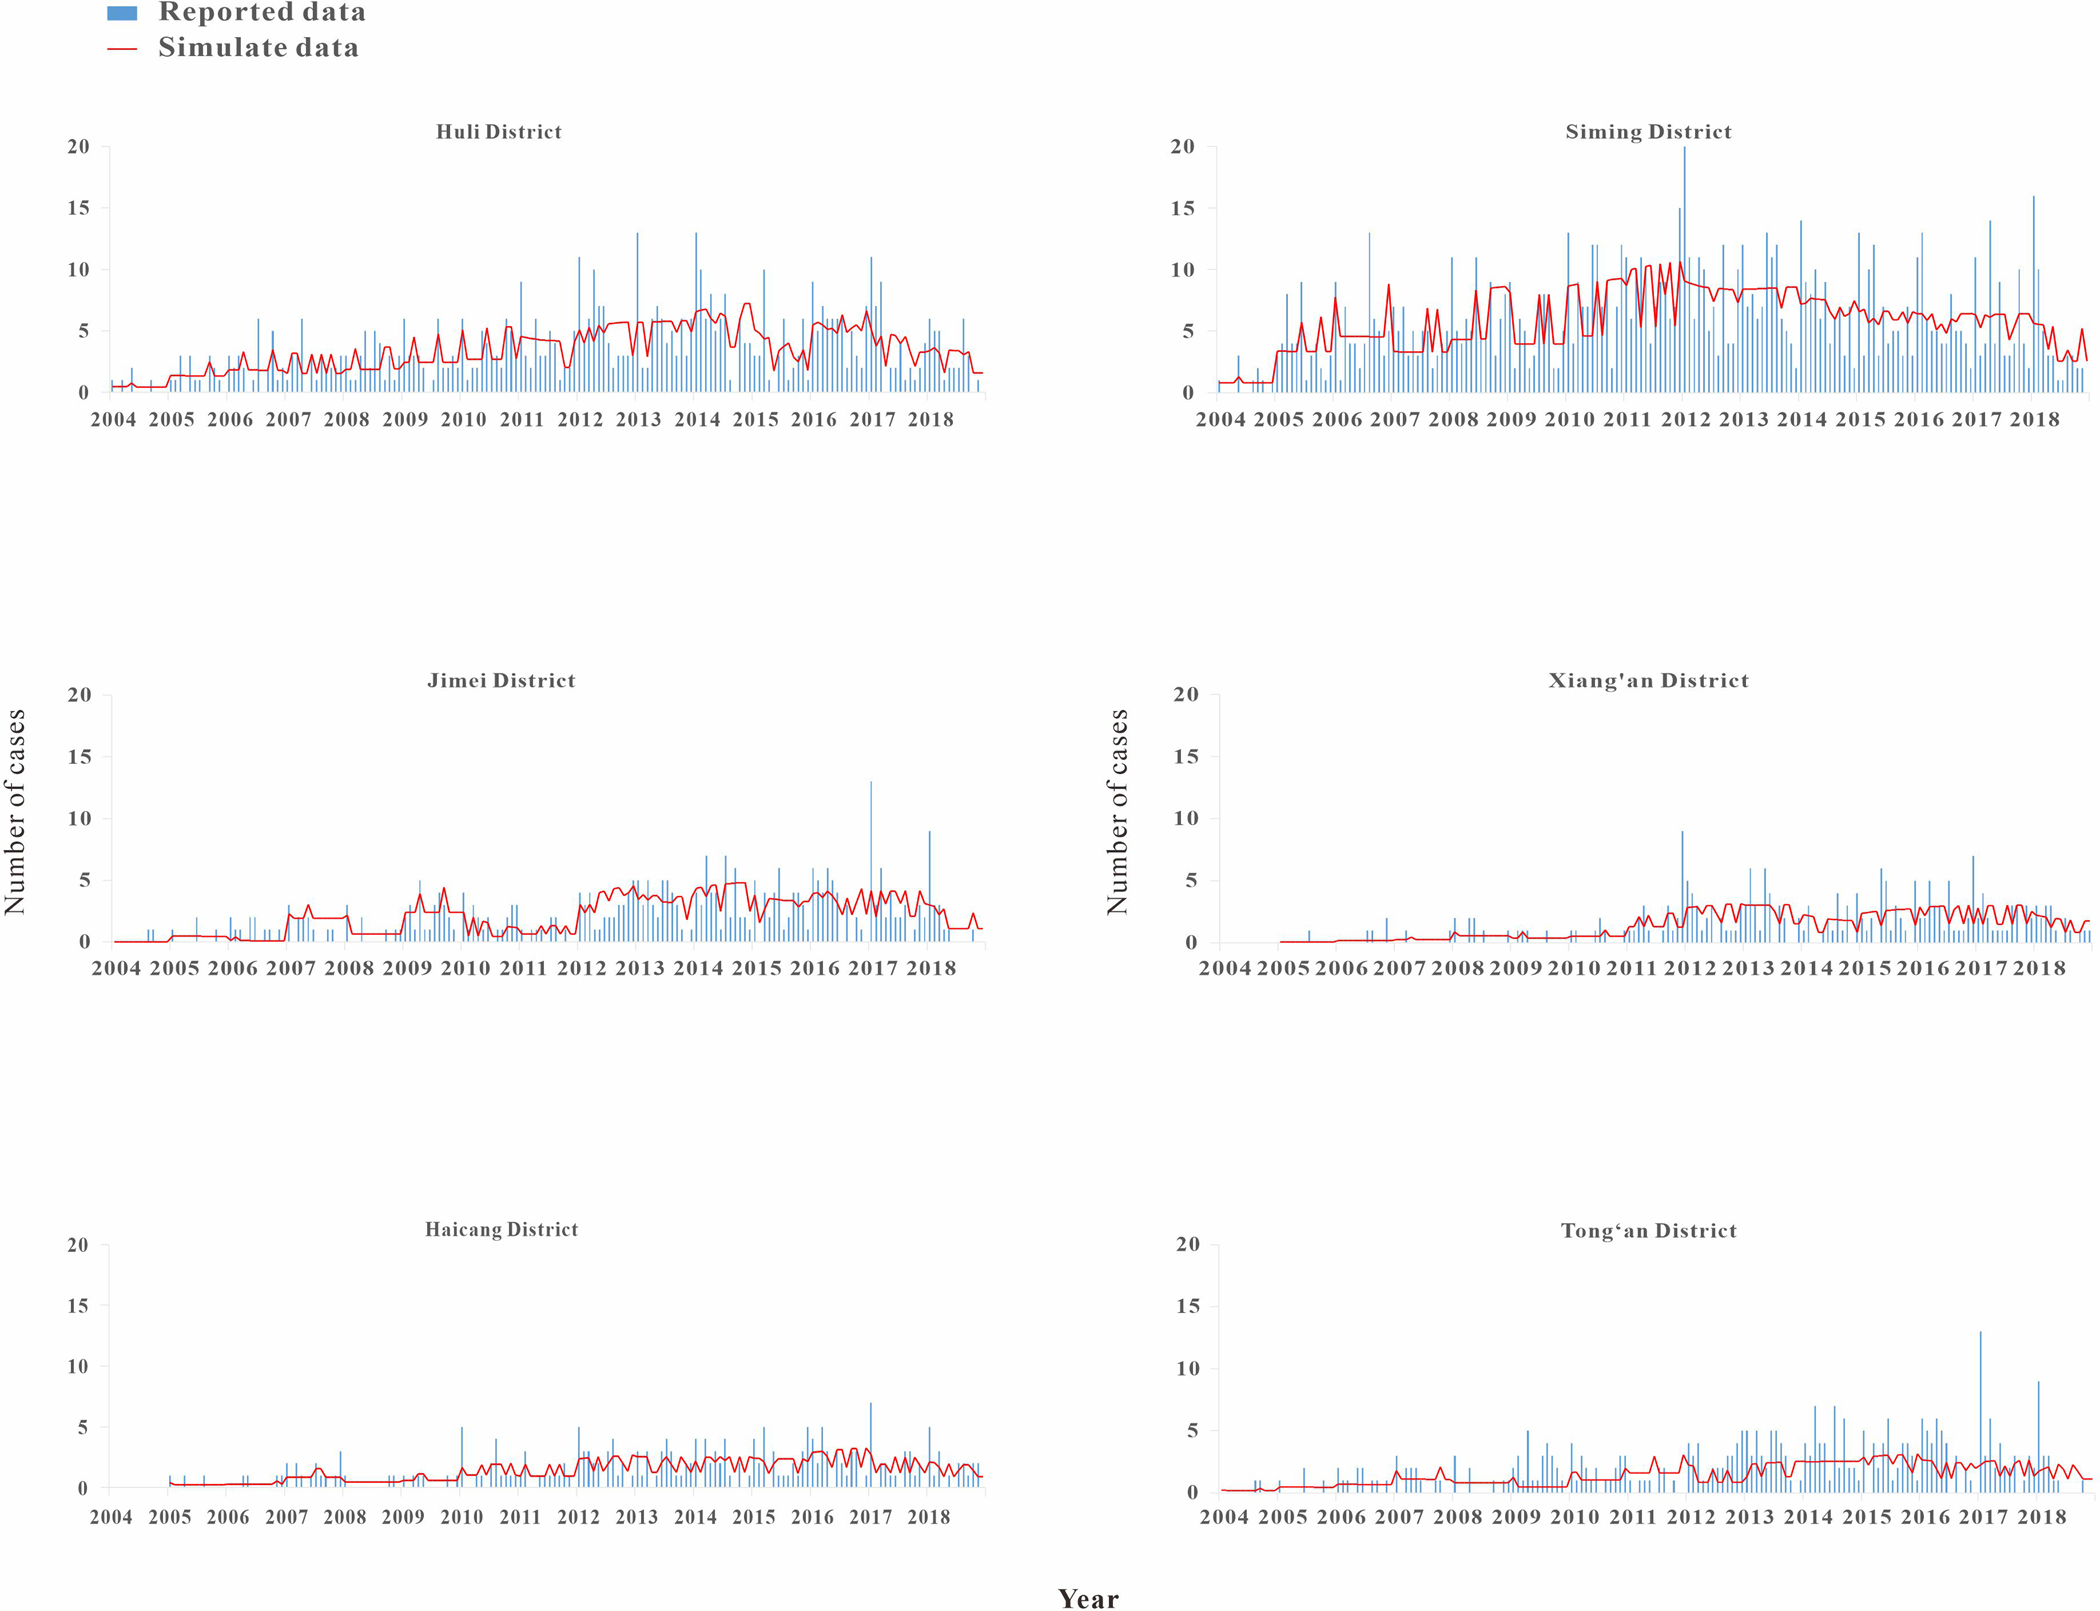
Fig. 6. Results of model fitting curve and actual case change curve.

Fig. 7. R 0 and MNI were used to represent the transmissibility of hepatitis C in six districts of Xiamen City. (a) The curve of the median of R 0; (b) the curve of the median of MNI.
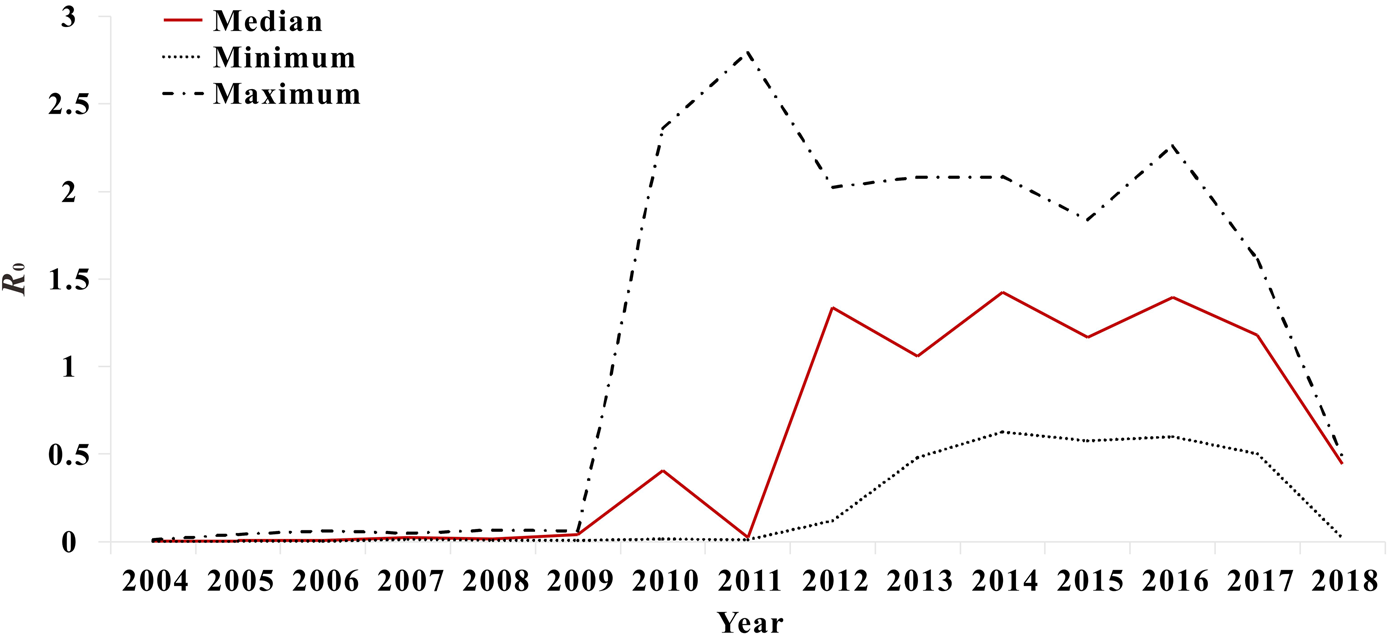
Fig. 8. Variation trend of median, minimum and maximum value of R 0 in Xiamen.
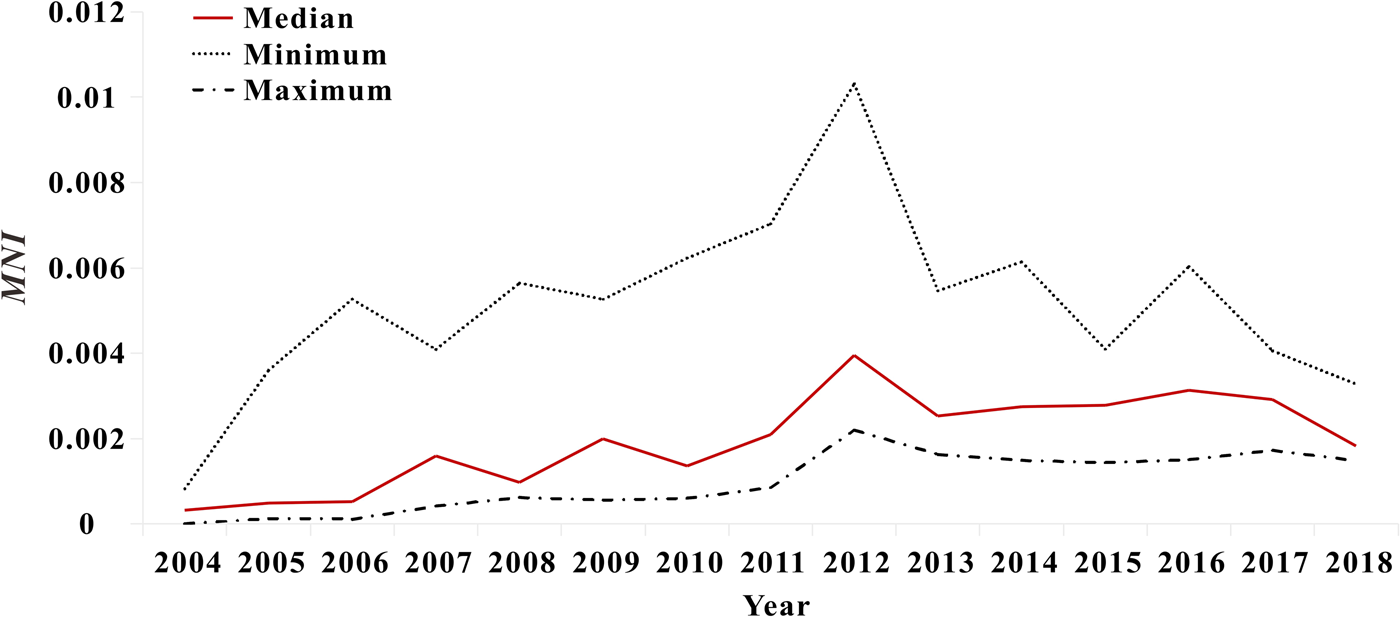
Fig. 9. Variation trends of median, minimum and maximum of MNI values in Xiamen.
Table 1. Estimation of fitting degree curve between model and actual situation
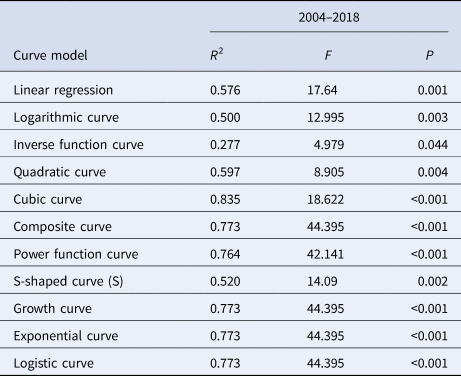
The median curve of R 0 value was fitted with 11 curve models (Table 2). According to the fitting results and the reduction or growth pattern of the virus in the process of population transmission, the cubic model, the composite function model and the power function model were selected as the appropriate models, which fitted the confidence band of the predicted value (Fig. 10). ‘x’ represents the time (year). After selecting the appropriate model for curve fitting, the formula for the change of R 0 value with time can be calculated. The median value of R 0 from 2004 to 2018 was fitted to the cubic model curve ‘R 0 = 0.6414 − 0.5471x + 0.1058x 2 − 0.0046x 3’, the median value of R 0 from 2004 to 2018 was fitted to the Compound curve ‘R 0 = 0.0033 × 1.5788x’ and the median value of R 0 from 2004 to 2018 was fitted to the Power function curve ‘R 0 = 0.0010x 2.5959’.
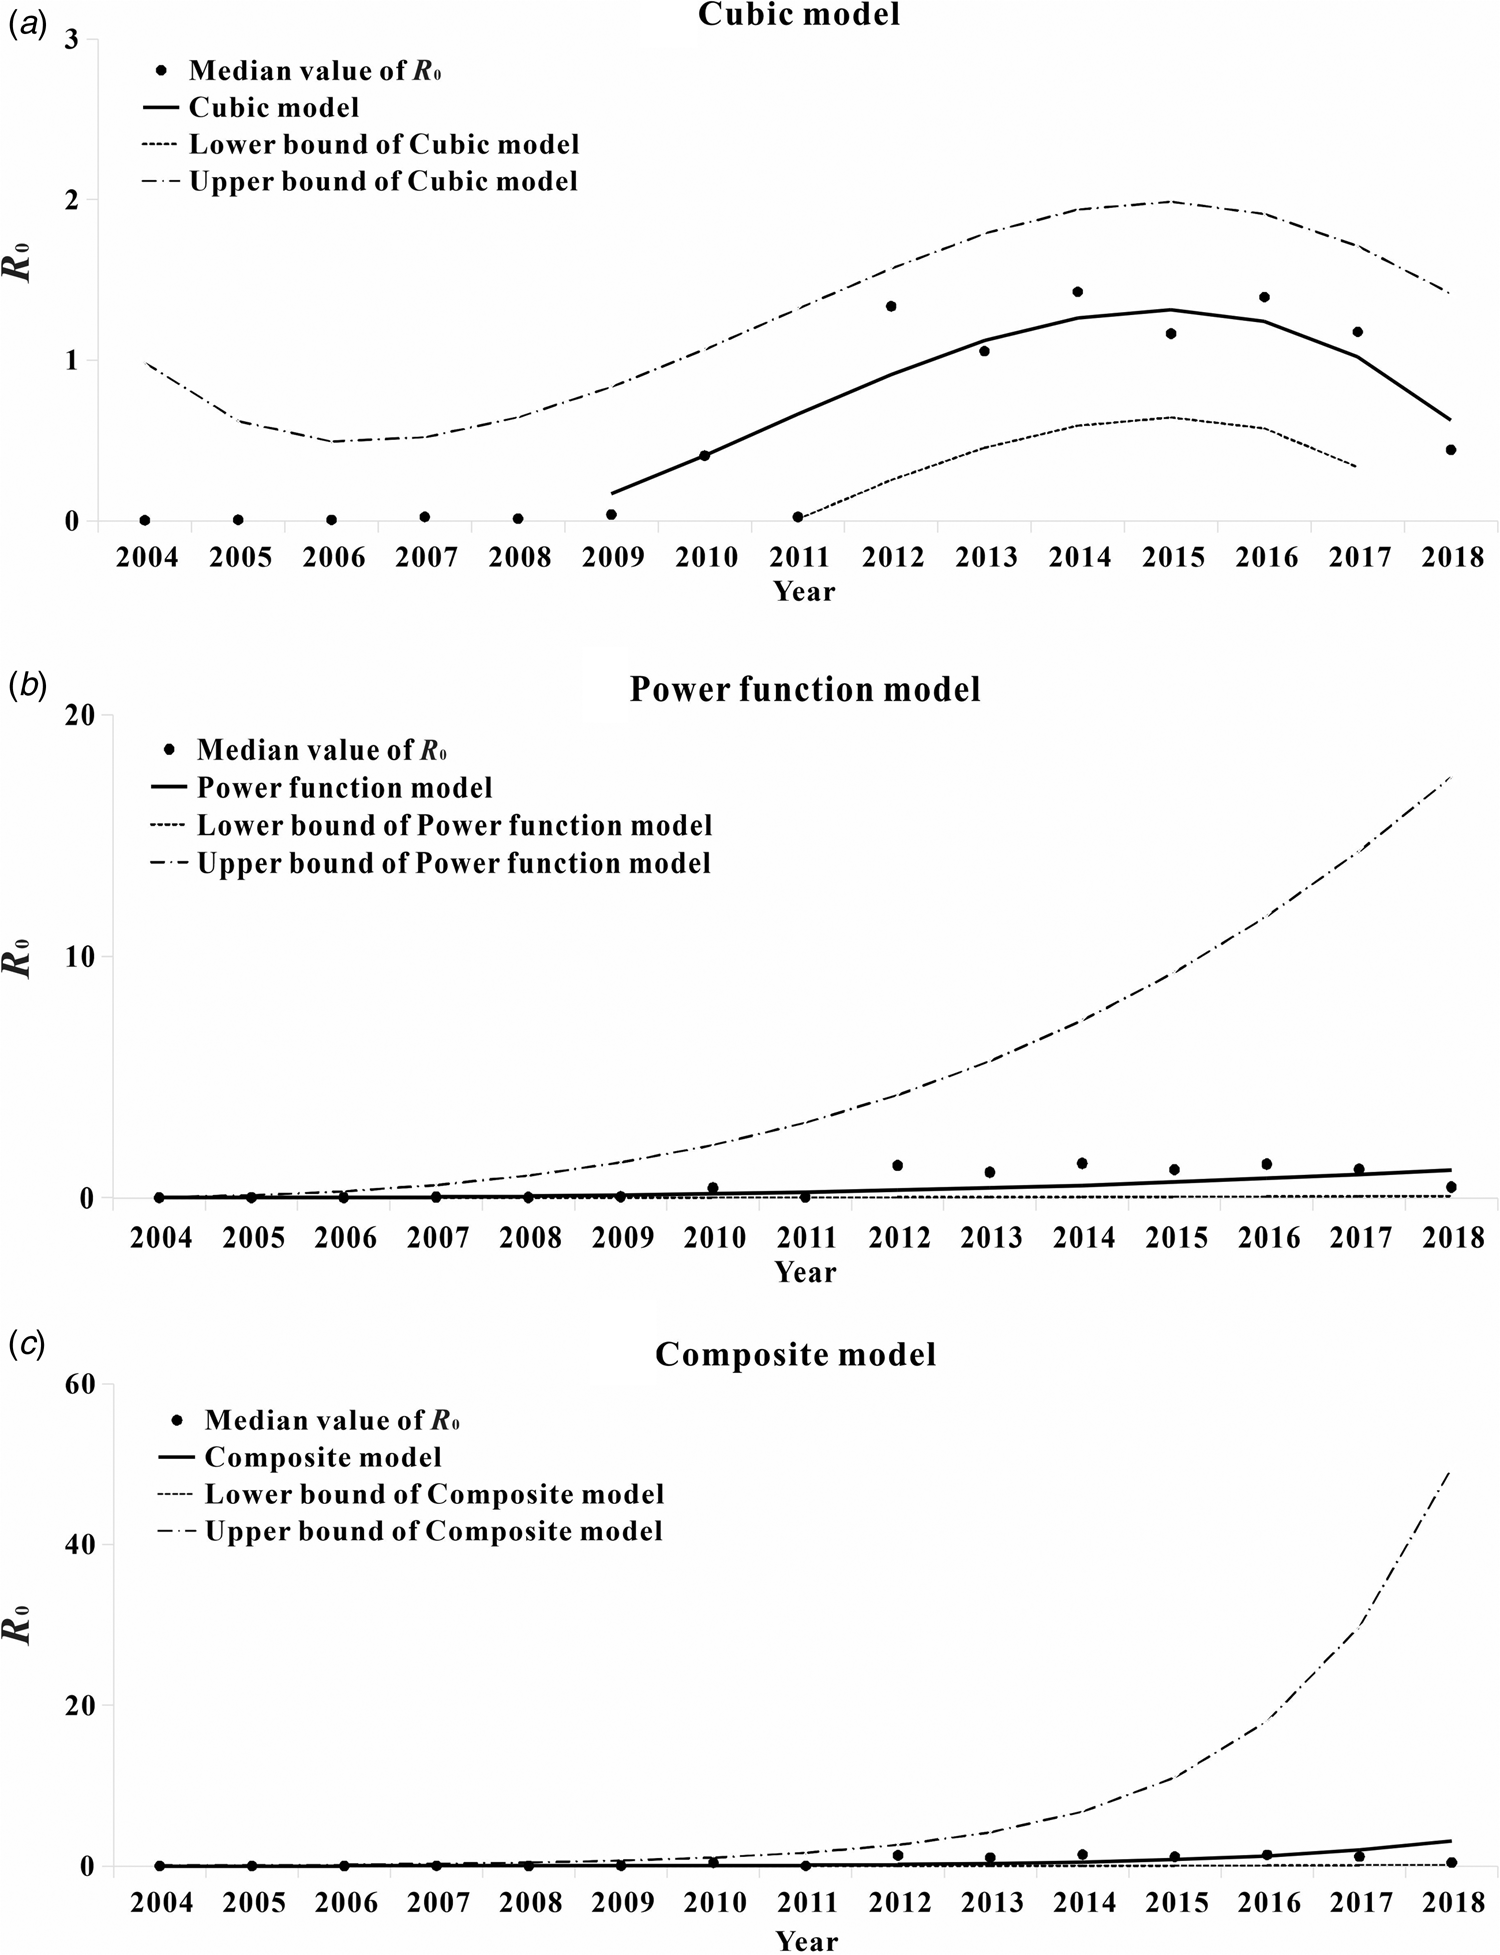
Fig. 10. Trend of R 0 value of hepatitis C transmissibility fitting curve by time. (a) The cubic curve; (b) the compound curve and (c) the power function curve.
Table 2. Various curve fitting results of R 0 value
The median curve of MNI value was fitted with 11 curve models (Table 3). According to the fitting results and the reduction or growth pattern of the virus in the process of population transmission, the cubic model, the composite function model and the power function model were selected as the appropriate models, which fitted the confidence band of the predicted value (Fig. 11). ‘x’ represents the time (year). After selecting the appropriate model for curve fitting, the formula for the change of MNI value with time can be calculated. The median value of MNI from 2004 to 2018 was fitted to the Cubic model curve ‘MNI = 0.0003 − 7.8077 × 10⁻⁵x + 7.4274 × 10−5x 2 − 4.1024 × 10−6x 3’, the median value of MNI from 2004 to 2018 was fitted to the Compound curve ‘MNI = 0.0005 × 1.1487x’ and the median value of MNI from 2004 to 2018 was fitted to the Power function curve ‘MNI = 0.0003x 0.8876’.
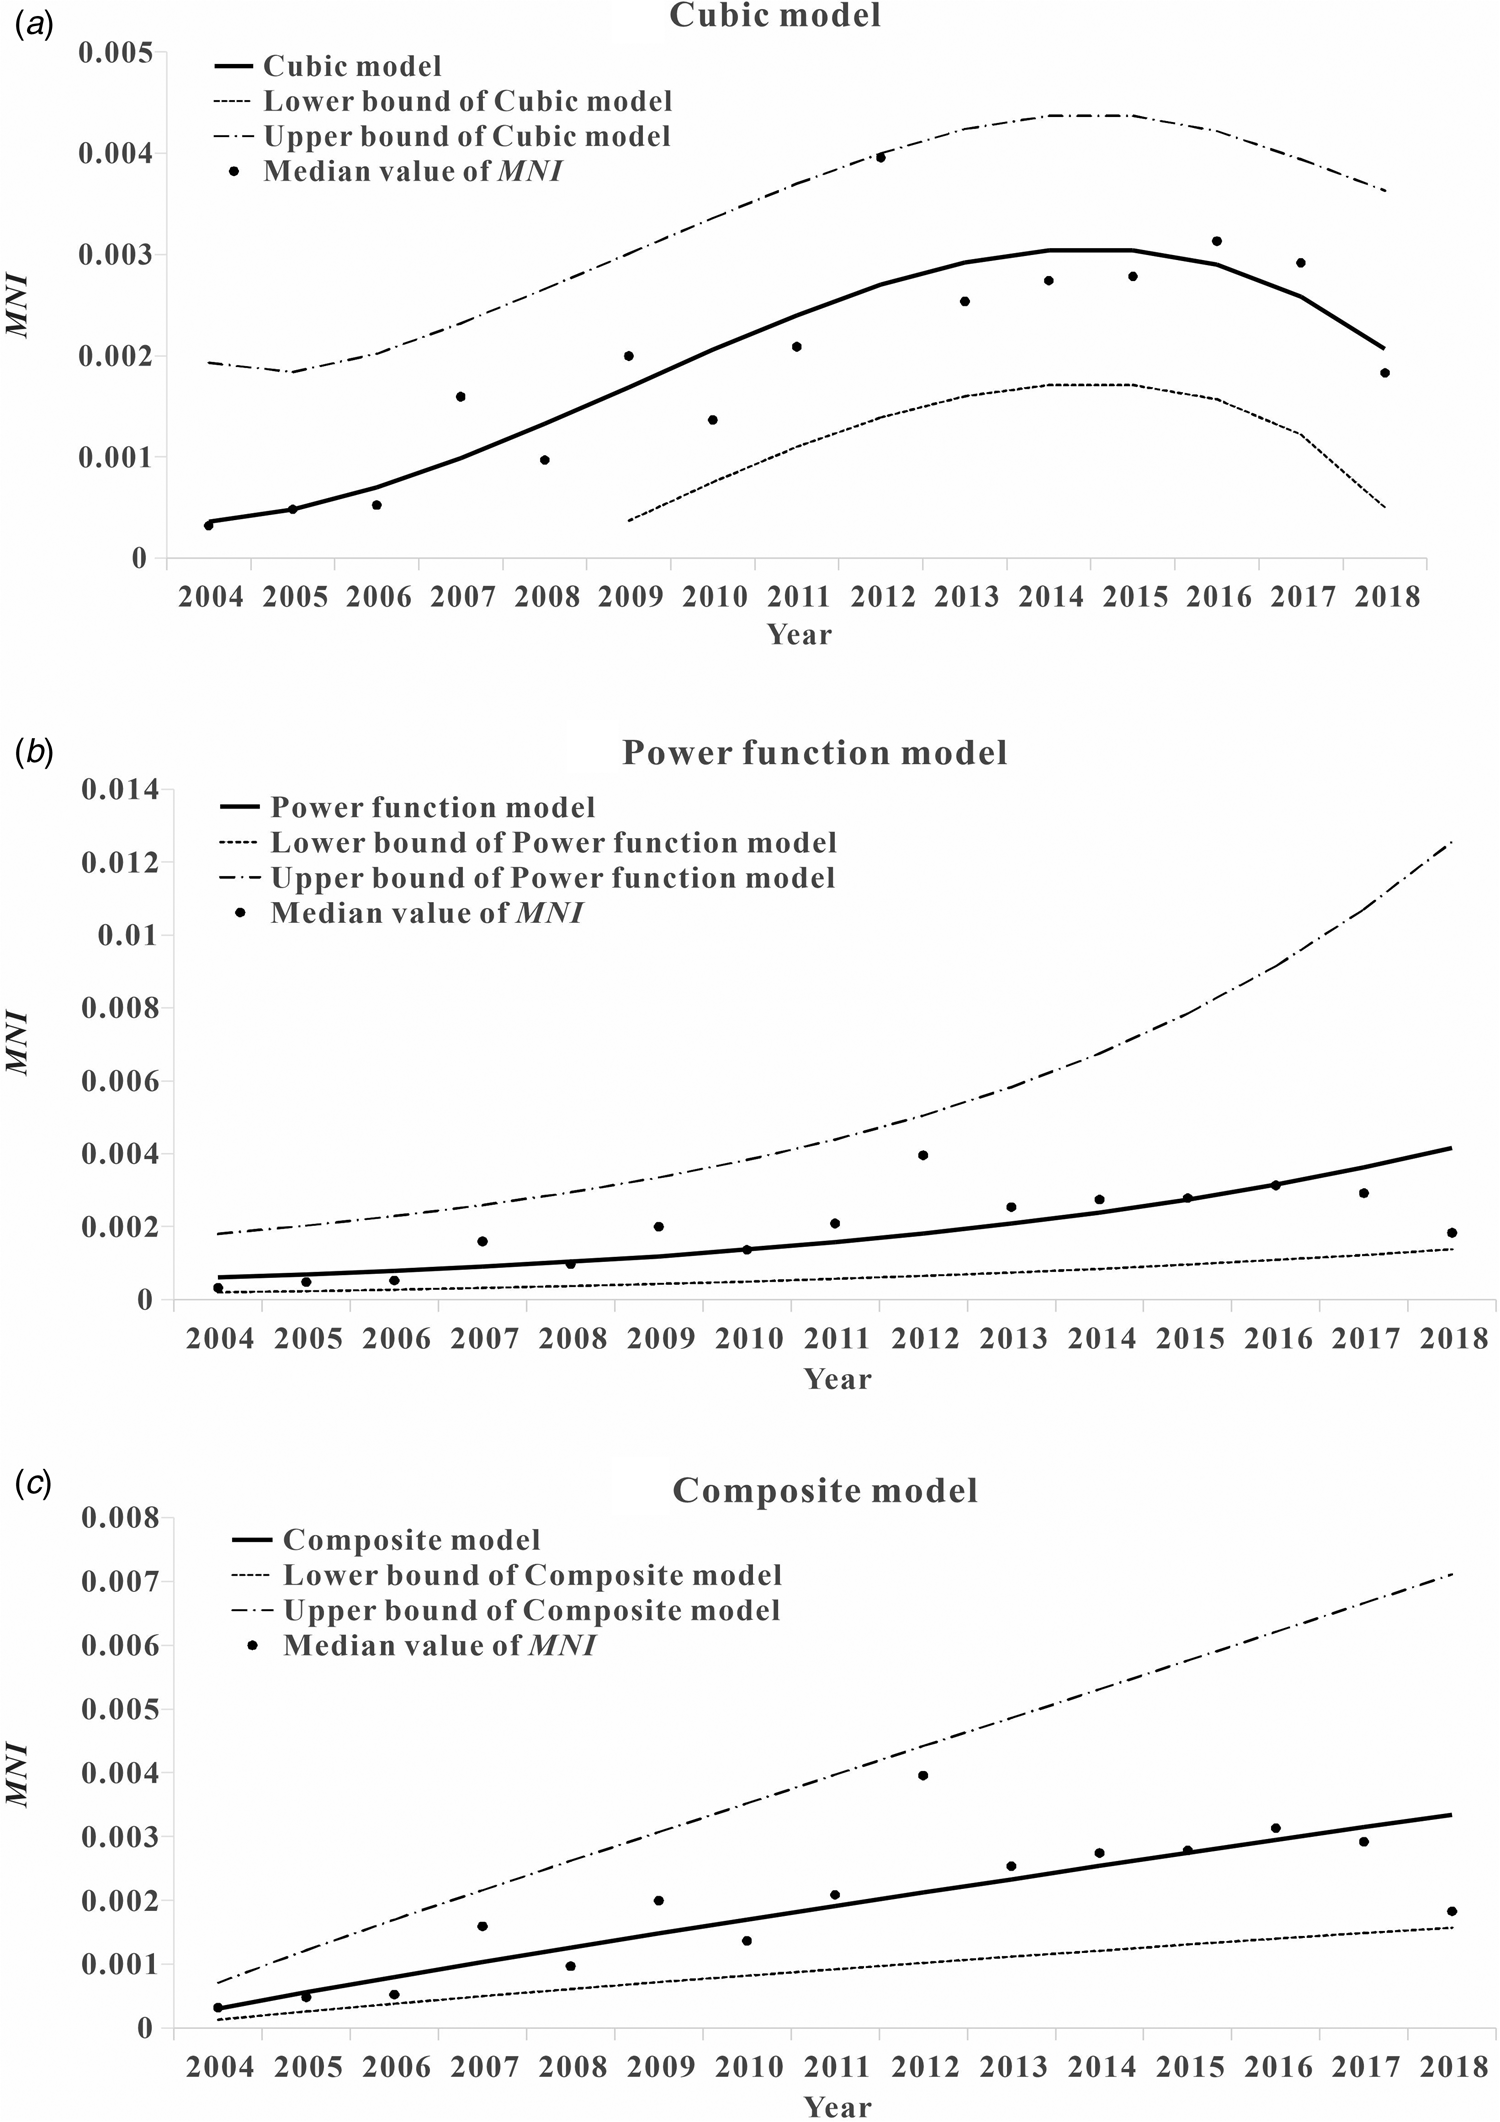
Fig. 11. Trend of MNI value of hepatitis C transmissibility fitting curve by time. (a) The cubic curve; (b) the compound curve and (c) the power function curve.
Table 3. Results of various curve fittings of MNI values
Discussion
The dynamic transmission model of infectious diseases has been established to take corresponding measures to predict the epidemic trend of hepatitis C in the future [Reference Zheng21–Reference Hutchinson24]. In accordance with the WHO's goal of eliminating hepatitis C in 2030, this study, for the first time, established an SCIR model and applied it to six districts of Xiamen City for data fitting. The study further evaluated its transmissibility and provided a basis for the formulation of prevention and control measures for hepatitis C.
Index of transmissibility
In this study, the basic regeneration numbers R 0 and MNI were used to estimate the transmissibility of infectious diseases. These two indicators can minimise the errors caused by the difference in the stage of infection between chronic cases and acute cases. The innovative of this paper is to use the MNI, domestic rarely used transmissibility index, combined with data from our country's system of infectious diseases for HCV incidence in 2004–2018. According to the changing trend of infectious disease incidence, the data combined with a mathematical model, can more accurately evaluate effectiveness of some prevention and control measures.
Model validity
According to the goodness of fit test between the number of monthly morbidity fitted by the model and the actual monthly morbidity, we observed that the fitting results of the six districts in Xiamen were statistically significant (P < 0.001). At the same time, only chronic cases were included in the study model, which could avoid the error caused by the discrepancy in the stage of infection between chronic cases and acute cases. In addition, the basic regeneration number R 0, an indicator of hepatitis C transmissibility, represents the number of new cases directly transmitted within the infectious period of a source of infection. The number of new cases transmitted every month, MNI, can predict the average number of new infections transmitted by an infected individual within a month, and simplify the prediction index.
Epidemiological characteristics
According to the results (Fig. 1), before 2012, there were more cases of acute hepatitis C than chronic hepatitis C. But after 2012, there were more cases of chronic hepatitis C than acute hepatitis C. The possible cause of this situation is that, with the introduction of a series of policies for prevention and control of hepatitis C in China, the incidence of acute hepatitis C has been effectively controlled, and the growth rate of acute hepatitis C cases has gradually decreased. However, the previous acute hepatitis C cases were further transformed into chronic hepatitis C cases, and the decrease in mortality caused by the improvement in the level of treatment for chronic hepatitis C gradually increased the number of chronic hepatitis C cases.
According to the results (Fig. 3), the interval between onset and diagnosis showed a general decreasing trend from 2004 to 2018. A faster diagnosis reflects the improvement of China's diagnosis and treatment system, and the change of people's concept of hepatitis C infection makes diagnosis and treatment more timely. With the progress of the medical and health system, the prevention and treatment of hepatitis C in China will be more successful.
It is known that the main route of transmission of hepatitis C cases is blood transmission, and the susceptibility factors are drug abuse by common injection equipment, unhygienic blood transfusion equipment and irregular blood donation channels [Reference Corson, Greenhalgh and Hutchinson14, Reference Martin, Hickman and Hutchinson25–Reference Vickerman, Hickman and Judd28]. In the future prevention and treatment of hepatitis C, we should take a strict inspection of drug equipment, focusing on the supervision of blood donation institutions, in order to prevent this aspect of infection.
Assessment of the transmissibility of hepatitis C
R 0 value and MNI value were used to evaluate the transmissibility of hepatitis C. According to the model's prediction, the median value of R 0 in the six districts of Xiamen was 0.4059, that is, the number of new cases directly transmitted within the infectious period of a source of infection was 0.4059. The median MNI was 0.0020, meaning that a known case of hepatitis C can infect 0.0020 patients in a month. Combined with the R 0 curve of transmissibility of hepatitis C in the six districts of Xiamen City, the number of cases of hepatitis C has decreased in recent years. As can be seen from the MNI annual average trend chart of Xiamen City, the incidence of hepatitis C declined after 2012, indicating that under the control of current prevention and control measures of hepatitis C in China, the incidence of hepatitis C decreased yearly. Finally, the incidence of hepatitis C could be controlled at a lower level.
Breban et al. found that Egypt had an R 0 of 3.54 without any intervention factors [Reference Breban16]. Compared with the conclusion of this study that the median R 0 of each district in Xiamen is 0.4059, the current transmissibility of hepatitis C in China is lower than that in Egypt without intervention. Although Egypt and China are both developing countries, due to a better living habits and more strict control of the government and residents towards drug use, China has a lower incidence of hepatitis C through drug injections. At the same time, the level of economic development may also affect the transmissibility of hepatitis C. For example, the transmissibility of hepatitis C in Xiamen is similar to that of Iceland [Reference Scott29]. Xiamen is an economically developed city in China, with higher medical and health standards, and more secure invasive medical procedures.
Due to the high price of direct-acting antiviral drugs for hepatitis C treatment [Reference Heffernan12], most patients cannot bear the economic burden involved in its treatment. In China, drugs for treatment of hepatitis C have not been used on a large scale, given that the model used in this study appropriated to the actual situation of hepatitis C treatment in China; as a result, the factors involved in the treatment of hepatitis C have not been considered.
And we found in the study of adding intervention factors that if everyone in Egypt follows the average behaviour (2.1 injections and 0.23 invasive medical procedures per year), that is, R 0 is 0.64 without treatment based only on high-risk behaviour control [Reference Breban16]. If the measures for prevention and treatment of individuals were focused on reducing the number of chronic infections that result due to high rate of medical injections, then the value of R 0 could be lower than 1. With the expansion of the treatment scale in Iceland, the basic reproduction number of HCV dropped from 1.08 to 0.59 [Reference Scott29]. Currently, a small number of places in China have started drug treatment plans, but because we are unable to obtain detailed data, this study has not yet added intervention factors related to treatment or prevention and control, so our study may overestimate the transmissibility of hepatitis C in Xiamen City. The next step of our research is to investigate the effectiveness of treatments and prevention and control measures, to establish models for drugs and prevention and control measures, to evaluate the effectiveness of hepatitis C treatment, and to explore a more accurate trend for the transmissibility of hepatitis C in China.
Limitations
The purpose of the study was to determine whether the model could correctly estimate the future incidence of hepatitis C in China, and to apply the model to the incidence of hepatitis C in China with different environmental factors. In this study, data from only six districts of Xiamen were included in the model, which inevitably resulted in the deviation of fitting degree and expectation. In the future study, the data of different provinces and cities can be added to better the fitting effect. Although the SICR model fitting effect shows that the coefficient of determination is statistically significant, the coefficient of determination is however small (0.193–0.440), which may be related to the low number of cases in each region.
According to the curve of the annual median change of R 0 in each region, it can be seen that before 2009, R 0 was at a low level, and after 2009, R 0 suddenly increased to a higher level. The reason for this phenomenon is that, as shown in the epidemiological characteristic chart, there were many unclassified cases from 2004 to 2009, and the P value used to fit the model was not included in the unclassified cases, so R 0 was at a low level. As the number of years increases, the data classification becomes more detailed, so the prediction of the model becomes more stable, thus the value of R 0 increases. Based on the above inference, the R 0 value calculated in this study may be underestimated.
In the past few years, Chinese drugs for treatment of hepatitis C have been expensive, and the availability of specific drugs for hepatitis C patients is not very high, so the cure rate of hepatitis C in China is low. Due to the above factors, reinfection accounts for a very low proportion of all hepatitis C infections, so the reinfection factor of hepatitis C has not been considered in this study. However, in terms of the current status of global hepatitis C infection, drug injection is the main cause of HCV infection, and drug users are high-risk groups of hepatitis C reinfection. This shows that there are still reinfections on a global scale. According to the study of Nazrul Islam MBBS [Reference Islam, Krajden and Shoveller30], the rate of hepatitis C reinfection is approximately 1.27 per 100 person-years (95% CI 1.15–1.39). The systematic review of hepatitis C reinfection by Bart P. Grady shows that in the six studies that followed up person-year (PY) data, the reinfection rate ranged from 0.8 to 4.7 per 100 PY. Therefore, the reinfection of hepatitis C is one of the factors that have to be considered when constructing the hepatitis C transmission dynamics model. In this study, all the HCV infection was attributed to the contact of susceptible people with the source of infection, which may overestimate the occurrence of this situation, and therefore may overestimate the transmissibility of hepatitis C in Xiamen City. The focus of our future research is to build a model that adds hepatitis C reinfection factors, determine the proportion coefficient of hepatitis C reinfection in China and predict the transmissibility that is more in line with local actual conditions.
Conclusion
This study used R 0 and new indicator MNI to quantify the transmissibility of HCV by fitting the data of HCV incidence in six districts of Xiamen City. The data fitting effect of each district was good, which could be extended to the whole country for the study of HCV incidence. According to the fitting curve that demonstrates how changes in transmissibility occur over time for hepatitis C, transmissibility for hepatitis C in Xiamen's municipal districts exhibits a decreasing trend, and the average transmissibility is also on the decline, thus, it can be predicted that under the current preventive and control measures, future incidence rate will gradually reduce, making it possible for the incidence of hepatitis C to be controlled at a lower level.
Acknowledgements
The authors thank all study participants for providing the data and field investigators for collecting the data. We thank the support from Undergraduate Innovation Practice Platform of School of Public Health, Xiamen University.
Author contributions
TC, BZ and YS designed the study. MW collected data. TC, WY, MW, MNH, QH, ZZ, JR, XL, YZ, JX, MY and JC analysed the data. TC, YW, ZZ, MNH and QH wrote the first draft of this paper. All authors contributed to the writing of the manuscript.
Financial support
This study was partly supported by the Open Research Fund of State Key Laboratory of Molecular Vaccinology and Molecular Diagnostics (SKLVD2019KF005), the Bill & Melinda Gates Foundation (INV-005834), the Science and Technology Program of Fujian Province (No. 2020Y0002), the Xiamen New Coronavirus Prevention and Control Emergency Tackling Special Topic Program (No. 3502Z2020YJ03) and NHC Key Laboratory of Echinococcosis Prevention and Control (No. 2020WZK2001).
Conflict of interest
The authors declare that there are no conflicts of interest.
Data availability statement
The datasets used and analysed during the current study are available from Dr Mingzhai Wang (32639937@qq.com) on reasonable request.


 Open access