INTRODUCTION
Hepatitis C virus (HCV) is the most common bloodborne infection in the USA, with an estimated 3·2 million people chronically infected [Reference Armstrong1]. Injection drug use is a well-established risk factor for bloodborne infection [Reference Xian2, Reference Alter3]. In fact, as many as 90% of injecting drug users (IDUs) are infected with HCV within 5 years of initiating injection [4]. However, injection drug use and its associated risk do not occur in isolation, they are heavily influenced by the structure and composition of the social networks in which they arise [Reference Miller and Neaigus5, Reference De6].
IDUs' risk behaviour and susceptibility to infection are strongly influenced by that of their network members [Reference Neaigus7–Reference Rothenberg10]. For example, an individual's injection behaviour is influenced by their exposure to other IDUs [Reference Neaigus11, Reference Sherman12], particularly those who are friends [Reference Roy13], sex partners [Reference Neaigus14, Reference van Ameijden15], or family members [Reference Abelson16]. Previous research has also demonstrated an interrelated relationship [Reference De6] between large network size [Reference Rothenberg10, Reference Latkin and Mandell17], high network density [Reference Rothenberg10, Reference Latkin and Mandell17, Reference Latkin18], and high network turnover (e.g. people leaving or entering an IDU's network) [Reference Hoffmann, Su and Pach19] and risk behaviour in IDUs. The centrality of a drug user within his/her social network, as well as the types of relationships he/she has with network members can also play a role in risk behaviour [Reference Miller and Neaigus5, Reference De6].
The growing recognition of the contribution of social networks to IDUs' risk for HCV has led to a number of molecular epidemiological studies in which HCV RNA and genotype testing is conducted within networks [Reference Paintsil20–23]. While the literature on drug users' social networks consistently demonstrates a link between network structure and engagement in HCV risk behaviour [Reference De6], such findings have yet to be consistently substantiated by molecular epidemiological research examining HCV transmission within social networks of IDUs. For example, a recent study examining HCV genotype homology between dyads and recruitment chains generated from respondent-driven sampling (RDS) of IDUs found that individuals within recruitment dyads and/or chains had no more genetic similarity in their HCV infection than did those with more distant relationships [Reference Paintsil20]. Similarly, a study involving social network analysis and HCV phylogenetic analysis of Australian IDUs found a low level of correlation between drug users' social distance and the genetic relatedness of their HCV infections [Reference Aitken21]. On the other hand, a phylogenetic analysis of HCV-positive patients in a surveillance programme in Brazil concluded that different HCV subtypes were characterized by different social networks [Reference Romano22]. A social network study of IDUs by Aitken and colleagues [23] concluded that positive HCV antibody status was associated with having more network members who were aged ⩾18 years when they initiated injection drug use and with having other network members who were antibody positive. Positive HCV RNA status was also associated with having network members who were HCV RNA positive.
Given the inconsistencies in the extant literature, more research examining the distribution of HCV infection within social networks of drug users is warranted. Previous studies have primarily focused on heroin users [Reference Aitken21, 23], cocaine users [Reference De6], and needle exchange programme recipients [Reference De6] in urban, international settings [Reference De6, 20–23]. To our knowledge, no study has examined HCV RNA distribution in its association with social network characteristics in non-medical prescription opioid users (NMPOUs). Moreover, there is a substantial gap in previous research involving populations of rural drug users.
Non-medical prescription opioid use has become particularly problematic in the rural Appalachian region of Kentucky [Reference Young, Havens and Leukefeld24, Reference Young and Havens25], and evidence suggests that many drug users in the region are administering the prescription drugs via injection [Reference Young, Havens and Leukefeld24]. Given the increased risk of HCV transmission associated with injection drug use, a better understanding of the molecular and social epidemiology of HCV in this high-risk, understudied population of rural drug users is needed. The purpose of this exploratory study is twofold: to examine the distribution of HCV RNA-positive drug users within a network of NMPOUs in rural Appalachian Kentucky, and to examine the association of their individual-level, egocentric and sociometric risk network characteristics with HCV RNA status.
METHODS
Study sample
The study sample was drawn from a larger cohort of rural Appalachian NMPOUs (N = 436). The overall purpose of the longitudinal cohort study is to determine the prevalence and incidence of HCV, HIV and herpes simplex-2 virus in the context of rural drug and sex networks. A storefront location in a rural Appalachian town of approximately 5000 residents was used for participant recruitment and interviews. Recruitment was conducted using RDS, which is often the most feasible and appropriate sampling technique for hidden populations such as drug users [Reference Heckathorn26]. Initial participants (i.e. ‘seeds’) for the RDS were identified through outreach workers, community informants, and through flyers posted in town and outside the study field office. Upon completion of the baseline interview, seeds were given three coupons to bring in additional network members. Individuals who redeemed the coupons were then given coupons to recruit additional members and so on until the desired sample size was achieved. The seeds were given $10 for each referred network member who redeemed their coupon and completed the baseline interview.
Study recruitment began in November, 2008 and was completed in August, 2010. Eligibility criteria for the study included those who were aged ⩾18 years, were residents of an Appalachian county and had used at least one of the following drugs to get ‘high’ in the previous 30-day period: prescription opioids, heroin, crack/cocaine and/or methamphetamine. An interviewer-administered questionnaire was utilized to determine self-reported behaviours. Data were entered by the interviewers directly onto a touch-screen laptop loaded with computer-assisted personal interviewing (CAPI) software. Participants are compensated $50 for each study visit and the Institutional Review Board at the University of Kentucky approved the protocol.
Drug network data collection
A name-generating questionnaire (first name and last initial) was used to determine with whom individuals had used injected and non-injected drugs in the past 6 months (excluding alcohol and marijuana). For each person named, additional information about the person was gathered, including their gender, race and approximate age. Four sources of information were used to confirm network ties. The name and demographic characteristics were checked against those of other participants in the study. A match in the name and demographic information was considered a confirmed linkage. Linkages that could not be confirmed using names and demographic information were then matched against information provided by individuals screened for eligibility. Participants screened for study participation (n = 939) provided detailed demographic information for the purposes of network linkage confirmation. Finally, advice from community-based research staff was sought to determine and confirm network linkages. Linkages that could not be confirmed using one of these were not included in the sociometric network. These methods are similar to that used in previous research [Reference Latkin27]. UCInet 6.303 [Reference Borgatti, Everett and Freeman28] was used for network analyses.
In addition to examining the overall drug network, participants' injection-risk network was also examined. Once participants' drug network members were established, participants were asked about their injection behaviour with each network neighbour. Participants were asked if in the past 6 months they had injected drugs with the person and/or if they had shared injection equipment (e.g. needles, cookers, rinse water) with the person in the past 6 months. A sociometric network, hereinafter called ‘injection risk network’, was constructed in which a tie constituted any relationship in which at least one person reported injecting together or sharing injection equipment.
Egocentric network variables
Four egocentric network characteristics were examined for their associations with HCV RNA status. Egocentric network size is merely a count of all the network members (alters) linked to a focal individual (ego), not including the ego themselves. For example, egocentric drug-network size was determined by the number of individuals with whom the participant reported using drugs in the past 6 months. For analysis, egocentric drug network size was categorized into ‘high’ (>2) and ‘low’ (⩽2). The density of participants' drug network was calculated as the proportion of possible connections present in a participant's ego network. Participants with a density of zero were classified as having low density and participants with density ⩾1 were classified as having ‘high density’.
Turnover (both in and out) of participants' drug networks was also assessed. Network turnover in and out was defined as a gain and loss, respectively, in network members between baseline and 6-month follow-up assessments. For computation of turnover, drug-network isolates were excluded (n = 49). Further, participants who had not yet completed their 6-month follow-up assessment at the time of their serological testing for HCV RNA were excluded (n = 6). Turnover was analysed as continuous.
Sociometric network variables
Homophily was computed by testing if individuals who were HCV RNA positive were more likely to be tied to each other in a network of drug relationships than that which would be expected at random. Homophily was also computed to test if individuals who were RNA negative were more likely to be tied to each other than would be expected at random. Homophily is computed by comparing the observed network against 20000 permutations of random networks and the output is identical to that of a Pearson correlation table. Homophily testing was performed with the Join-Count command in UCInet 6.30 [Reference Borgatti, Everett and Freeman28].
Four measures were used to examine participants' centrality within their drug networks: degree centrality, eigenvector, betweenness, and two-step reach. Degree centrality, the number of network members adjacent to a given participant in the network [Reference Wasserman and Faust29], was dichotomized into ‘high’ (centrality >2) and ‘low’ (centrality ⩽2). Eigenvector centrality [Reference Bonacich30] takes into account participants' second-order connections and the interconnectedness of those connections. Considering the second-order dimension of individuals' connections is especially important in networks involving risk behaviours that facilitate the diffusion of infectious disease, as an individual whose friends are engaged in risky behaviours with multiple others are more likely to infect an individual and/or be infected than an individual whose friends do not engage in risk behaviours with other people [Reference Borgatti31]. Eigenvector values were dichotomized (0 = eigenvector of 0, 1 = eigenvector >0).
Betweenness served as a measure of how often the participant lies on the shortest ‘path’ between two nodes within the drug network. Due to the skewed distribution of the data, drug-network betweenness was dichotomized according to a median split (‘low’ <17·2, ‘high’ ⩾17·2). Two-step reach was used to represent the number of network members who are within two network linkages from the participant. Due to distribution, drug-network two-step reach was also dichotomized into ‘high’ and ‘low’ groups by a median split (‘low’ <6, ‘high’ ⩾6).
k-cores were used to examine subgroups within the drug network that were more connected than others. This method was originally used to assess HIV risk by Freidman and colleagues [Reference Friedman8]. Consistent with the aforementioned study by Friedman and colleagues, drug k-coreness was dichotomized into ‘high’ (k-coreness ⩾2) and ‘low’ (k-coreness >0 or 1). Of note, participants with k-coreness equal to 0 were isolates in the network.
To assess participants' proximity to other actors in their risk and drug networks who engage in risk behaviour (lifetime injection drug use and injection drug use within the past 6 months), as well as to actors who are anti-HCV positive, the geodesic distance was computed. Geodesic distance is the length of the shortest path between a given pair of members in the network [Reference Wasserman and Faust29]. Individuals who are ‘unreachable’, meaning they lack any connections to a given individual with X characteristic, were excluded from analyses of geodesic distance. Given the risk conferred by being immediately connected to a person engaging in risk behaviour or already exposed to HCV, geodesic distance variables were dichotomized, where 1 = one step removed from (HCV, IDU), 0 = two or more steps removed from (HCV, IDU).
Serological testing for detection of HCV RNA
During their baseline visits, all participants consented to HCV antibody testing. Testing was performed using the Home Access test for HCV antibody, a third-generation enzyme immunoassay conducted on dried blood spot specimens collected by finger-stick. The accuracy of the Home Access test has been demonstrated [Reference O'Brien32]. The baseline prevalence of anti-HCV was 45·9% (n = 200). Participants were provided with post-test counselling tailored to their study result and were also provided with a list of treatment referrals in the area, where appropriate.
The sampling procedure for HCV RNA testing is described in detail elsewhere [Reference Young33]. A randomly selected sample (n = 81) of anti-HCV-positive participants were tested for HCV RNA using COBAS® Ampliprep/COBAS® TaqMan® HCV test kit (Roche Molecular Systems Inc., USA), which uses real-time polymerase chain reaction (PCR), transcription-mediated amplification (TMA), and multi-probe reverse hybridization of the 5′ untranslated region (5′-UTR) of the HCV genome. Testing was performed by Quest Diagnostics Nichols Institute (USA). An IRB-approved post-test counselling protocol was administered to participants.
The randomly selected sample of participants who were tested for HCV RNA were representative of the overall pool of anti-HCV-positive participants in terms of demographic characteristics (gender, age, education, insurance status), health (self-reported health status, lifetime number of hospitalizations), lifetime number of incarcerations, and HCV risk behaviours (having ever injected drugs, having ever shared equipment for snorting drugs, and having ever received a blood transfusion or tattoo).
Assessment of demographic and behavioural correlates
Participants' demographic characteristics (see Table 1) were based on their baseline assessment in the study, while behavioural characteristics were extracted from their most recently completed interview (i.e. at baseline, 6 months, 12 months, or 18 months). The average time which had elapsed between participants' most recent interview date and the date of their blood draw was 51·7 days (s.d. = 41·1, range 18–140).
Table 1. Demographic and behavioural characteristics of sample (N = 81)

OR, Odds ratio; CI, confidence interval; IDU, injecting drug user.
Analysis
Bivariate analyses comparing HCV RNA-positive to RNA-negative participants were performed using a series of χ2 tests for categorical variables and Wilcoxon sign-rank tests for continuous variables (all variables were non-normally distributed). Multivariable correlates to HCV RNA status were initially assessed using three logistic regression models. Two demographic variables (e.g. age, gender) were chosen a priori to be entered into the regression models based on extant literature that suggests they exert strong influences on risk behaviour at the interpersonal and network level [Reference Miller and Neaigus5, Reference De6]. Similarly, one individual-level behavioural variable (injection drug use in the past 6 months) was chosen a priori to be included in the regression analyses due to existing evidence of its strong association with HCV transmission [Reference Xian2, Reference Alter3]. The first model included only those three variables selected a priori for analysis. The second and third models evaluated the association between RNA status and egocentric and sociometric variables, respectively, while controlling for age, gender, and injection drug use. Egocentric and sociometric variables were chosen for inclusion in models 2 and 3 based on their association with RNA status at P < 0·10 in bivariate analyses. A fourth model containing sociometric and egocentric variables as well as age, gender, and recent injection drug use was then estimated using a common backward elimination strategy to produce the most parsimonious final model. At each step of the backward elimination strategy, the variable with the least significant association with RNA status was dropped and the change in the −2 log likelihood between the reduced and final model was evaluated against a χ2 distribution with 1 degree of freedom. If there was no significant change in the −2 log likelihood (i.e. model fit), the variable was eliminated. This strategy was continued until the further elimination of variables would have resulted in a significant change in model fit. Collinearity was assessed at each step of the model-building process using a SAS macro which generates condition indexes and variance decomposition proportions [Reference Zack34].
RESULTS
Demographic characteristics of participants by HCV RNA status are shown in Table 1. The mean age of participants was 35 years (s.d.= 8·3, range 21–53), most were white (95%) and nearly 60% were male. Factors which could potentially inhibit ability to seek care were common as 38% lacked access to transportation, 36% were unemployed, and 63% were uninsured. Half of the sample had graduated from high school and over one-third (36%) were unemployed. RNA-positive and RNA-negative participants did not differ demographically.
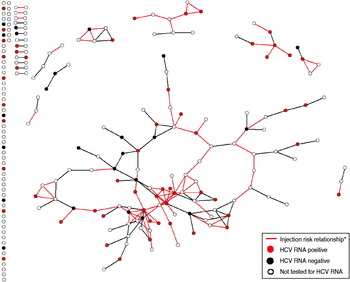
Figure 1 displays the distribution of HCV RNA-positive participants within the overall drug risk network and in the injection risk sub-network. The injection risk network (indicated by red ties in Fig. 1) contained 40% (n = 10) of the RNA-negative participants and 59% (n = 33) of the RNA-positive participants, but the difference was not statistically significant (P = 0·115). The homophily value for the drug network was significant, however, indicating that individuals who are HCV RNA positive are more likely to be tied to each other in the network of drug relationships than would be expected at random (P = 0·049), while RNA-negative participants were no more likely to be tied to other RNA-negative participants or to RNA-positive participants than would be expected at random (P = 0·936 and P = 0·195, respectively).

Fig. 1. HCV RNA status of a randomly selected sample of anti-HCV-positive drug users in a drug risk network (n = 222). * Injection risk relationship = relationships in which network members injected together, shared needles, and/or shared works.
Egocentric and sociometric drug-network characteristics of participants by HCV RNA status are reported in Table 2. Participants who were HCV RNA positive had significantly higher egocentric drug-network density (P = 0·045) and reported somewhat less turnover into their networks from baseline to 6-month follow-up than did RNA-negative participants, although the difference was not statistically significant (P = 0·085). Participants did not differ by HCV RNA status on egocentric network size.
Table 2. Egocentric and sociometric drug-network characteristics of HCV RNA positive/negative drug users (N = 81)

IDU, Injecting drug user.
* P < 0·05.
† For analysis of turnover, drug-network isolates were excluded (n = 49). Participants who had not yet completed their 6-month follow-up assessment at the time of substudy participation were also excluded (n = 6).
Multivariable correlates to HCV RNA status
Table 3 displays multivariable correlates to HCV RNA status. Model 1 contained only the demographic variables and recent injection drug use; none of which were significantly associated with RNA status. Models 2 and 3 extended model 1 to include egocentric and sociometric network variables, respectively, that were significant at P < 0·10 in previous bivariate analyses. In model 2, recent injection drug use and turnover into the drug network were significantly associated with RNA status (P = 0·016 and P = 0·001, respectively). In model 3, neither individual-level nor sociometric-level variables were statistically significant. In estimating a final model, sociometric and egocentric variables could not be entered into the same model due to collinearity. Thus, the final comprehensive model was estimated using a backward elimination approach applied to model 2. Age and gender were not retained in the model, leaving recent injection drug use, egocentric network density, and network turnover. Recent injection drug use was significantly associated with positive RNA status (OR 4·06, 95% CI 1·04–15·83, P = 0·044) and turnover into a participant's drug network was negatively associated with positive RNA status (OR 0·15, 95% CI 0·03–0·75, P = 0·020). Egocentric drug-network density was not significantly associated with RNA status (OR 3·22, 95% CI 0·87–11·95, P = 0·081) after adjustment for the other variables in the model.
Table 3. Multivariable correlates to HCV RNA status in rural Appalachian drug users

OR, Odds ratio; CI, confidence interval; IDU, injecting drug user.
DISCUSSION
HCV RNA-positive participants in this study were demographically and behaviourally similar to participants who were HCV RNA negative. However, in models controlling for age, gender, and recent injection drug use, turnover into a participant's drug network had a significantly negative association with being RNA positive (OR 0·06, 95% CI 0·01–0·51). In the final model recent injection drug use was associated with fourfold greater odds of HCV RNA-positive status (95% CI 1·04–15·83), and turnover into a participant's drug network remained significantly protective (OR 0·15, 95% CI 0·03–0·75).
In this study, many egocentric and sociometric network characteristics identified in previous research to be associated with HCV risk behaviour (e.g. network size, density, centrality, distance to IDUs) were not significantly associated with HCV RNA status [Reference Miller and Neaigus5, Reference De6]. However, the findings regarding recent injection drug use were consistent with the wealth of evidence that has shown it to be a strong risk factor for HCV infection [Reference Xian2, Reference Alter3]. Notably, in the present study, injection drug use was associated with RNA status only in the models which controlled for egocentric characteristics. In the models controlling for demographic characteristics and sociometric characteristics, injection drug use was not associated with RNA status.
The negative association between positive RNA status and inward drug-network turnover (e.g. a gain in network members from baseline to 6-month follow-up) is not consistent with previous behavioural research which suggests that high network turnover is associated with risky injection drug-use behaviour in network members [Reference De6, Reference Hoffmann, Su and Pach19]. One possibility for the association observed in this study could be that a high level of turnover into a participant's network is not necessarily an indication of network instability, given that network turnover in was not correlated with network turnover out (r = 0·058, P = 0·466). HCV RNA-positive participants may be avoiding the expansion of their drug networks in an effort to avoid contact with serodiscordant partners, a phenomenon known as ‘serosorting’ that has been observed in other research [Reference Burt, Thiede and Hagan35]. Conversely, participants who are RNA negative may be avoiding contact with those who are RNA positive, thereby decreasing the latter's opportunity for network expansion. The homophily results from this study, which found that RNA-positive participants tended to ‘flock together’ may also provide some evidence for serosorting. However, more research, is needed to fully understand network turnover dynamics and HCV risk in this population.
These findings highlight the potential of network-based interventions for HCV prevention in IDUs. Specifically, these results indicate the importance of the participants' egocentric network in HCV transmission. Therefore, peer-driven interventions could be effective in reducing HCV risk behaviours in this population [Reference Garfein36–Reference Friedman38]. Although network characteristics played an important role in drug users' risk for active HCV infection, the role of better access to clean needles cannot be ignored. Previous research has shown that after controlling for social network characteristics, needle access/supply remains a significant predictor of risk behaviour [Reference Shaw39]. This population is in critical need of improved access to services that can reduce their long- and short-term risk for bloodborne infection.
While this study provides important insight into the epidemiology of HCV infection in an understudied, high-risk population of drug users and highlights areas for future research, it is not without limitations. For example, the study is limited by a small sample size. However, it is notable that despite the sample size, statistically significant associations between RNA status and egocentric network characteristics were observed. It is also of note that this sample of drug users was randomly selected from a larger cohort of HCV antibody drug users and was demographically and behaviourally representative of the larger sample. An additional limitation is posed by the use of self-report to collect all behavioural data. However, self-reported drug and risk behaviours have been shown to be sufficiently valid and reliable [Reference Darke40]. Issues of temporality also present a limitation to this study, as it could not be determined if social network characteristics were a cause or consequence of drug-risk behaviour and HCV status. To address this limitation, longitudinal social network studies that track drug users' HCV RNA status over time are needed.
Despite limitations, this study presents important evidence that the current paradigm of understanding drug users' risk for bloodborne infection only within the context of their individual-level risk factors may be inadequate for understanding HCV transmission in this sample of rural drug users. Rather, these data suggest that drug use and its associated risks are best understood within the social contexts in which they occur.
ACKNOWLEDGEMENTS
The authors acknowledge Dr Hannah Cooper for her thoughtful input and assistance in editing the manuscript draft. We also thank Dr Richard Crosby for his advice on the study design and suggestions on the manuscript draft. This study was funded by the National Institute of Drug Abuse (R01-DA02498) with additional support from the Centers for Disease Control and Prevention (U48DP001932).
DECLARATION OF INTEREST
None.