


INTRODUCTION
Melioidosis is a potentially fatally infectious disease caused by the soil-borne pathogen Burkholderia pseudomallei. This disease is widely distributed in northern Australia and South East Asia, but its occurrence is most likely underestimated in other tropical and subtropical regions, such as India, South America and Africa [Reference Cheng and Currie1–Reference Aung and Mar4]. Direct contact with and the inhalation of aerosolized particles contaminated with B. pseudomallei are the primary modes of transmission for melioidosis [Reference Dance5]. Farmers conducting agricultural activities are at risk because they have an increased risk of exposure to B. pseudomallei in their occupational setting [Reference Cheng and Currie1]. In Thailand and northern Australia, an increase in melioidosis incidence is commonly observed during seasonal rainy periods or after extreme weather or flooding conditions, e.g. heavy rainfall, cyclones or tsunamis [Reference Suputtamongkol6–Reference Cheng10]. It has been suggested that B. pseudomallei grows optimally in moist soil (water content >15%) and moves to remote areas via streams or wind after aerosolization [Reference Wiersinga11]. However, this correlation was not strong in many areas, including Singapore and Malaysia [Reference Heng12–Reference Hassan14]. In recent years, the annual incidence of melioidosis has increased in Thailand, with no association with an increase in seasonal rainfall [Reference Limmathurotsakul15].
Cases of melioidosis in Taiwan were reported sporadically before 2004. Then, after a typhoon in 2005, more than 70 cases of melioidosis were reported [Reference Su16, Reference Ko17]. About 30% of residents in the typhoon-affected areas were found to be seropositive for B. pseudomallei, in contrast to 5% of the general population. The pulsotypes of human and environmental isolates were indistinguishable [Reference Ko17, Reference Chen18]. After 2005, awareness of melioidosis increased, aiding physicians to diagnose this disease in Taiwan. The confirmed cases of melioidosis substantially increased and appeared in clusters in the Er-Ren River Basin and the Zoynan Region of southern Taiwan. These areas are 10·3 km apart, but the climatic conditions, including rainfall and wind strength, are different because the topographical characteristics differ; the Er-Ren River Basin is a plain, and the Zoynan Region is a hilly area. Therefore, these areas can serve as model systems in which to examine the correlation between extreme climates and the development of melioidosis.
MATERIALS AND METHODS
Melioidosis cases
The surveillance system for melioidosis in Taiwan was established in 2000. Once melioidosis was confirmed by bacteriological culture at individual hospitals, the details of the case, including demographic characteristics, residence and occupation, as well as the date of disease onset and the date of diagnosis made for each patient, were reported to the Taiwan Centers for Disease Control (CDC). The date of disease onset was determined by a doctor based on the occurrence of the patient's symptoms (fever or localized inflammation). The date of diagnosis made is defined as the date on which B. pseudomallei was identified in bacterial cultures in the laboratory. In this study, the age, gender, address, survival after in-hospital treatment, occupation and dates of disease onset and diagnosis made for each patient with melioidosis were retrieved from the CDC database. From 2000 to 2004, only four cases were reported from regional hospitals in the studied areas. Therefore, only melioidosis data occurring between 2005 and 2011 were analysed. The locations of melioidosis cases were mapped using GIS MapInfo v. 7.0 software (Pitney Bowes Software Inc., USA).
Study areas
Two study areas, the Er-Ren River Basin (∼108 km2) and the Zoynan Region (∼ 60 km2), were selected based on previous results by Moran's I analysis, which is a measurement of spatial autocorrelation. The results indicated that the residents in these areas had a high incidence of melioidosis compared to neighbourhoods at town-level analysis [Reference Dai19]. Topographical characteristics, including rivers, lakes and hills, were mapped (MapInfo, v. 7.0) using GPS coordinates of Google Earth. The Er-Ren River Basin is a plain (altitude < 10 m), whereas the Zoynan Region is a hill, surrounded by hilly barriers to the north (elevation, 52 m), southwest (elevation 356 m) and southeast (elevation 220 m) (Fig. 1). The agricultural information was obtained from the Council of Agriculture (Taiwan) and revealed that rice, cane, peanuts, bananas, pineapples and maize were produced in both areas.
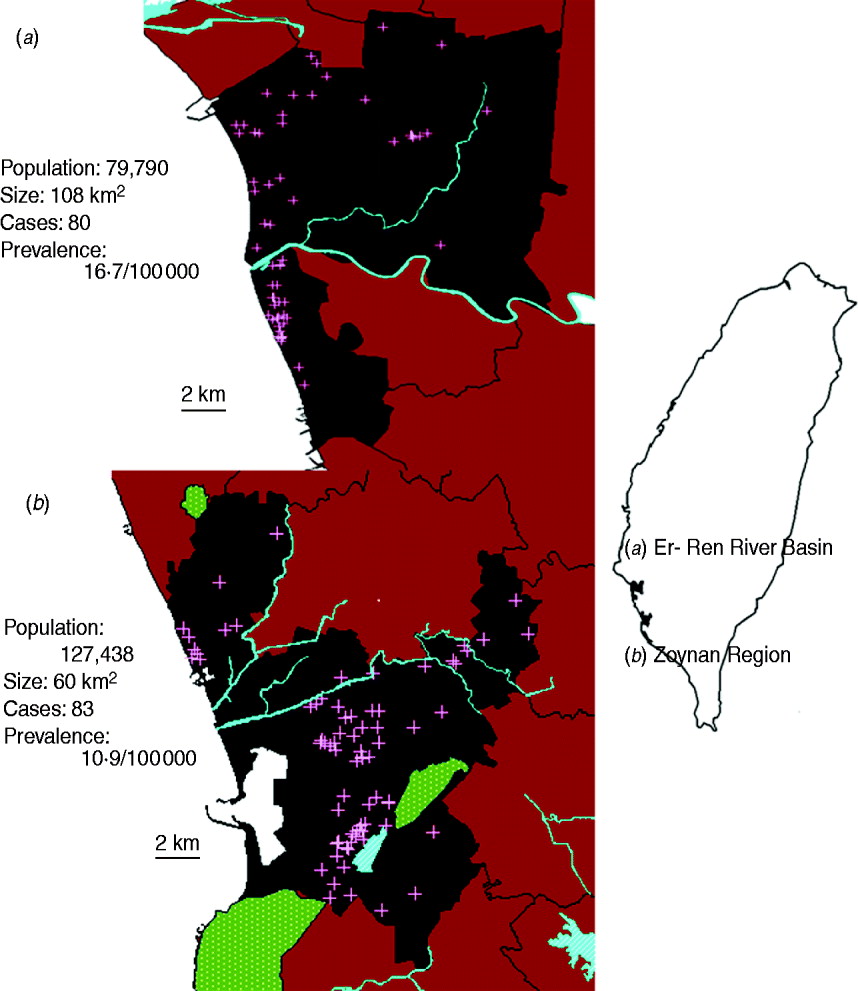
Fig. 1. Location of melioidosis cases and regional topography. The locations of melioidosis cases (+) at the neighbourhood level were mapped for (a) the Er-Ren River Basin and (b) the Zoynan Region. These areas (brown) were defined as high-incidence areas (see Methods section). The locations of rivers (blue) and hills (green) were determined using GPS locations from Google Earth and were mapped.
Climatic database
Daily rainfall, wind speed and typhoon climate data were collected from recording stations in the Er-Ren River Basin or the Zoynan Region by the Central Weather Bureau (Taiwan). A total of 2551 daily records for the Er-Ren River Basin (records for 5 days were not obtained due to station maintenance) and 2556 daily records for the Zoynan Region were collected from 2005 to 2011. The maximum instant wind speed (m/s) was used as the parameter ‘wind’ because instant wind speed (strength) exhibited better correlations than the average wind speed with the incidence of disease and air pollutants [Reference Bourcier20]. A typhoon was defined as a tropical depression in which the wind speed exceeded 17·2 m/s (number 7 on the Beaufort scale) [Reference Sun and Chen21].
The wind direction was presented as an angle from 0° to 360°. The daily maximum instant wind speed was recorded at 10° intervals. A total of 2551 (Er-Ren River Basin) and 2556 (Zoynan Region) records were used to calculate the relative percentages of each wind angle. The number of times that each wind angle was observed for strong wind (>19 m/s) over an incubation period of 3–9 days was totalled for each patient. For the Zoynan Region, the wind speed was not correlated with the occurrence of melioidosis; therefore, all wind angles were recorded and totalled over an incubation period of 3–5 days for each patient. The percentages of specific wind angles occurring in conjunction with the development of melioidosis (melioidosis-related wind angle) were determined for both areas. Finally, the ratio was determined by dividing the percentages of melioidosis-related wind angles by the percentage of each angle for all records. The means and standard deviations (3 s.d.) for the ratios were calculated by averaging all of the measurements.
Statistical analysis
Statistical analyses were performed using SAS v. 7.0 (SAS Institute Inc., USA). The correlation between rainfall and wind speed was determined using linear regression. The correlations between both daily rainfall or wind speed and the number of melioidosis cases based on the date of disease onset were assessed using the Poisson (zero-inflated) and negative binomial models (zero-inflated) according to a previous study. The negative binomial model had a better fit with the observed data. In this study, the negative binomial model was used with different lag times to determine the P value [Reference Usman, Fu and Miranda-Moreno22]. The multivariate models were performed by adding the variables of rainfall, wind speed and wind direction to the zero-inflated negative binomial regression models. For these statistics, the wind direction (0–360°) was divided into eight bins [0–40°, 50–80°, 90–130°, 140–180°, 190–230°, 240–270°, 280–320°, and 330–360° (as reference)]. The P values for these three variables were examined after performing Bonferroni correction. The correlation between the presence or absence of melioidosis during each month and the presence or absence of specific wind speeds was determined using Fisher's exact test.
RESULTS
Analysis of melioidosis cases
A total of 322 cases of melioidosis occurring between 2000 and 2011 were retrieved from the database. About 94% (302/322) of cases had occurred since 2005. Of those cases since 2005, 54% were clustered in the Er-Ren River Basin (n = 80) or the Zoynan Region (n = 83) (Fig. 1). The demographic analysis of all cases indicated that the ratio of males to females was 3·2:1, the age range was 35–85 years, and the mortality rate was 20%. About 50% of the patients with melioidosis were unemployed. Of those who were employed, there were relatively few patients with occupations associated with agriculture (4%) or outdoor activities (6%). The demographic information was analysed separately for patients dwelling in the Er-Ren River Basin and those patients living in the Zoynan Region. No significant differences in the above parameters were found between the two areas (Table 1).
Table 1. Demographic characteristics of melioidosis cases
To exclude the biases that different levels of diagnosis for melioidosis exist in regional hospitals of both areas, the diagnostic period (time between the date of disease onset and diagnosis made) of each case was examined. The results revealed the diagnostic period ranged from 4 to 10 days for patients with melioidosis. It probably takes 1–7 days for culture and 1–3 days to identify B. pseuodmallei in the laboratory [Reference Tiangpitayakorn23, Reference Sirisinha24]. No difference was found for diagnostic period of patients dwelling in the Er-Ren River Basin or Zoynan Region (unpaired t test, P > 0·1).
Different levels of rainfall and wind in the study areas
On average, the mean monthly rainfall and wind speed in the Er-Ren River Basin were 144 mm [95% confidence interval (CI) 99·2–188·2) and 10·3 m/s (95% CI 9·8–10·7), respectively. In the Zoynan Region, the mean monthly rainfall was 163·1 mm (95% CI 113·5–212·7), while the mean monthly wind speed was 8·1 m/s (95% CI 7·3–8·7). The levels of rainfall and wind speed exhibited some degree of correlation in both areas (Er-Ren Basin: r 2 = 0·2144, P < 0·0001; Zoynan Region: r 2 = 0·366, P < 0·0001). But, the rainfall or wind speed in the Zoynan Region or Er-Ren Basin, respectively, were higher than in counterpart areas (paired t test, P < 0·05). The prevalence of melioidosis was 16·7 cases/100 000 population for the Er-Ren River Basin and 10·9 cases/100 000 population for the Zoynan Region (Fig. 1).
Rainfall and melioidosis incidence
The peak for the number of melioidosis cases in the Er-Ren River Basin occurred in 2005 but not until 2011 for the Zoynan Region (Fig. 2 a). The amount of seasonal rainfall was >1000 mm in the wet season for both areas. The number of melioidosis cases during the wet season (one case, 15–16 days) was fivefold higher than that during the dry season (one case, 77 days) in both areas. The greatest amount of rainfall (>2500 mm) occurred in 2005 in the Er-Ren River Basin. From 2009 to 2011, the rainy period in the Zoynan Region lasted longer than that in the Er-Ren River Basin. Both events were accompanied by an increase in the number of melioidosis cases (Fig. 2 a).
Fig. 2. Association between rainfall and melioidosis. (a) The rainfall column in the wet or dry seasons, the number of melioidosis cases (○) in the Er-Ren River Basin and the Zoynan Region are shown. The days (d) of rainfall in the wet season is presented as a dotted line (· · · · · ·). (b) The correlations between daily rainfall data for the Er-Ren River Basin (––––) and the Zoynan Region (· · · · · ·) were correlated with melioidosis cases with different lag times.
We hypothesized that the symptoms (fever or localized inflammation) could appear within days after the initial rainfall for each episode; the lag time was set daily to test the correlation between the daily rainfall and the number of melioidosis cases. The results revealed that daily rainfall and incidence of melioidosis cases were correlated (P < 0·05) with lag times ranging from 3 to 9 days for the Er-Ren River Basin and from 3 to 4 days for the Zoynan Region (Fig. 2 b).
Wind speed and melioidosis incidence
In Taiwan, seasonal rainfall originates primarily from typhoons combined with strong winds. From July to September, three invasive typhoons can appear as intermittent storms for up to 1 month. Therefore, the presence or absence of melioidosis and the specific maximum wind speeds in the monthly data were compared. When the monthly maximum wind speed was >19 m/s (a wind speed >17·2 m/s is a typhoon), the number of melioidosis cases increased in the Er-Ren River Basin; however, no correlation between the monthly wind-speed data and the number of melioidosis cases was found for the Zoynan Region (Fig. 3 a). The typhoon event significantly contributed to the occurrence of melioidosis cases for the Er-Ren River Basin.
Fig. 3. Correlation between wind speed and melioidosis. (a) The monthly number of melioidosis cases and specific wind speeds for the Er-Ren River Basin (○) and the Zoynan Region (□) are shown. (b) The daily wind data for the Er-Ren River Basin (–––) and for the Zoynan Region (· · · · · ·) were correlated with the melioidosis cases with different lag times.
However, wind speed was a parameter contributing to the incidence of melioidosis cases, and daily wind speed and incidence of melioidosis cases were correlated with lag times ranging from 5 to 8 days for the Er-Ren River Basin and from 4 to 5 days for the Zoynan Region. This correlation exhibited similar patterns to those for the parameter ‘rain’ in the Er-Ren River Basin and the Zoynan Region (Fig. 3 b).
Wind direction and melioidosis incidence
From 2005 to 2011, the most common wind direction was north-northwest to north-northeast, with angles from 300° to 30°, for the Er-Ren River Basin (Fig. 4 a) and west-northwest to north-northwest, with angles from 270° to 340°, for the Zoynan Region (Fig. 4 b). Both areas in western Taiwan are surrounded by the Central Mountain Range and, therefore, do not experience easterly wind. Here, the wind direction reflects topographical differences because there is less northerly and southwesterly wind in the Zoynan Region, which has hills that form barriers to the north and southwest. For the Er-Ren River Basin, the occurrence of melioidosis was related to the wind direction (7·4 for 150°, 6·3 for 220°, 5·4 for 280°) (Fig. 4 c). Since three hills act as barriers surrounding the Zoynan Region it was not surprising that the distribution of melioidosis for each wind angle was relatively even (0–2·1) (Fig. 4 c).

Fig. 4. Distribution of the wind direction and the ratio of melioidosis-related wind angles. The distributions of wind directions for (a) the Er-Ren River Basin and (b) the Zoynan Region are shown. The incidence of wind direction from 2005 to 2011 is represented in greyscale (■, >100 times; ![]() , 51–100 times;
, 51–100 times; ![]() , 11–50 times; □, 0–10 times). (c) The ratio of the melioidosis-related wind angle percentages divided by the wind angle percentages for all records for the Er-Ren River Basin (
, 11–50 times; □, 0–10 times). (c) The ratio of the melioidosis-related wind angle percentages divided by the wind angle percentages for all records for the Er-Ren River Basin (![]() ) and the Zoynan Region (■). Arrows indicate that the ratio for the specific angle was greater than the mean±3 standard deviations (s.d.).
) and the Zoynan Region (■). Arrows indicate that the ratio for the specific angle was greater than the mean±3 standard deviations (s.d.).
Multivariable analysis
Using a multivariable analysis for rainfall, wind speed and wind direction, the parameter ‘wind direction’ was the dominant factor correlated with the occurrence of melioidosis in the Er-Ren River Basin (Table 2). Given that 50% (40/80) of melioidosis cases occurred during a typhoon event (2005) in this region, the statistical results, after removing the data from this event, still revealed a correlation between specific wind direction and the number of melioidosis cases with a lag time of 8–9 days. By contrast, the parameter ‘rain’ was the dominant factor in the Zoynan Region. The P value based on data from 2009 to 2011 was smaller than for data from 2005 to 2011 (Table 2). The number of melioidosis cases has substantially increased during the wet season since 2009. Taken together, rainfall is a common environmental factor that contributes to an increase in the incidence of melioidosis in flat and hilly areas; however, the contribution of wind strength or wind direction to the spread of melioidosis was restricted to areas with specific topographical characteristics, such as hills.
Table 2. Multivariable analysis for rainfall, wind speed and wind direction
WD, Wind direction (degrees); WS, wind speed.
† Significant after Bonferroni correction (P = 0·1).
* P ⩾ 0·1 not shown.
DISCUSSION
A 5-year investigation in Thailand and a 12-year investigation in Australia revealed that the number of melioidosis cases increased after seasonal rainfall [Reference Suputtamongkol6, Reference Currie and Jacups8]. However, the good association between rainfall and melioidosis was not observed in Singapore, Kuala Lumpur or the Alor Setar region of Malaysia [Reference Sam and Puthucheary13, Reference Hassan14, Reference Lo25]. In the current study, using a dataset spanning 6 years, we report that the different degrees of correlation between climate factors (rainfall, wind speed, wind direction) and incidence of melioidosis occurred in a plain and a hilly area in Taiwan. Topographical barriers provided the explanation as to why an outbreak of melioidosis never occurred simultaneously in the two areas although these areas are 10·3 km apart. However, typhoon is an important event that causes the heaviest rainfall and the strongest wind speed every wet season in Taiwan. Indeed, outbreaks of melioidosis occurred in the Er-Ren River Basin in 2005 and Zoynan Region in 2009 after a typhoon [Reference Shih26, Reference Su, Chan and Chang27]. Interpreting this correlation still requires caution because exposure to sufficient amounts of contamination is needed to consider the transmission of melioidosis to be facilitated by climate factors [Reference Dai19]. For example, cases of melioidosis were not clustered in the Zoynan Region through which the typhoon passed from 2005 to 2008. This could be because there was no exposure to contaminated sources.
B. pseudomallei is usually isolated from soil or water [Reference Dance5]. In northern Australia, B. pseudomallei-positive sites in the environment were waterlogged or irrigated. Melioidosis occurred in individuals living in or near waterways or wet areas [Reference Kaestli28, Reference Corkeron, Norton and Nelson29]. Of Laotian patients, about 86% of those diagnosed with melioidosis lived in neighbourhoods near rivers [Reference Rattanavong30]. Because heavy rainfall results in flooding or the overflowing of irrigated ponds, rivers or other water sources, it is reasonable to assume that rainfall will be highly associated with the incidence of melioidosis. Interestingly, most patients with melioidosis in this study did not experience exposure to B. pseudomallei in their occupational setting or residence. In a previous study, a questionnaire given to patients living in the Er-Ren River Basin revealed that over 50% of patients had not experienced flooding and that none of the patients (0/13) had participated in outdoor activities during a period of rainfall [Reference Su31]. Although direct contact with contaminated sources is commonly observed in the transmission of melioidosis in endemic areas [Reference Cheng and Currie1] (e.g. in this study it cannot be ruled out that patients acquired melioidosis by walking barefoot or working in the garden at home), the inhalation of aerosols contaminated with B. pseudomallei should be considered as a possible mode of transmission for melioidosis in Taiwan.
It is believed that wind carries aerosols from contaminated areas to remote regions. In Western Australia, where a tropical cyclone develops every year, an environmental B. pseudomallei strain resembling a strain responsible for an outbreak of human melioidosis was reported 500 km away from the location of the outbreak [Reference Inglis32]. When cyclones reach Western Australia from a landward direction, the number of melioidosis cases increases [Reference Inglis9, Reference Cheng10]. In Taiwan, an environmental B. pseudomallei strain harbouring identical genetic patterns of an outbreak strain has been found upstream of the Er-Ren River (southeast), although the residential addresses of the patients with melioidosis were clustered downstream (northwest), at a distance of 13 km from the contaminated upstream sites [Reference Chen18, Reference Su31]. In this study, we found that a wind direction with a 150° angle was related to the development of melioidosis. It is likely that patients inhaled aerosols contaminated with B. pseudomallei from the southeast, upstream of the Er-Ren River. Therefore, wind directions with specific angles (150°, 220°, 280°) provide a clue with which to trace areas that are contaminated with B. pseudomallei.
The pathogenicity of melioidosis generally depends on the size of the B. pseudomallei inoculum and the level of host immunosuppression [Reference Tamrakar and Haas33, Reference Currie, Ward and Cheng34]. The incubation period of melioidosis varies, usually ranging from one to several days, or even several years, but over a month is rare [Reference Simpson35]. Cases of acute melioidosis usually occur after heavy rainfall or a typhoon [Reference Currie and Jacups8, Reference Su, Chan and Chang27]. It has been reported that patients who were admitted with melioidosis 7–14 days after heavy monsoonal rainfall (188 mm) were more ill or more likely to die (rainfall >211 mm) [Reference Currie and Jacups8]. In this study, >1000 mm of rainfall during the wet season and a wind speed of >19 m/s (Er-Ren River Basin) were indicators of melioidosis occurring in Taiwan. However, a unique flooding incident, a tsunami or unexpected rains have resulted in additional cases of melioidosis [Reference Chierakul36, Reference Rolim37]. Physicians should be aware that an outbreak of melioidosis might occur when a typhoon combined with unusual heavy rainfall is heading for Taiwan.
ACKNOWLEDGEMENTS
This project was supported by the Taiwan Centers for Disease Control (DOH96-DC-1002 and DOH101-DC-1302).
DECLARATION OF INTEREST
None.


