


INTRODUCTION
Influenza infection has been associated with many respiratory [Reference Fleming1] and circulatory conditions [Reference Fleming, Cross and Pannell2]. Influenza infections are often not laboratory confirmed and many resulting deaths are not recorded as such. Consequently, influenza-coded deaths represent only a fraction of the true number of influenza-attributable deaths and the disease burden has to be estimated through statistical inference applied to broad disease outcomes. An accurate estimate of the disease burden is important for assessing the effectiveness and cost-effectiveness of interventions aimed at preventing influenza infection.
In the recent literature, most approaches for estimating the influenza-attributable disease burden can be separated into one of two types. The first is a set of approaches related to the method introduced by Serfling in 1963 in the USA [Reference Serfling3]. This approach focuses on the influenza period, a subset of the cooler months in which influenza circulates more widely in temperate settings. In this approach, excess deaths are calculated by summing the deviations from a sinusoidal baseline curve which aims to capture the seasonal variation in deaths not associated with influenza. Several refinements to this model are in use, with various approaches to calculating the baseline curve [Reference Simonsen4, Reference Simonsen5].
An alternative approach has been to use Poisson regression models, where a variable specific to influenza virus activity, such as counts or prevalence of laboratory-confirmed cases is used as a covariate in the model [Reference Thompson6, Reference Wong7]. These models also usually include sinusoidal (or other seasonally forced) covariates and sometimes include respiratory syncytial virus (RSV) activity to explicitly account for increased winter mortality not caused by influenza virus. There is debate as to which of the two methods provides a superior approach [Reference Gay8–Reference Simonsen10]. While it has been shown that both can provide similar average estimates of influenza-attributable mortality in temperate settings [Reference Simonsen11], this has not been systematically explored in Australia.
In this study, excess age-specific influenza-attributable mortality in Australia is estimated using both Poisson and Serfling regression models. By systematically comparing the different approaches we aimed to gain a greater understanding of the strengths and weakness of the two methods.
METHODS
Data sources
We utilized monthly age-specific death data from the Australian National Mortality Database (NMD) for the period January 1997 to November 2004 (95 months). The NMD contains cause of death information for all registered deaths in Australia. As the majority of the influenza-attributable burden is in the older population, we focused on those aged >50 years. Monthly viral surveillance counts for influenza (A and B) and RSV were from the Australian Laboratory Virology and Serology Reporting Scheme (LabVISE). LabVISE is a national sentinel laboratory surveillance scheme that reports year round [Reference Firestone12, Reference Roche13]. Population estimates were based on Australian Bureau of Statistics data [14].
Stratified analyses
Influenza-attributable mortality was estimated separately in the following disease categories:
• underlying respiratory cause of death (ICD J),
• underlying circulatory cause of death (ICD I),
• all-cause mortality.
Below we describe our statistical approach for Poisson models and Serfling models, which are different methods for estimating influenza-attributable mortality. We first present how seasonal mortality baselines were fitted for each model and then describe the algorithm for estimating influenza-attributable mortality using these baselines. Note that before model fitting, each monthly mortality time-series was adjusted for length of month.
Mortality baseline derived from a Poisson regression model
For each specific age group and disease category, the monthly mortality counts Y(t i) were regressed using the following Poisson model (similar to Newall et al. [Reference Newall, Wood and Macintyre15]) with an identity-link function:
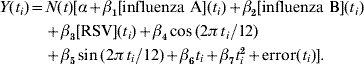
Here [influenza A](t i), [influenza B](t i) and [RSV](t i) represent laboratory specimen counts for the corresponding month t i, sin(2![]() t i/12) and cos(2
t i/12) and cos(2![]() t i/12) are harmonics that adjust for seasonal fluctuations in deaths (independent of influenza and RSV), and the linear and squared terms in t i account for temporal trends in the data (t i=1, 2, …, 95). The term N(t) refers to the age-specific monthly population estimate (derived from a linear model fitted to mid-year population totals). The number of deaths predicted by the model when we assume zero influenza laboratory counts was the estimated Poisson baseline.
t i/12) are harmonics that adjust for seasonal fluctuations in deaths (independent of influenza and RSV), and the linear and squared terms in t i account for temporal trends in the data (t i=1, 2, …, 95). The term N(t) refers to the age-specific monthly population estimate (derived from a linear model fitted to mid-year population totals). The number of deaths predicted by the model when we assume zero influenza laboratory counts was the estimated Poisson baseline.
Mortality baseline derived from a Serfling regression model
For the Serfling analysis, we followed a similar procedure to that described by Simonsen et al. [Reference Simonsen5]. A regression was performed on each age group and cause-specific monthly time-series of death rates y(t i) but excluding a predefined cooler period (June–October), in order to produce a seasonal non-influenza baseline. This Serfling baseline regression model was specified as follows:
Note that in this case, only values of t i that fall outside the cooler period are included in the regression (see the Poisson regression section for definitions of the covariates). To identify months in which influenza was widespread, we applied a similar regression model to influenza A and B combined viral surveillance counts (excluding a predefined cooler period, June–October). Months with counts above the 95% confidence interval of this regression model were classified as ‘epidemic months’. Only mortality occurring in the subset of ‘epidemic months’ and which fell in a broad predefined influenza period (May–November) were counted towards influenza-attributable mortality.
Annual influenza-attributable death estimates
The influenza-attributable deaths for each month were determined by subtracting estimated seasonal baseline deaths from either the observed deaths (Serfling) or from the model-predicted deaths (Poisson). We conducted additional sensitivity analyses for both the Serfling and the Poisson models. In Serfling B and Poisson B we counted excess mortality during a fixed broad predefined influenza period (May–November). A further variation on the Serfling model (Serfling C) only included positive values for monthly excess deaths in the calculation of influenza-attributable deaths.
The annual rate of influenza-attributable mortality was calculated by dividing the cumulative number of deaths attributed to influenza for the year (correcting for true month length) by the mid-year population estimate. Annual estimates were then averaged over the study period to produce the estimated average annual rate. SAS statistical software (version 9.1, SAS Institute Inc., USA) was used for all statistical analyses.
RESULTS
Of those aged >50 years the average annual number of estimated influenza-attributable deaths (all cause) ranged from 2314 to 3457 for the Serfling and Poisson models, respectively. The rates of influenza-attributable deaths increased with age, with the highest rates (461–664 per 100 000, depending on the model) found in those aged ⩾85 years (Table 1). In older age groups (75–84 and ⩾85 years) circulatory disorders were associated with more influenza-attributable deaths than respiratory disorders. In younger age groups (50–64 and 65–74 years), respiratory disorders typically produced more influenza-attributable deaths. Time-series graphs illustrating the estimation of excess deaths for both models are shown in Figure 1 (respiratory), Figure 2 (circulatory) and Figure 3 (all-cause).

Fig. 1. Monthly estimated respiratory influenza-attributable mortality by age group for Serfling (primary axis) and Poisson (secondary axis) regression models. Primary axis (Serfling model, shown above in each figure): the solid line indicates the observed respiratory mortality rate (adjusted) and the shaded area approximates the Serfling influenza-attributable burden. The dashed line is the estimated non-influenza baseline. Secondary axis (Poisson model, shown below in each figure): the solid line indicates the Poisson model predicted respiratory mortality rate and the shaded area approximates the Poisson influenza-attributable burden. The dashed line is the estimated non-influenza baseline. Note the large apparent difference in magnitude between model rates is due to the use of different vertical axes.

Fig. 2. Monthly estimated circulatory influenza-attributable mortality by age group for Serfling (primary axis) and Poisson (secondary axis) regression models. Primary axis (Serfling model, shown above in each figure): the solid line indicates the observed circulatory mortality rate (adjusted) and the shaded area approximates the Serfling influenza-attributable burden. The dashed line is the estimated non-influenza baseline. Secondary axis (Poisson model, shown below in each figure): the solid line indicates the Poisson model predicted circulatory mortality rate and the shaded area approximates the Poisson influenza-attributable burden. The dashed line is the estimated non-influenza baseline. Note the large apparent difference in magnitude between model rates is due to the use of different vertical axes.

Fig. 3. Monthly estimated all-cause influenza-attributable mortality by age group for Serfling (primary axis) and Poisson (secondary axis) regression models. Primary axis (Serfling model, shown above in each figure): the solid line indicates the observed all-cause mortality rate (adjusted) and the shaded area approximates the Serfling influenza-attributable burden. The dashed line is the estimated non-influenza baseline. Secondary axis (Poisson model, shown below in each figure): the solid line indicates the Poisson model predicted all-cause mortality rate and the shaded area approximates the Poisson influenza-attributable burden. The dashed line is the estimated non-influenza baseline. Note the large apparent difference in magnitude between model rates is due to the use of different vertical axes.
Table 1. Estimated average annual excess influenza-attributable mortality by age group

In almost all age groups the Poisson model estimated a higher rate of influenza-attributable deaths than the Serfling models (Table 1). The number of deaths specifically coded as influenza (ICD J10, J11) represented <5% of deaths (all cause) predicted by the Poisson or Serfling models. In all age groups, there was significant year-to-year variation in influenza-attributable mortality (Figs 1–3). While the non-influenza baseline was similar for both the Poisson and Serfling models, in mild influenza seasons Serfling models typically predicted lower levels of influenza-attributable mortality (Fig. 4). This is primarily due to the smaller set of months which meet the criteria for inclusion in calculating influenza-attributable deaths in the Serfling analysis, with only two epidemic months included for the years 2001 and 2004.

Fig. 4. Estimated all-cause influenza-attributable mortality by year in those aged ⩾85 years.
When a fixed predefined influenza period (May–November) was used to count excess mortality the Poisson B and Serfling B models produced very similar results (Table 1). The two approaches to summing deaths used in the Serfling analysis (Serfling and Serfling C) led to only minor differences (Table 1), suggesting that the baseline is a relatively good fit to observed data. However, in less-specific ICD categories applied to younger age groups the patterns of deaths are influenced more by random fluctuations, so that the exclusion of negative values in Serfling C created a larger effect. Although the model fit from the Poisson regressions was generally good, in the 50–64 years age group no significant association between influenza A or B and circulatory deaths was detected.
DISCUSSION
This study expands on our previous analysis of the influenza-attributable mortality burden in Australians [Reference Newall, Wood and Macintyre15] and is the first study to systematically compare Poisson and Serfling regression models in this country. We found that the age and temporal patterns of influenza-attributable mortality in Australians aged >50 years were similar in the Poisson and Serfling models. Both modelling approaches also produced very similar baselines for expected mortality in the absence of influenza activity, for respiratory, circulatory, and all-cause deaths, despite different underlying assumptions. As in other countries [Reference Thompson6, Reference Pitman16], influenza-attributable mortality burden was particularly high in the elderly, and the impact of influenza on circulatory diseases was more pronounced in this population.
It is reassuring that both approaches gave consistent overall patterns of influenza-attributable mortality; however, there were differences in the magnitude of mortality attributed to influenza, with our Poisson model generally producing larger estimates. The principal reason for this was that the Poisson approach we applied attributed deaths to influenza throughout the year, whereas the Serfling approach utilized was more conservative in attributing deaths only during a subset of months in which viral surveillance counts were sufficiently high. The difference in influenza-attributable deaths was most pronounced in mild influenza seasons, where Serfling models attributed deaths during a short period identified as epidemic through viral activity data. Using two related models, a recent US analysis found similar average estimates between the models for all ages, but only moderate correlation in annual estimates [Reference Thompson17]. When we used a fixed predefined period to count excess mortality for both model types, the models (Serfling B and Poisson B) produced very similar results.
A major assumption in Serfling models is that the excess deaths (above the sinusoidal baseline curve) in epidemic months are attributable to influenza. The Serfling approach assumes that that mortality is seasonal in the absence of influenza virus circulation and that the impact of RSV can be accounted for by a seasonal baseline. The robustness of the baseline estimates by both models in this study, together with the results of previous US-based mortality studies [Reference Simonsen11, Reference Dushoff18], suggest that this assumption may be appropriate. We used viral surveillance data to define the influenza activity in our Serfling models; however, this is more commonly done using influenza-coded deaths. This allows the Serfling method to be applied when viral surveillance data is unavailable, such as when assessing long-term historical trends [Reference Simonsen10].
Poisson regression models require some correlate of influenza activity to be used as explanatory variables. A key assumption implicit in this approach is that deaths attributable to influenza increase in proportion to the correlate of influenza activity, irrespective of the time of year. Viral surveillance data are perhaps the most specific choice available and this allows influenza A and B surveillance counts to be used as separate covariates, together with other influential variables. However, there are some limitations to the viral surveillance data utilized (LabVISE), including a lack of denominator information (total tests performed) and uncertainty around the representativeness of the data (see [Reference Roche13] for further details).
Influenza-attributable mortality estimates play a major role in policy through their influence in cost-effectiveness models of influenza prevention. The way these estimates should be utilized in cost-effectiveness models depends on what they represent. The literature on influenza disease burden estimation offers an array of terms to describe the estimates of influenza disease. The estimates of disease have been termed ‘associated’ [Reference Thompson19], ‘due’ [Reference Gay8], ‘attributable’ [Reference Thompson6, Reference Pitman16], and ‘related’ [Reference Simonsen5] to influenza. This semantic variation in definition adds to confusion as to how these estimates should be interpreted [Reference Doshi20].
Both the Poisson and Serfling approaches that we applied estimate the baseline level of death not associated with influenza. This baseline is an estimate of the deaths that would have occurred if no influenza was circulating. It seems reasonable to interpret the excess deaths as an estimate of those resulting from influenza infection, which hypothetically, could be prevented by full population coverage with a 100% efficacious vaccine. This definition is useful in clarifying what is being estimated. However, it does not materially affect the accuracy of the estimate, which depends entirely on the appropriateness of the model and validity of the data used in the analysis. Issues around mortality displacement in the frail elderly should also be considered, particularly when evaluating years of life lost [Reference Rocklov, Forsberg and Meister21].
In this study we have focused on estimating the burden in the >50 years age group. In younger age groups, the seasonal pattern of deaths is often less distinct with greater random fluctuation. This may be particularly problematic when population size is relatively small, as is the case in Australia. In these populations (and when analysing shorter time periods), technical choices such as whether to exclude negative values in the Serfling approach are likely to be more influential.
CONCLUSIONS
Poisson and Serfling regression models produced consistent age and temporal patterns in estimates of influenza-attributable mortality in older Australians. While there was some variation in the magnitude of influenza-attributable mortality, the excess disease burden was substantial under all methods.
ACKNOWLEDGEMENTS
Mortality data were provided by the Australian Institute of Health and Welfare. Surveillance data were provided by the Australian Government Department of Health and Ageing.
DECLARATION OF INTEREST
A. T. N. and J. G. W. have conducted prior projects on influenza disease burden which were funded by the Influenza Specialist Group (ISG). A. T. N. and J. G. W. have received research grants for other projects from GlaxoSmithKline Australia. C. V. has no conflicts of interest to declare.


