Introduction
The coronavirus disease 2019 (COVID-19) pandemic caused by severe acute respiratory syndrome coronavirus 2 (SARS-CoV-2) poses ongoing challenges for rapid case detection to ensure timely treatment and isolation [Reference Wong, Leo and Tan1]. The disease can progress quickly to acute respiratory distress in severe cases, especially among at-risk groups such as older adults [Reference Rothan and Byrareddy2–Reference Ruan4]. With therapeutic options emerging [Reference Wang5], recognising cases at milder stages before they clinically deteriorate, usually after the first week of illness [Reference Han6], can be lifesaving. Moreover, due to the high transmissibility of SARS-CoV-2 in the earlier phases of illness [Reference Park7], earlier identification can reduce onward transmission [Reference Moghadas8, Reference Wu and McGoogan9]. Ideally, clinicians use reverse transcription polymerase chain reaction (RT-PCR) tests for diagnosis [10] but the caseload and associated testing costs may make this infeasible, particularly in resource-limited regions or areas where the pandemic is widespread.
Symptom-based diagnosis is challenging as many of the commonly reported symptoms of COVID-19 are shared by other respiratory viruses, including fever and dry cough [Reference Wu and McGoogan9, Reference Burke11], and because measures put in place to control the pandemic [Reference Chua12] have had the effect of substantially reducing the transmission of other droplet-borne viruses such as influenza [Reference Soo13, Reference Jones14]. Although several studies have developed algorithms to differentiate COVID-19 from non-COVID-19 patients, almost all were based on static clinical measurements taken at presentation, most commonly to tertiary care facilities [Reference Wynants15]. However, models that account for symptoms reported at an earlier stage, when patients may first present to outpatient departments, would be advantageous in reducing the delay to treatment and isolation.
To improve case identification, we developed a tool which evaluates patients based on their symptom profile up to 14 days post-onset using a case-control design, with 236 SARS-CoV-2 positive cases evaluated at public hospitals, and 564 controls recruited from a large primary care clinic. We determine the clinical differentiators of cases and controls and apply the algorithm to independent data on cases and controls. We show the importance of incorporating time from symptom onset when deriving model-based risk scores for clinical diagnosis. There was some degradation of model performance in further testing on independent datasets which included cases and controls presenting across several outpatient clinics, but the model could still reasonably differentiate COVID-19 from other patients presenting with symptoms of acute respiratory infection. A web-app-based tool has been developed for easy implementation as an adjunct to laboratory testing to differentiate COVID-19 positive cases among patients presenting in outpatient settings.
Methods
Data for model building and independent validation
Anonymised data from controls were prospectively collected in a large public sector primary care clinic in Singapore as part of a quality improvement project from 4 March 2020 to 7 April 2020. We included patients of at least 16 years of age, evaluated by a doctor to be suffering from an acute infectious respiratory infection, and who presented with any of 10 symptoms: self-reported feverishness, cough, runny nose or blocked nose, sore throat, breathlessness, nausea or vomiting, diarrhoea or loose stools, headache, muscle ache and abdominal pain. Sequential sampling was adopted wherein the first 5–10 eligible patients in each consultation session were recruited. Doctors completed a data collection sheet, which included patients' age, gender, tympanic temperature and symptoms since the onset of illness.
Data from COVID-19 cases were obtained from patients admitted to seven public sector hospitals in Singapore, to 9 April 2020. All SARS-CoV-2 were confirmed by RT-PCR testing of respiratory specimens as previously described [Reference Young16]. Demographic data and detailed information on symptoms, signs and laboratory investigations were collected using structured questionnaires with waiver of consent granted by the Ministry of Health, Singapore under the Infectious Diseases Act as part of the COVID-19 outbreak investigation. We extracted data on the same fields as described above from either the first day of presentation to hospital until they were discharged or until 15 days from illness onset, depending on which was earlier. For both primary care controls and COVID-19 cases, individuals who had temperatures of 37.5 °C or above were defined as having a fever. For COVID-19 cases following their admission, any incomplete temperature measurements after their fever end dates were imputed to have a temperature <37.5 °C.
Data for independent validation came from two sources. In an ongoing prospective study, the COVID-19 patients admitted to the National Centre for Infectious Diseases quantified sensitivity, while specificity was measured in classifying controls presenting with symptoms of acute respiratory infection recruited at 34 different primary care clinics between 14 March and 16 June 2020. Second, to independently assess sensitivity for cases presenting in outpatient care, we extracted data on symptoms used by the model through retrospective chart reviews of patients testing positive for COVID-19 between 17 March and 22 May 2020 at five large public sector primary care clinics which had access to PCR-based testing.
Modelling for predictive risk using symptom characteristics
We stratified illness days into four intervals for analysis (days 1–2, 3–4, 5–7 and 8 or more) to account for the temporal evolution of symptoms among cases and controls; day 1 was the date of symptom onset.
The covariates, with interactions with illness days, were first selected from the candidate list by fitting a generalised logistic regression model to compare cases vs. controls. Variables were selected with a least absolute shrinkage and selection operator penalty; covariates with non-zero coefficients were included in subsequent analyses. The analysis was implemented using the R package glmnet [Reference Friedman, Hastie and Tibshirani17]. After variable selection, it only renders coefficient estimation at average points in the cross-validation step, which adds difficulty in interpreting and differentiating the role of symptom profiles. Hence a second round of unpenalised logistic regression [Reference Dobson18] was carried out, utilising these selected variables for case vs. control groups (Supplement 1). Covariates included the interaction terms with illness days for symptoms and temperature in up to three categories (<37.5 °C; 37.5–37.9 °C; ⩾38.0 °C).
We utilised observations of COVID-19 cases from the day of admission until 14 days from symptoms onset. As incrementally more COVID-19 cases present to care over the course of their illness, there are more observations in later dates post illness onset. Contrariwise, the proportion of cases that can potentially present themselves for evaluation at primary care should decrease as an increasing proportion get diagnosed or recover. As the true distribution of cases presenting to primary care on different days of illness was not available, we adopted the simplifying assumption that each illness day would result in a linear decrease in the number of cases that can be diagnosed. Cases remaining undiagnosed on or beyond 15 days after onset of symptoms are considered to have recovered [Reference Zou19]. This was implemented by assigning weights to cases in a logistic regression model, with details of weighting strategy described in Supplement 2.
Performance evaluation
The performance of the model was evaluated by the area under the curve (AUC), or the area under the receiver-operating-characteristic (ROC) curve using leave-one-out-cross-validation (LOOCV). The ROC curve traces sensitivity and specificity along a sequence of cutoffs that classifies the patient group, and a high value of AUC represents good trade-off between prediction accuracy for discriminating cases and controls. LOOCV alleviates issues with overfitting.
Optimising classification of COVID-19 cases and validation on independent datasets
We proposed two strategies to determine the cutoff for differentiating COVID-19 positive or negative patients which prioritised high specificity (e.g. >0.95) with satisfactory sensitivity (e.g. ~0.7). High specificity was prioritised to limit wrongly classified controls to a level within the capacity of resources available for testing patients. The first strategy obtains a single cutoff with a minimum threshold for overall specificity. The minimum specificity above the threshold corresponding to the best sensitivity on the ROC using full dataset is chosen [Reference Mandrekar20]. The second strategy creates multiple cutoffs across illness days with a minimum threshold of overall specificity. A cutoff is chosen for each illness day group, which gives an overall specificity that meets this minimum threshold. For illness days 1–2, 3–4, 5–7 and 8 or more, an optimal combination of cut-offs was determined using a stochastic search algorithm, which is detailed in Supplement 3. Classification results are presented using observations from all cases, and separately for 223 observations from 26 cases severe enough to need admission to an intensive care ward, using the full dataset and on LOOCV. To further assess potential degradation of performance when applying model to other outpatient settings, we also tested all classification strategies on the independent validation datasets.
Results
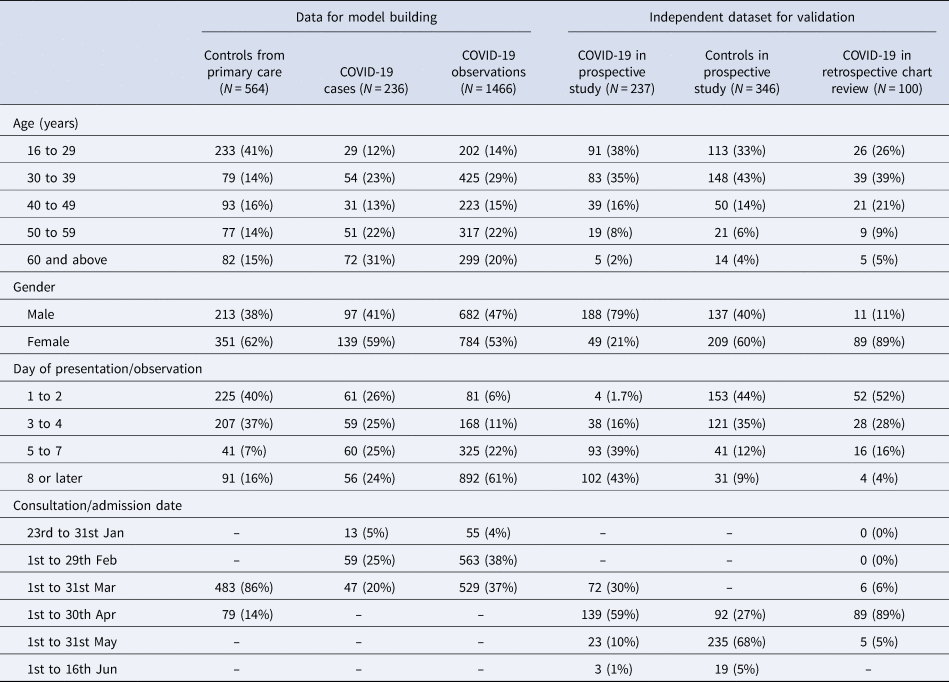
The model building dataset included single-day observations from 564 patients assessed at primary care clinics, and 236 COVID-19 patients admitted to the hospital who contributed to a median of 6 and a total of 1466 observations on symptoms and body temperature. The independent validation datasets included 237 COVID-19 patients and 346 controls from the prospective study, and 100 COVID-19 patients from retrospective chart reviews. Aggregate patient and observation level data are profiled in Table 1.
Table 1. Demographic and clinical profiles of case and control patients in 2020 used for model building and for model validation

Clinical characteristics of patients used in model building
SARS-CoV-2 positive cases differed from controls in the proportions presenting with different symptoms over time (Fig. 1). Overall, although only a slightly larger proportion of controls ever had cough than the cases (79% vs. 70%), a runny nose, sore throat and headache were substantially more common in the controls than in SARS-CoV-2 positive patients (68% vs. 25%, 71% vs. 44%, 19% vs. 9%). A larger proportion of COVID-19 positive patients ever had fever, diarrhoea, nausea and/or vomiting, tympanic temperatures higher than 37.5 °C and temperatures higher than 38 °C (80% vs. 24%, 24% vs. 5%, 7% vs. 3%, 28% vs. 9%, 17% vs. 3%). Notably, among COVID-19 patients, the proportions who ever had shortness of breath (SOB, 9%, 14%, 17%, 25%), diarrhoea (10%, 15%, 20%, 26%) and nausea and/or vomiting (4%, 4%, 7%, 11%) increased over the course of the illness, whereas those with temperatures ⩾37.5 °C (62%, 47%, 29%, 22%) and ⩾38 °C (41%, 27%, 18%, 13%) became fewer.

Fig. 1. Distribution of 12 symptoms across illness days separated by control and COVID-19 groups. Blue bars indicate the proportion of control group out of all controls having a symptom, and orange bars show the corresponding proportions of COVID-19 patients.
Modelling symptom cutoffs
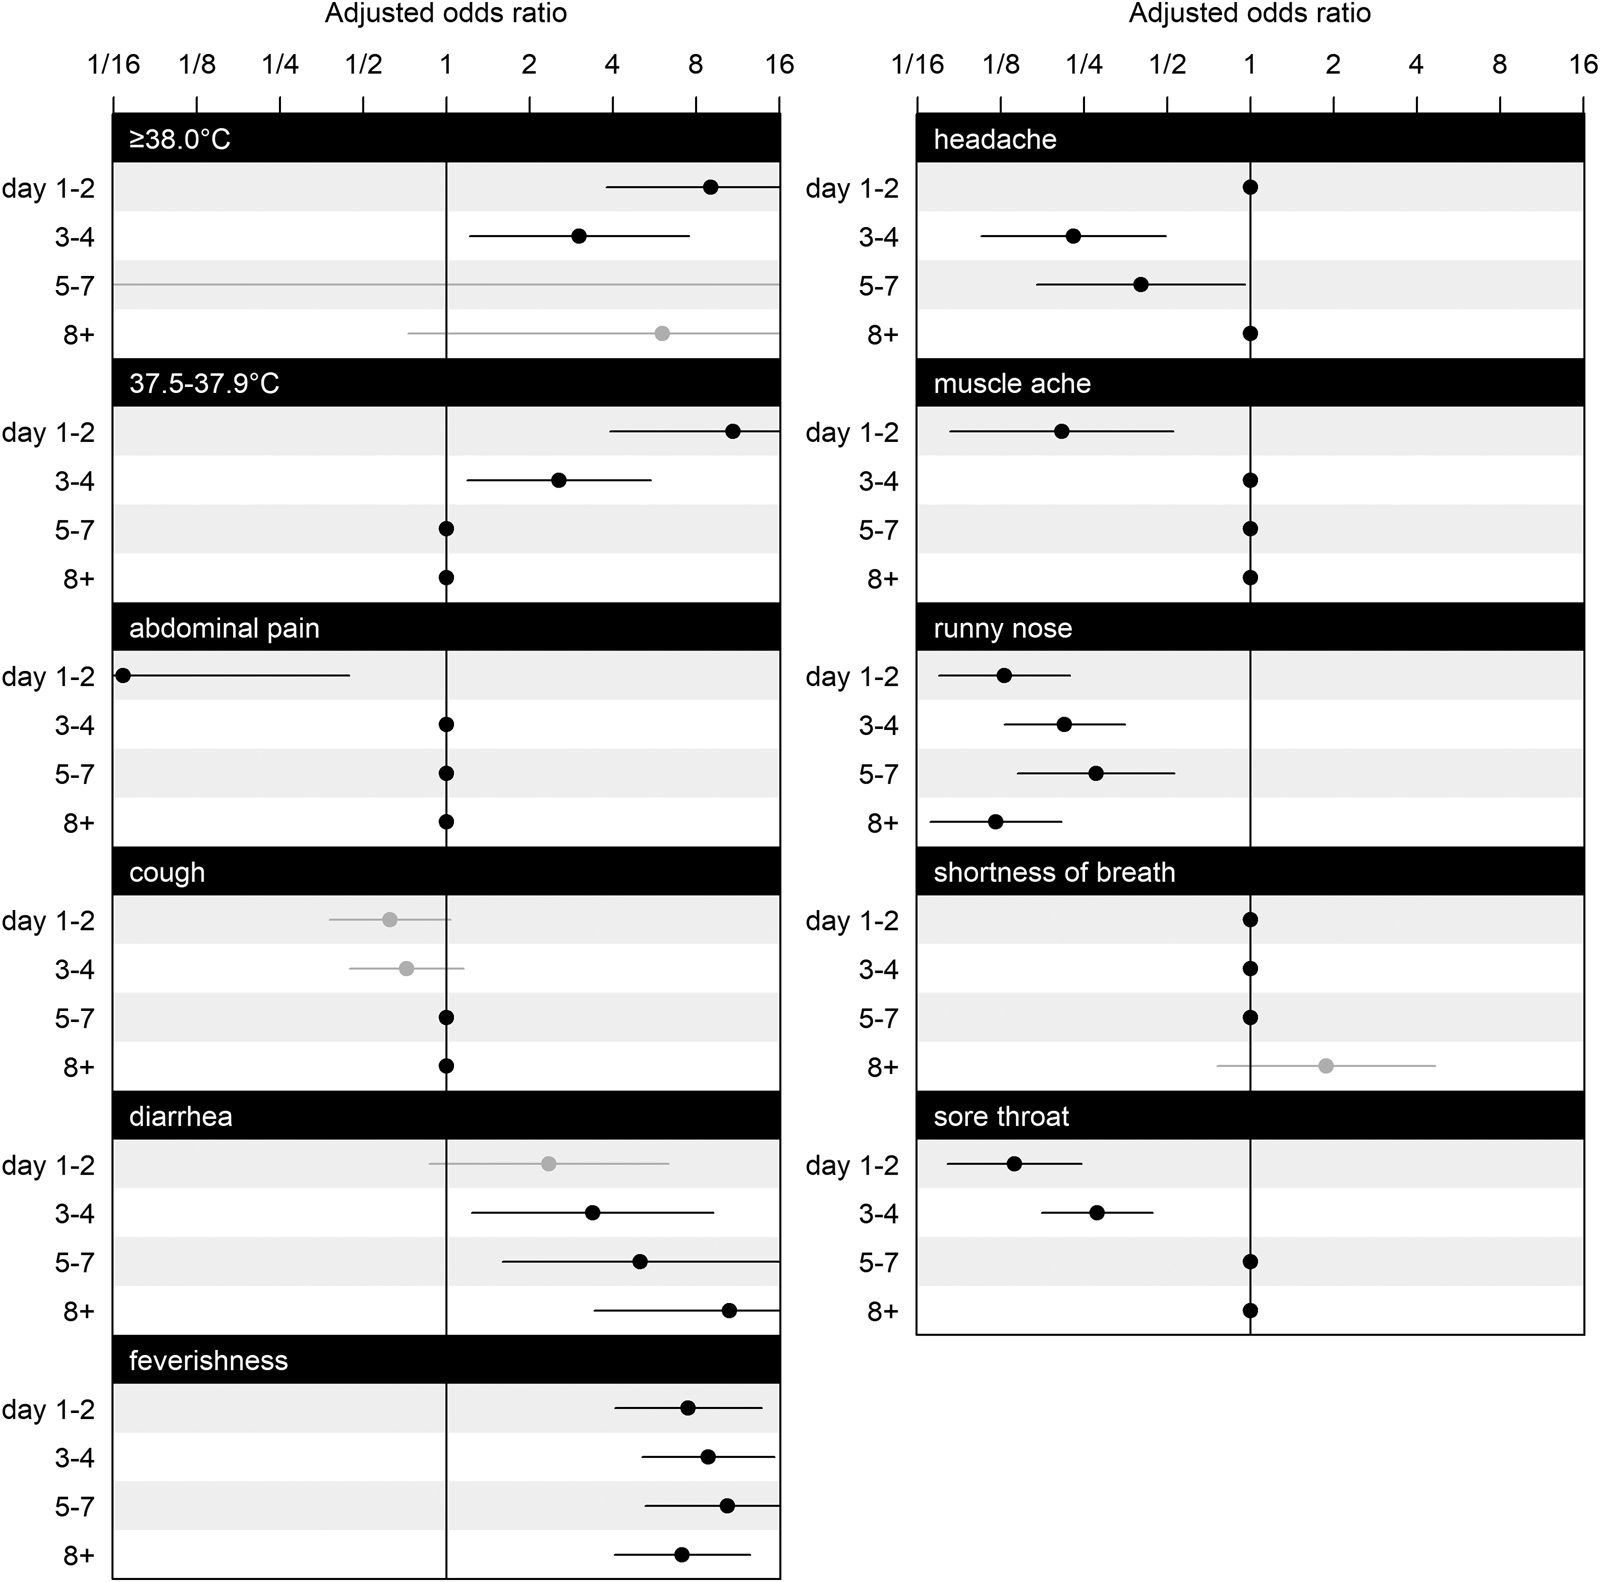
Figure 2 shows adjusted odds ratios (ORs) for symptoms and illness days (1–2, 3–4, 5–7, 8+). Temperature readings between 37.5 and 37.9 °C significantly increased the OR by 10.89 (95% confidence interval (CI): 3.91–30.35) on illness days 1–2, as well as on illness days 3–4 (OR: 2.55, 95% CI: 1.19–5.48) but not thereafter, and likewise for temperature readings ⩾38.0 °C (days 1–2: OR: 9.04, 95% CI: 3.78–21.60; days 3–4: OR: 3.02, 95% CI: 1.21–7.53). Ever feeling feverish was consistently associated with SARS-CoV-2 (on days 1–2: OR: 7.47, 95% CI: 4.06–13.81; on days 3–4: OR: 8.85, 95% CI: 5.10–15.33; on days 5–7: OR: 10.38, 95% CI: 5.23–20.58, on day 8 or more: OR: 7.12, 95% CI: 4.05–12.55). Diarrhoea had a significantly increased OR on all illness days except for days 1–2 (on days 3–4: OR: 3.38, 95% CI: 1.24–9.22; on days 5–7: OR: 5.03, 95% CI: 1.59–15.89; on day 8 or more: OR: 10.58, 95% CI: 3.43–32.67).

Fig. 2. Estimated coefficients for adjusted ORs and their CIs for symptoms at illness days 1–2, 3–4, 5–7 and 8+. The effects of selected variables from LASSO are plotted as line segments to indicate CIs and dots as mean estimates; those did not enter the second round of modelling are marked as dots without line segments as place holders for aesthetic and contrast. CIs coloured in black indicate significant effects, and in grey indicate non-significant effects. Having nausea or vomiting, is omitted from the figure because all of its interaction effects with illness days are excluded by GLM LASSO. The scale of parameter effect on the OR is exponentially spaced for visualisation.
Runny nose was consistently associated with a decreased OR (on days 1–2: OR: 0.13, 95% CI: 0.07–0.22; on days 3–4: OR: 0.21, 95% CI: 0.13–0.35; on days 5–7: OR: 0.28, 95% CI: 0.14–0.53; on day 8 or more: OR: 0.12, 95% CI: 0.07–0.21). Abdominal pain in the early stage of illness on days 1–2 was associated with a lower OR (OR: 0.07, 95% CI: 0.01–0.44), as was muscle ache on days 1–2 (OR: 0.21, 95% CI: 0.08–0.53), but not thereafter. Having a headache associated with a lower OR when presenting on days 3–4 (OR: 0.23, 95% CI: 0.11–0.49), and on days 5–7 (OR: 0.40, 95% CI: 0.17–0.96). Having a sore throat was also negatively associated with COVID-19 on days 1–2 (OR: 0.14, 95% CI: 0.08–0.25), on days 3–4 (OR: 0.28, 95% CI: 0.18–0.44).
Predictive performance
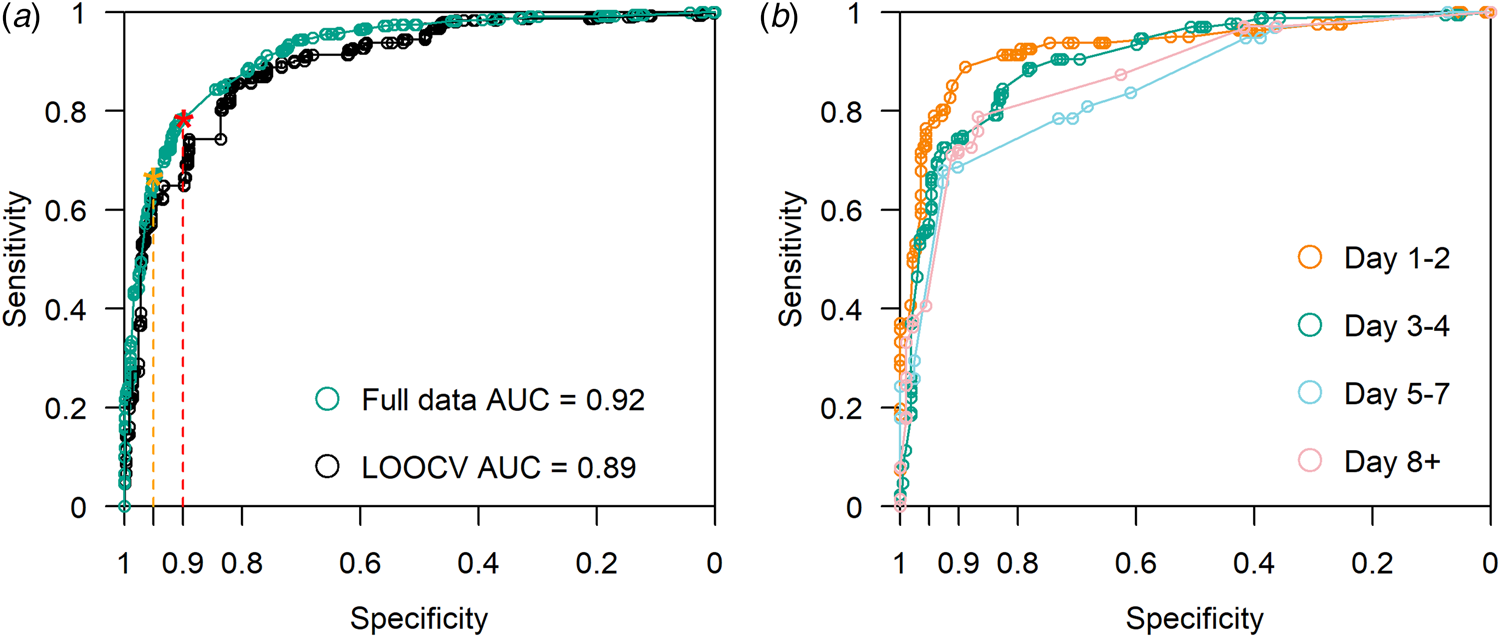
The model had an AUC of 0.89 on LOOCV (Fig. 3a). Compared to full dataset, ROC stratified by four groups of illness days is presented in Figure 3b. We present the accuracy of model prediction in Figure 4a by calibrating the proportion of true cases out of all samples predicted within certain predictive scores window, in other words precision or positive predicted value (PPV) defined across windows of predictive scores. With predicted scores above 0.95, 97.9% of the sample are COVID-19 cases (Fig. 4a). For predicted scores below 0.2, the proportion of COVID-19 positive cases was 3.9%. Reasonable separation of the predicted scores was observed between cases and control (Fig. 4b). The calculated sample sensitivity, specificity, PPV and negative predicted value (NPV) across a grid of cutoffs between 0 and 1 are in Figure 4c.

Fig. 3. (a) ROC curve with LOOCV. AUC = 0.89. Using full data, AUC = 0.92. With a minimum specification threshold at 0.95 and 0.9, the cutoff points are found at 0.92 and 0.74 respectively as indicated by the orange and red stars on the curve. (b) ROC curve stratified by illness days 1–2, 3–4, 5–7 and 8+.

Fig. 4. Comparisons of predicted risk to observations: (a) shows bars with the height indicating the percentage of cases in respective intervals of predicted risk, (b) plots the predicted risk grouped by case or control and (c) traces the calculated in-sample sensitivity, specificity, PPV and NPV for a grid of predicted risks as cutoffs spaced at 0.001 from 0 to 1.
Classification cutoffs
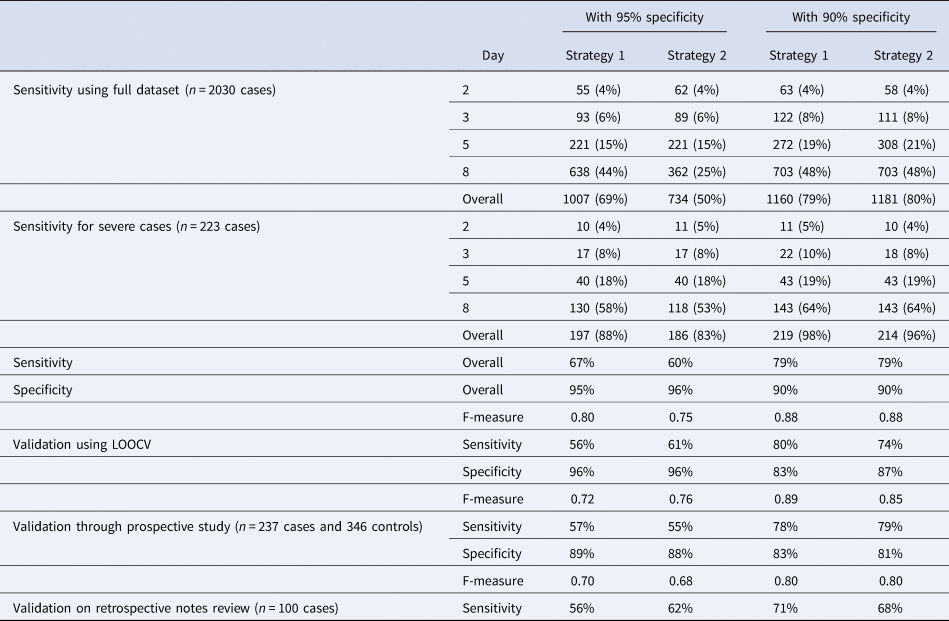
Table 2 shows results from implementing various cutoffs with target specificities of 90–95% using the two proposed strategies (see ‘Methods’ section). The model performed better for severe cases with an overall detection rate of 88% for strategy 1 (with a single threshold for all illness days), and 83% for strategy 2 for a target specificity ⩾95%. With a relaxed 90% minimum specificity threshold, the detection rates for severe cases were 98% for strategy 1, and 96% for strategy 2.
Table 2. Number of cases detected and its percentage by illness days with cutoff schemes by strategies 1 and 2 at an overall cutoff of 0.95 minimum specificity threshold, and 0.9 minimum specificity threshold, and performance on the independent validation datasets. Strategy 1 chooses a single cutoff point on the LOOCV ROC curve that meets minimum specificity threshold, and strategy 2 searches for an optimal combination of cut-offs for each illness day group that gives an overall specificity that meets this minimum threshold, using a stochastic search algorithm.

Validation using the prospective study caused little change in sensitivity for strategies 1 and 2 at target specificities >90%, but a decrease in sensitivity of 10% and 5%, respectively, for a target specificity of >95%. There was also a decrease in observed specificity of between 6% and 9% across all four combinations. Using the data from retrospective chart review, we observed 11% drop in sensitivity for both strategy 1 at 95% specificity (from 67% to 56%) and strategy 2 at 90% specificity (from 79% to 68%), with a slight increase of 2% for strategy 2 at 95% specificity and decrease of 8% for strategy 1 at 90% specificity.
Discussion
Summary
Our findings demonstrate the importance of utilising the symptom profile of COVID-19 across time. Notably, some symptoms were highly differentiated in the proportions observed for cases vs. controls, conditional on the time of reporting relative to the day of illness onset (Fig. 1). These differences informed a model that is reasonably discriminatory and can be set to give reasonably high specificity while retaining good sensitivity. In resource scarce regions, utilising critical symptom cutoffs as a function of time from symptom onset can facilitate rapid diagnosis where test kits are constrained. Model performance was superior for severe as compared to mild cases in need of more pro-active management. The list of symptoms used is reasonably parsimonious, and can be implemented to rapidly classify and prioritise testing, isolation and hospitalisation of potential cases through a simple tool to risk stratify patients based on reported symptoms and their day of illness onset, as we have done (URL).
Comparison with existing literature
We observed COVID-19 symptoms largely in line with previous studies. Cough, breathlessness and fever were present in the clinical presentation of a large proportion [Reference Burke11, Reference Wynants15, Reference Guan21], but we must point out how cough has little discriminatory value against other primary care consults and breathlessness is a late symptom associated with more severe illness (15.1% in non-severe cases and 37.6% in severe cases). Our study concurs that feverishness (88.7%) is a dominant symptom, but diarrhoea was less common in some other studies (<8.9% in [Reference Zou19–Reference Guan21]). Some studies, particularly of hospitalised patients, do suggest the majority would have feverishness (>66.9% in [Reference Zou19–Reference Guan21, Reference Zhao35]), and higher proportions with gastrointestinal complaints (~26–37% in [Reference Song24, Reference Diaz-Quijano36–Reference Luo, Zhang and Xu38]). Differences between studies may be attributable to the inclusion of patients at varying stages of their illness: studies based on hospitalised cases would include more patients at later disease stages, with higher proportions having breathlessness and diarrhoea. In our study, diarrhoea was not common in early illness but increased in proportion and discriminatory value as the disease progressed. Early presentation of fever and cough is supported in studies [Reference Zhou22, Reference Wang23], SOB is presented later at 7 days [Reference Zhou22] or 5 days [Reference Wang23], which concur our findings of symptoms through the course of illness (Fig. 1). On the contrary, although the importance of feverishness as a symptom has been emphasised, we caution that in a large proportion of COVID-19 cases, the proportion with temperatures ⩾37.5 °C is only slightly over 60% on days 1–2, then drops below 30% from day 5 onwards. It decreases in discriminatory value in later illness, and at a stage when a patient may still be infectious.
Strengths and limitations
Compared to existing predictive models for diagnosing COVID-19 patients from symptomatic patients as reviewed in [Reference Wynants15], the absence of laboratory and radiographic investigations and even medical measurements besides body temperature (e.g. blood pressure, oxygen saturation or clinical signs in [Reference Zhou3, Reference Wu and McGoogan9, Reference Wang23–Reference Yu28]), makes our diagnosis tool easier to implement in outpatient practice. Notably, none of the existing diagnostic models in our review of published research account for how illness days modifies the predictive value of different symptoms, although some accounted for the effect of illness day in the variable selection process (e.g. by restricting the analyses to earlier infections [Reference Zhou3, Reference Song24, Reference Feng25, Reference Sun29]). We intentionally omitted demographic and epidemiologic variables as predictors, given the propensity of such associations to change over the course of an epidemic. In spite of this, our model has one of the highest areas under the curve, even on LOOCV, among those that do not rely on laboratory investigations. Its performance was still respectable when validated in the prospective study described.
This study has several limitations. First, the distinction between dry and productive cough, and anosmia as a symptom were not captured in this study, particularly because the latter was reported only after our study was started. These have been reported as clinically relevant characteristics for SARS-CoV-2 positive individuals [Reference Rothan and Byrareddy2, Reference Vaira30, Reference Lechien31], and their inclusion may have improved the performance of the algorithm further. However, we would point out that even without including these, our algorithm performs well. For instance, a multivariate analysis including anosmia [Reference Menni32] had a lower AUC of 0.76 compared to ours (0.89 on LOOCV). Second, our controls were not tested for COVID-19. They were collected from outpatient clinics and were diagnosed as other diseases than COVID-19. However, there was no widespread transmission of COVID-19 at the time of data collection for our controls. For instance, testing of 774 residual sera samples collected in early April 2020, around the time we ceased collecting data controls, identified no seropositive individuals (unpublished data [33]). Cumulative number of laboratory confirmed cases was 926 as of 31 March 2020 and concurrent studies showed successful containment strategies in Singapore at the time [Reference Tariq34]. The risk of misclassifying a case as a control was negligible. Third, we recognise that the ‘controls’ against which our COVID-19 patients must be distinguished may differ due to variations in the epidemiology of background illnesses by place and time. This limitation can potentially be overcome by collecting, then repeating the analyses using, updated data from locally relevant ‘control patients’, collected through the simple data collection format we used.
Conclusions and relevance
Our study provides a tool to discern COVID-19 patients from controls using symptoms and day from illness onset with good predictive performance. It could be considered as a framework to complement laboratory testing in order to differentiate COVID-19 from other patients presenting with acute symptoms in outpatient care.
Supplementary material
The supplementary material for this article can be found at https://doi.org/10.1017/S0950268821000704.
Acknowledgements
We would like to acknowledge Prof. Leo Yee-Sin, Dr Shirin Kalimuddin, Dr Seow Yen Tan, Dr Surinder Kaur MS Pada, Dr Louisa Jin Sun and Dr Parthasarathy Purnima and the rest of the PROTECT Study group for their contributions.
Financial support
This research is supported by the Singapore Ministry of Health's National Medical Research Council under the Centre Grant Programme – Singapore Population Health Improvement Centre (NMRC/CG/C026/2017_NUHS) and grant COVID19RF-004.
Conflict of interest
All authors declare no conflict of interest.
Data availability statement
Data will be available upon a reasonable request. Code used for statistical analysis is accessible on GitHub.


