


Introduction
At the beginning of 2020, the news about the emergence of the new severe acute respiratory syndrome coronavirus 2 (SARS-CoV-2) which is dangerous for humans and causes the coronavirus disease-2019 (COVID-19) broke out. The virus spread all over the world, reaching Poland in March 2020. Since then, scientists from various fields have been trying to stop the deadly pandemic. The main method of stopping it is the widespread distribution and application of the vaccine [1]. But until then, it is necessary to respect other ways of preventing the pandemic spread such as hand washing, wearing a mask and social distancing [Reference Badr2]. It is also important, already in the early stage of the outbreak, to develop tools which help mitigate the negative effects of the pandemic [Reference Poletto, Scarpino and Volz3]. One of those negative effects is an acute increase in oxygen demand. To help governments and hospital managers find the most appropriate solution under pandemic conditions, we have engaged in work to develop a hybrid local oxygen demand system using a pressure swing adsorption (PSA) cycle. For that matter, we have proposed a mathematical model to forecast the pandemic spread.
Mathematical epidemiological models are not a new concept. One of the simplest models, and the most used to this day, is the SIR model described by Kermack and McKendrick [Reference Kermack and McKendrick4]. This model was later developed by many scientists and used to predict, among others, the epidemics of influenza, dengue fever and SARS [Reference Rodrigues5]. Mathematical modelling is a powerful (valuable) tool to understand COVID-19 transmission and to analyse different scenarios. Regardless of the approach adopted to build the model, the main and most important feature of any model is its effectiveness. High effectiveness is required to make the model a useful tool for people who are responsible for making important decisions about health policy.
During the COVID-19 pandemic, several models have been developed and described since the early phase of the pandemic. In March 2020, Remuzzi & Remuzzi [Reference Remuzzi and Remuzzi6] presented a model prepared for the Italian political leaders, based on the counted number of patients in intensive care units (ICU) in Italy. The model allowed predicting the increase of the number of patients in ICU based on fitting the exponential curve to the data set. Another approach was adopted by Manca et al. [Reference Manca, Caldiroli and Storti7], who present more accurate models, also based on the number of patients in ICU during the first wave of the Italian COVID-19 epidemic. Their models are based on different, already known curves, such as EMG, Logistic, Gompertz. There were also more mathematically complicated attempts to adapt modifications of a typical SIR model. Carcione et al. [Reference Carcione8] performed a simulation of the COVID-19 pandemic using a deterministic SEIR model. This model is based on four differential equations describing the following groups of people: susceptible, exposed, infected and recovered. This model is more demanding mathematically than the ones discussed earlier, but it allows to calculate various epidemiological factors, such as reproduction ratio R 0 (associated with the reproductive power of the virus), virus-induced average fatality α, per-capita natural death rate μ.
The problem of modelling the COVID-19 spread has also been worked in Poland. The epidemiological modelling team of the Interdisciplinary Modeling Center of the University of Warsaw [9], part of the advisory group of the Polish Ministry of Health, have prepared an advanced model to predict potential paths of further epidemic spread, as well as to conduct simulations on various scenarios according to the restrictions introduced. The StatSoft Poland [10] approached the issue differently. They modelled and analysed various pandemic data using statistical methods, aiming to find a mechanism of increase in the number of COVID-19 cases in Poland.
In literature, there is one research that describes a forecast of the COVID-19 epidemic in Poland. Orzechowska & Bednarek [Reference Orzechowska and Bednarek11] taking into account the impact of government regulations and people's behaviour, using eSIR modelling estimated that by the end of September, the lowest number of infected cases would be 263 900. In addition, they calculated that the total number of COVID-19 cases could exceed one million at the beginning of 2021. Meanwhile, there have been approximately 100 000 total cases reported in the country by the end of September, whereby one million cases have been reached already in early December.
We think that instead of focusing on which model is the most accurate, we should accept that ‘one model cannot answer all our questions’. We need more models that can answer complementary sub-questions that will put the puzzle together and stop the COVID-19 spread.
In this paper, we present our method to build a new data-driven model for predicting the daily number of new coronavirus infections.
The presented model was built based on COVID-19 data from Poland in 2020. The model uses exponentially modified Gaussian cumulative (EMGCum) curve. The model was used for short-term predictions in each stage of the COVID-19 epidemic in Poland. The practical advantage of the proposed method is that, using a simplified modelling approach it does not require neither advanced mathematical background nor the use of epidemiological factors.
The EMG curve has found many applications. McGuffin et al. [Reference Li and McGuffin12–Reference Howerton and McGuffin14] used it to analyse peaks in chromatography. Golubev [Reference Golubev15, Reference Golubev16] found an EMG application to model cell cycles in biology. Sager & Timoshenko [Reference Timoshenko and Sager17, Reference Sager and Timoshenko18], based on EMG curve, built trade-predict models in economics. EMG was even used to describe the football scoring process in football statistics as found by Da Silva and Dahmen [Reference Da Silva and Dahmen19].
Methods
We have been interested in the issue of modelling the COVID-19 outbreak in Poland since its very beginning. Our model was prepared based on a data set made by Rogalski [Reference Rogalski20] as part of his civic engagement. The data set was based on official reports published by the Ministry of Health of the Republic of Poland. To build our model we used the following data from his set: diagnosed new daily cases and a total number of coronavirus infection cases in Poland. Additionally, from new daily cases, we calculated the 7-day moving average (7-dma) of new daily cases. We selected the range of data from 3 March 2020 (one day before the ‘patient 0’ in Poland was diagnosed) to the end of 2020. Thus, 3 March 2020 was defined as the first day (assigned number 1) and 31 December 2020 was defined as the last day (assigned number 304). We have analysed the variability of the selected data over time in the specified range. As a result, as Figure 1 shows, we divided the data range (A), depending on the shape of the new daily cases curve, into four sections: (1) first peak (B; days 1–45; 3 March–16 April), (2) relative plateau (C; days 45–130; 16 April–10 July), (3) second peak (D; days 130–190; 10 July–8 September), (4) third peak (E; days 190–304; 8 September–31 December).

Fig. 1. Timeline of the COVID-19 epidemic in Poland divided into sections depending on the shape of the new daily cases curve.
In the next step, using TableCurve2D 5.01 (Systat Software Inc. Richmond, Ca.) a software tool, we compared the fit of several selected curves to the total of COVID-19 cases in Poland. Based on commonly used fit criteria (r 2 Coefficient of Determination, Degree of Freedom Adjusted R 2, Fit Standard Error, F-value), we selected the EMGCum. The exponentially modified Gaussian (EMG) probability distribution is defined as the convolution of an exponential distribution and a Gaussian distribution which are independent of each other. The mathematical form of the cumulative form of the EMG function that we used in our methodology is as follows:

where: y – total number of COVID-19 cases since the beginning of the epidemic, x – number of epidemic days represented by the numbers 1 to 304 (1–304; 3 March–31 December), a, b – transition height, c – transition centre for deconvolved Gaussian cumulative, d – transition width for deconvolved Gaussian cumulative, d > 0, e – exponential time constant, e≠0, exp() – natural exponential function, erf() – Gaussian error function, $n = {{x-c} \over {1.4142d}}$
The developed fitting method is based first on fitting the cumulative form of the EMG curve (presented as equation 1) to the real cumulative curve of all COVID-19 cases. Then, we used the differential form of the EMG equation to compare with the daily cases data of COVID-19, by calculating Δy, according to the following formula:

where: i – the sequence number of a day of the epidemic, x – following the number of days of the epidemic (1–304; 3 March–31 December).
What is shown in the figures in this paper is actually a comparison of daily COVID-19 cases with the differential form of the EMG equation. In our opinion, that form of providing results is better to perform a visual assessment of model predictions. In the authors' opinions, such a representation is especially helpful in determining the dynamics of the spread of an epidemic. Moreover, the authors found that to achieve possibly best fit of EMG curve to real COVID data it was a necessity to apply data representing a single peak or peak and plateau. Thus, applying the adopted methodological criteria, a fitting was performed on the appropriate data set. In situations where there were significant changes with newly emerging data and where the model deviated from the expected value, the data set was changed to represent a single peak or peak and plateau.
From the obtained Δy values we calculated the 7-day moving averages curves. In the next step, we fitted the calculated curves to the 7-day moving average daily new COVID-19 cases in Poland. The basis for predictions was to extrapolate the obtained curves 14 days forward. Obtained predicted values were compared with real values by calculated model estimation error (MEE) of these two. The MEE was defined as:

where P = predicted 7-day moving average of daily new COVID-19 cases, R = real 7-day moving average of daily new COVID-19 cases.
This definition of MEE has been chosen because when the data obtained from the model will be higher than the real data, then the MEE will be positive, while when the data obtained from the model will be lower than the real data, then the MEE will be negative.
Results
Figure 2 includes five graphs comparing the data obtained from our model and real data. For a better interpretation of values, below Figure 2, we included Table 1. which presents a comparison of values between the real 7-day moving average (7-dma) of daily new COVID-19 cases and the predicted cases. The comparison was made for each of fourteen prediction days, also with the MEE for each day.
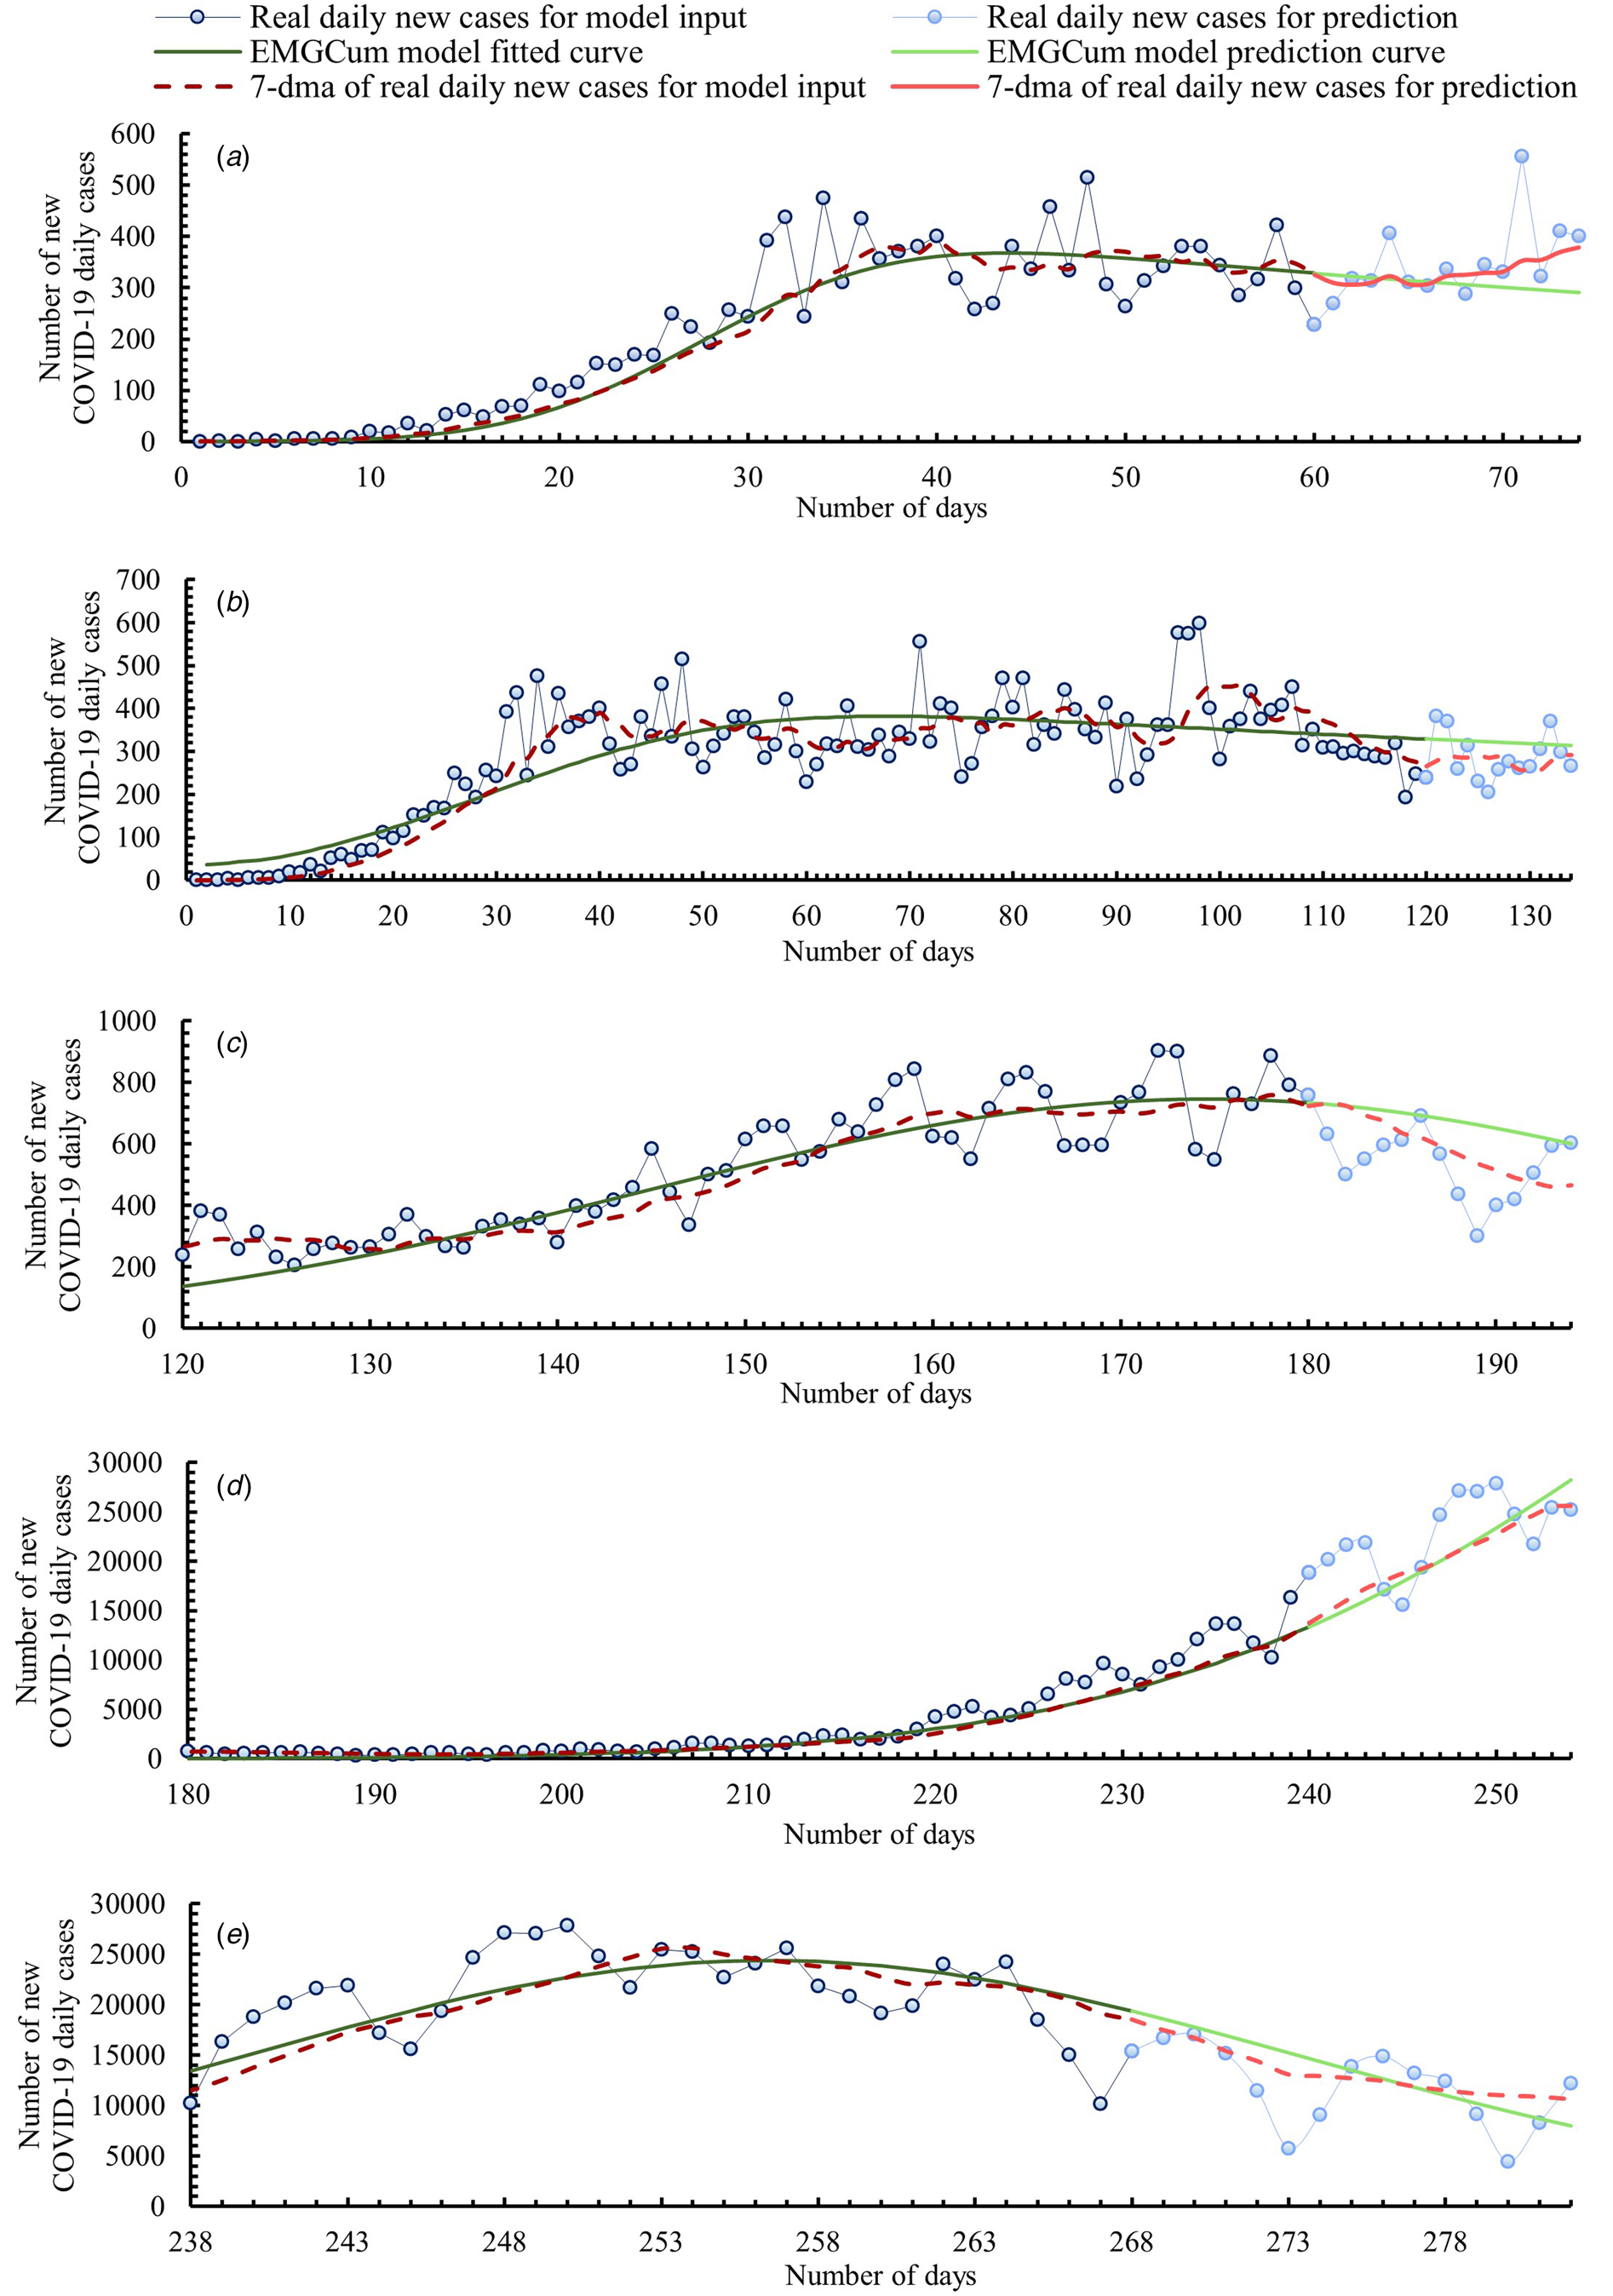
Fig. 2. Timeline of the COVID-19 epidemic in Poland. Comparison of data obtained from our model and real data.
Table 1. Comparison of values between real 7-day moving average (7-dma) of daily new COVID-19 cases and predicted cases from our model

Graph A covers the time range from the one day before when the first case of COVID-19 was confirmed in Poland to the beginning of the relative plateau phase. Thus, the model curve was fitted based on the first 60 days of the epidemic (3 March–1 May). The prediction was made up to day 74 (15 May). From an epidemiological point of view, Graph A shows the first epidemic wave. After an initial rapid growth in new daily cases, the model curve flattened and reached an inflection point at day 44 (15 April). From day 44 the model curve indicated a slow decrease in new daily cases. By day 70 (11 May), the MEEs were no more than ±10%. Then, as a result of daily new cases growth, the MEEs increased. We think that the curve flattening was related to restrictions introduced by the Polish Government. It is proven that reducing social contacts, respecting physical distancing and hygiene measures help sharply reduce the reproduction ratio R 0 [Reference Petersen21]. The first restrictions limiting the number of people participating in mass events were introduced already on day 8 (10 March). Two days later, all schools and universities were closed, and activities of cultural institutions were limited. Because of the constantly increasing daily numbers of COVID-19 cases, more and more restrictions have been introduced. When the infection curve flattened out, a gradual relaxation of the restrictions started. The first phase of relaxation of restrictions began on day 49 (20 April) and lasted until day 96 (6 June).
Graph B covers the time range of when the first wave of the COVID-19 outbreak appeared in Poland and the entire relative plateau phase. Graph B is therefore a further prediction than Graph A. The model curve was fitted based on the first 120 days of the epidemic (3 March–30 June). The prediction was made up to day 134 (14 July). Real numbers of daily cases were greater than the prediction shown in Graph A. Therefore, the model curve generated using more input data was reshaped. As a result, for 14 days of prediction, an average daily MEE equal to 14.9% was obtained, with a maximum of 23.8% for day 129 (9 July) and a minimum of 7.4% for day 134 (14 July). As the spread of the virus slowed down in the summer because of a lower reproduction ratio R 0 than in autumn/winter [Reference Kissler22], there was a short plateau phase despite the relaxing of restrictions and increasing social contacts.
Graph C includes the entire second peak of the COVID-19 epidemic in Poland. It is important to mention that the introduction of the term ‘second peak’ is not the same as the official pronouncement about a second wave of the epidemic. This term was only introduced for modelling purposes. Nonetheless, this growth should be alarming. Therefore, on day 159 (8 August), the Polish Government reintroduced some restrictions dividing Poland into zones with different sanitary rules. The model curve was fitted based on days 120 to 180 of the epidemic (30 June–29 August). The prediction was made up to day 194 (12 September). Data from the model curve were significantly overestimated over a 14-day forecast, reaching up to a MEE value of 33.4% on day 193 (11 September), even though the average MEE for the first 7 days was as low as 6.6%. Thus, it is important to update the model as soon as new data is available. Frequent updating is easier with a less time-consuming method like the one we proposed.
Graph D shows the beginning of the growth of the third peak of the COVID-19 epidemic in Poland, which had the largest increase in daily infections in 2020. In contrast to the other graphs presented in this paper, Graph D shows the model prediction for rapidly increasing cases of COVID-19 infections. In response to this growth, on day 236 (24 October) the Polish Government put the entire country under stricter restrictions. The model curve was fitted based on days 180 to 240 (29 August – 28 October) of the epidemic. The prediction was made up to day 254 (11 November). For 7 days, the prediction was slightly underestimated with an average daily MEE equal −4.2%. For the next 7 days the prediction was slightly overestimated with an average daily MEE equal 4.1%.
Graph E presents a model curve made from third epidemic peak growth, its inflection and the beginning of its decrease. The model is therefore a prediction of the further decrease in COVID-19 infections that occurred at the third peak. The model curve was fitted based on days 238 to 268 of the epidemic (26 October–25 November). The prediction was made up to day 282 (9 December). From an epidemiological point of view, Graph E shows the second wave of the epidemic in Poland, which was significantly greater than the first wave. In the first wave, the model curve inflection point was reached on day 44 (15 April) with a 7-day moving average of daily new COVID-19 cases being approximately 367, while the model curve inflection point of the second wave was reached on day 256 (13 November) with a 7-day moving average of daily new COVID-19 cases being approximately 24 373. For 8 days the prediction was slightly overestimated with an average daily MEE equaling 8.6%. Then, the real 7-day moving average decreased more rapidly than the model average. Thus, the model curve was more and more underestimated on each following day of prediction. From day 9 of prediction to day 14 of prediction, the MEE increased from −1.1% to −25.4%.
Discussion
We have presented a simplified method for building the COVID-19 new daily cases model. The study demonstrates a very good correlation between the real COVID-19 data from Poland and the data from our model. In the proposed form the model cannot be used to study what kind of impact may the changing of different epidemiological factors have on the epidemic spread but in the face of quickly changing government policies and the emergence of vaccines, more complex models based on multiple factors become even more difficult to apply, while the data-driven model we proposed is adaptive to the changing trends. We think that the best approach to modelling of the COVID-19 epidemic is to use both: extended epidemiological models and the simplified approach. Epidemiological models may be more useful for long-term forecasts and for showing the impact of different decisions on the epidemic spread, while our model may be more effective for short-term forecasts. An additional advantage of this model is that there is no need for assuming in advance some unknown parameters in order to use it. We showed that even building a simplified model can lead to good correlations. The results mainly demonstrate two things. Firstly, low MEEs of model curve fits in the short term were obtained. Secondly, for the best fit, it is necessary to update the model parameters as frequently as possible. To demonstrate the impact of model parameters daily updates on the prediction accuracy we chose the data presented in Graph C from Figure 2 because of its highest MEE values among those presented in this article. The method used in this paper was based on making a 14-day prediction based on one-time selected model parameters for each of the ranges. To check the aforementioned impact, the method was changed and after each day of prediction, the EMGCum equation parameters were updated. The graph presenting the updated model curve is shown in Figure 3. As a result of model parameters daily updates, the model curve described the real epidemic spread much more accurately. A comparison of the MEEs obtained without daily updates and with daily parameter updates is shown in Table 2. The higher the number of prediction days, for the model curve without daily updates, the stronger its trend of the MEE to reach the maximum MEE value of 33.4%. The model curve with frequent parameter updates does not show any noticeable trend, but its MEE reached a maximum value of 18.9%. For example, looking at the last day of the first prediction week (day 187; 5 September) the MEE of the model curve fit without updates was 15.3%, while for the curve with updates it was 13.2%, so the MEE was reduced by 2.1%. On the last day of the second prediction week (day 194; 12 September), the MEE of fitting the model curve without updates was 29.1%, while for the curve with updates it was only 7.5%, which reduced the MEE by an impressive 21.6%.

Fig. 3. Comparison between the data obtained from our model with daily parameters EMGCum actualisation and data obtained without daily parameters EMGCum actualisation.
Table 2. Comparison of values from our model between 7-day moving average (7-dma) of daily new COVID-19 cases with daily parameters actualisation and 7-dma of daily new COVID-19 cases without daily parameters actualisation

Also, it must be pointed out that the range of data for the EMGCum parameters adjustment should be taken from a single peak or peak and plateau. The EMGCum curve is unlikely to fit well for double peaks. This requirement comes from the EMGCum curve mathematical formulation which defines its specific shape. In addition, we recommend using a 7-day moving average of daily new COVID-19 cases where, in the case of Poland, reporting of new daily cases depends on the reporting organisations' working days. Analysing the new daily cases, one notices that there is usually a decrease in cases during weekends, which is not caused by an actual decrease in cases but by non-working days for reporting organisations.
Conclusion
The COVID-19 epidemic in Poland so far has had three waves since its outbreak. Although the third wave has now passed, infections are decreasing and vaccinations are gradually being administered, we must be aware that the fight against COVID-19 is not over. Especially the threat of new, emerging, more infectious virus mutations and the uncertainty of how long the immune antibodies in people after infection or vaccination can last, make it necessary to still control and predict the rate of COVID-19 spread using mathematical models. The models must send a simple message to those who manage the public health policy. Our model can be applied as a simplified but effective decision making support tool. People using our method should be familiar with the rules of its application and be aware of its limitations. Further works shall be focused on verifying how our proposed methodology describes the COVID-19 epidemic in other countries. We firmly believe that the crisis in Poland from the end of 2020, when the Polish Healthcare System faced a real breakdown threat, will not happen again. It was a major organisational challenge to admit a rapidly increasing number of patients with COVID-19 into hospitals and to organise a steady supply of oxygen. The fight against COVID-19 gave us all valuable experience. Efforts of scientists and doctors helped minimise the negative effects of this battle. However, despite the emergence of vaccines, it is important to still focus on the development of tools which could help reduce these negative effects. Therefore, we think it is a good idea to further develop models for a better understanding of the coronavirus epidemic development dynamics and, at the same time, to rethink the current ways of supplying oxygen to medical facilities. In our opinion, these are important topics that need to be undertaken immediately. The results of our research could prove helpful not only in the case of the COVID-19 pandemic but could also find potential application in the case of the emergence of other infectious diseases with similar dynamics as COVID-19.
Financial support
This work was supported by the ‘Initiative of Excellence – Research University – IDUB, Activity no. 4’ programme of AGH UST in Krakow, Poland.
Conflict of interest
The authors declare no conflict of interest.
Data availability statement
The data that support the findings of this study are available from the corresponding author, Katarzyna Zarębska, upon reasonable request.


 Open access