


INTRODUCTION
In 2000, the US Center for Disease Control and Prevention (CDC) convened a panel of experts to review the pattern of measles in United States and concluded that the virus was no longer endemic [1–4]. The panel also recommended maintaining a high vaccination coverage (>90% in preschool children and >98% in children aged 4–6 years) to prevent re-establishment of continuous transmission [5, Reference Blumberg6]. Despite high measles vaccination coverage (overall 94·7% in 2014), the United States has seen a substantial number of measles cases since 2008 [Reference McCarthy7–Reference Parker9]. Moreover, the annual number of measles cases has grown since then, with the majority of cases in older age groups (>20 years) [Reference McCarthy7]. The re-emergence of measles within a few years of implementing high vaccination coverage has been observed in many other places such as Brazil [Reference Camargo10, Reference Domingues11], Vietnam [Reference Sniadack12], France [Reference Antona13], countries in Eastern Europe [Reference Hennessey14] and Africa [Reference Grais15–Reference Minetti17]. For example, a large measles outbreak occurred in 1988 in Muyinga state in northeast Burundi [Reference Chen18]. The outbreak (1337 measles cases) occurred at a time when there was historically high measles vaccine coverage and after a long period of low measles incidence (a mean of 106 cases reported in the preceding 3 years). Long-term surveillance of measles incidence in northern provinces and Adamaoua in Cameroon also indicates a large measles outbreak in 2000–2001 after several years of relatively low incidence [Reference Cummings19]. A similar concern has also been raised in a recent seroprevalence study in Cochabamba, a state in Bolivia, Latin America [Reference Masuet-Aumatell20]. No measles cases have been reported in Cochabamba or in other parts of Bolivia since October of 2000, but the study concludes that there is high measles susceptibility in Bolivian children, therefore authorities have reconsidered immunization strategies in order to prevent measles resurgence occurring nationally and regionally.
The decline in prevalence following the introduction of vaccination results in a lower force of infection felt by those individuals who are not immune. Immediately following an outbreak, the population is already largely comprised of those previously immunized by natural infection; the addition of vaccination leads to a transient period of low prevalence before increasing to a new equilibrium level that is lower than the pre-vaccine equilibrium. McLean and colleagues [Reference McLean21, Reference McLean and Anderson22] referred to this transient period of low incidence as the ‘honeymoon period’. Scherer & McLean have shown that post-honeymoon dynamics exhibit a new cyclic pattern, known as a ‘post-honeymoon period’ epidemic, when vaccination coverage is lower than the herd immunity threshold [Reference Scherer and McLean23]. Mathematical models of vaccination predicted the ‘honeymoon period’ to be the interval between the pre- and post-vaccination pattern of recurrent measles epidemics, the latter with a longer inter-epidemic period and smaller peaks than the former. The exact dynamics in any population will depend on the fraction of the population that is vaccinated at birth.
In contrast, when vaccination is higher than the herd immunity threshold, the endemic state is disease free, but occasional introductions of cases result in short chains of transmission and sporadic outbreaks [Reference Blumberg6]. If vaccination is maintainted at high levels, then these sporadic outbreaks are unlikely to persist. In the time between these sporadic outbreaks, unvaccinated susceptible individuals will age, leading to a progressive increase in the mean age of the susceptible population [Reference McLean and Anderson24]. This shift in the size and age distribution of the susceptible population over time following the introduction of vaccination leads to a transient regimen between the endemic and disease-free equilibrium during which outbreak risk, the expected size of an outbreak, and the age distribution of the susceptible population at risk are dynamic in time.
In this study, we systematically characterize the dynamics of the susceptible population, and the resulting outbreak risk, following the introduction of routine vaccination at the herd immunity threshold. With a simple age-structured stochastic SIR model under routine vaccination, we show how this transient risk, measured in terms of the effective reproduction rate (R E ), is sensitive to the vaccination history prior to the threshold level. We also consider how the historical incidence pattern, prior to the threshold vaccination level, impacts the transient risk and identifies regimens in which resurgent outbreaks are more likely. Finally, we demonstrate how supplementary immunization along with a routine programme might help to reduce the risk.
As many countries, especially developing countries, have stated measles elimination goals in the next few years [Reference Orenstein25–Reference Orenstein and Gay27], understanding the dynamics and relevance of post-vaccination risk is critical to the goal of maintaining elimination once it is achieved. With the recent acceleration of routine immunization programmes in many developing countries, such post-honeymoon period outbreaks may be expected. While these outbreaks do not necessarily imply programme failure, we should seek strategies that minimize the likelihood and severity of these outbreaks.
METHODS
We investigate a simple SIR model including an additional compartment of maternally protected newborns [Reference Anderson and May28]. The model has been extended to include an explicit age structure using partial differential equations according to a standard method [Reference Castillo-Chavez29]. This allows us to model age-dependent mixing, which has been shown to be an important characteristic of measles epidemiology, especially in developed countries [Reference McLean21–Reference Scherer and McLean23, Reference Anderson and May28, Reference McLean30]. In simulation, we split the population into different age groups: 0–1, 2–4, 5–9, 10–14, 15–19, …, 30–34, ⩾35 years, and the contact pattern (WAIFW matrix) in these age groups has been adopted from POLYMOD studies. In the main text we have used the contact pattern from Belgium derived from the average number of contacts recorded each day per survey participant [Reference Mossong31] (Fig. 1; contact patterns from other countries and the contact pattern proposed by Fumanelli et al. [Reference Fumanelli32] are presented in the Supplementary material). We also assume the transmission is seasonally forced (sinusoidal) with a 1-year period. Details of the model equations can be found in Appendix A. Briefly, the equations describe the transmission of infection from infectious to susceptible individuals in a population subject to demographic processes (birth and death) and a routine single-dose vaccination following the 0–1 year age group. We also assume that the vaccine provides lifelong immunity.
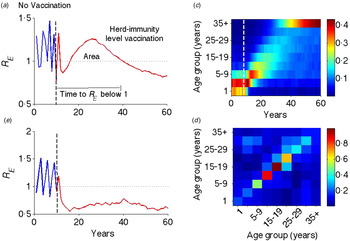
Fig. 1. Illustration of transient risk. (a) The graph is the effective reproductive rate (R E ) in the absence (blue: first 10 years) and presence (red: last 50 years) of critical-level vaccination (separated by a vertical dotted line). (b) Effective reproduction rate in the above setting, but with a flat contact matrix. (c) Distribution of susceptible population from the last cohort of unvaccinated individuals. (d) Age-structured WAIFW matrix used in this and all other simulations. The WAIFW matrix was adopted from POLYMOD studies (all reported contacts in the country Belgium consisting of the average number of contact persons recorded per day per survey participant) [Reference Mossong31]. The same illustrative risk trajectory is shown for other types of contact matrices (Supplementary Fig. S1).
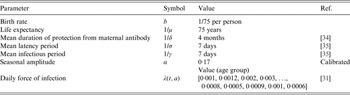
Here, we explore a stochastic analogue to the SIR model, which assumes the same intrinsic processes as the above deterministic model, but is event driven [Reference Gillespie33] (the algorithm for the process is described in detail in Appendix B). The demographic parameters are taken to be representative of a developed country assuming a type I mortality profile of the population with mean life expectancy of ~75 years; although we explore sensitivity to this assumption by considering scenarios with expanding and declining populations. We consider the birth rate as 1/75 per person per year. Other epidemiological parameters used for classical unvaccinated measles cases in the model are shown in Table 1 and correspond to those found in the literature [Reference Anderson and May28, Reference Mossong31, Reference McKee, Ferrari and Shea34, Reference Mossong and Muller35]. We scale the transmission coefficient β such that the force of infection corresponds to those observed in a developed region such as England and Wales prior to the introduction of vaccines [Reference Earn36]. We also assume case importation at a very low rate to prevent stochastic extinction prior to introduction of vaccination.
Table 1. Epidemiological parameters
In the baseline scenario, we study the predicted dynamics of vaccination by simulating the model for 120 years, implementing the critical-level vaccination, defined as the minimum vaccination coverage for which the endemic equilibrium is disease free, at the end of 70th year. Following the introduction of critical-level vaccination, we assume that local infection becomes extinct and the susceptible population progresses through birth, death, routine vaccination, and ageing. At each time point, we use the next-generation method [Reference Heffernan, Smith and Wahl37] to calculate the effective reproductive rate R E to measure the transient risk. Essentially, at each time point, we compute the matrix F as a proportion of new infections from each age group and also matrix V as the proportion of individuals transferring out due to recovery, ageing and death from respective compartments. The R E is taken as the spectral radius (largest eigenvalue) of the product matrix FV −1. Detailed computation of R E is given in the Supplementary material. By assuming local extinction, we are also able to isolate the contribution of deterministic, demographic processes to the transient dynamics of R E .
We then characterize the transient dynamics following the introduction of vaccination in three ways: (i) the area enclosed by the effective reproduction rate (R E ) curve >1, and (ii) the duration of time until R E equilibrates to the subcritical level (i.e. R E <1) following implementation of vaccination, and (iii) the expected epidemic size when R E remains >1. For the latter metric, we simulate a deterministic version of the SIR model described above, assuming an introduction of infection at each time point for which R E >1, we then average the resulting epidemics' size over all simulated epidemics. We choose these three as metrics, because these are sensitive to both the rate and the year vaccination is implemented. To evaluate the impact of a period of sub-critical vaccination prior to achieving the critical vaccination threshold, we ran the model for 70 years assuming no vaccination, then with an intermediate vaccination coverage for 30 years, and finally, simulated for another 50 years with herd-immunity-level vaccination.
We further explore the impact of temporary periods of elevated vaccination, targeting children aged <1 year, 5 years, or 10 years, on the metrics of transient risk. For each age-targeted scenario, we consider periods of elevated vaccination ranging from 1 to 10 years.
RESULTS
Following the introduction of vaccination at the herd-immunity threshold, the effective reproduction rate R E progresses through a characteristic transient regimen before settling at an equilibrium value <1 (Fig. 1a ). Before vaccination, R E oscillates with an inter-epidemic period of ~2 years (R 0 = 18·34 with seasonal amplitude 0·17) – representing the usual measles dynamics in a developed country setting in the pre-vaccination era [Reference Earn36]. Once the vaccination is implemented at the critical-level (here 94·55% for this parameter regimen), R E goes to <1 for a few years, but rebounds to relatively high values before finally declining to a subcritical value <1. This is analogous to the ‘honeymoon period’ as discussed by McLean and colleagues [Reference McLean21–Reference Scherer and McLean23]. That previous work, however, was done in the context of sub-critical vaccination and illustrated that a new cyclic epidemic pattern emerges after a short-term period of low incidence or disease absence [Reference McLean21, Reference Scherer and McLean23]. We here show that even after critical-level vaccination, R E is expected to transit through a regimen >1, which is a result of an interaction between the demographic progression of the susceptible population and the age-specific contact structure. The introduction of routine vaccination results in a perturbation that shifts the age distribution of the susceptible population from the last cohorts of unvaccinated children (Fig. 1c ); as the mode of the susceptible age distribution passes through a high-contact region in the WAIFW matrix (Fig. 1d ), this produces an increase in R E . The high R E indicates a period of risk for large epidemics and we define this phenomenon as transient risk in post-herd-immunity-level vaccination. Similar patterns of transient risk are seen under different contact matrices (Supplementary Fig. S1). The exact pattern depends on the contact matrix and the state of the system at the time of vaccine introduction. The same resurgence, however, is not seen when the contact matrix is constant (Fig. 1b ), indicating that this phenomenon results from the interaction of age-specific mixing and the demographic progression of the susceptible population.
In most places, routine vaccination programmes develop gradually, with a long period of sub-critical vaccination prior to achieving the critical herd immunity target. Although the trajectory from introduction to herd immunity will be specific to any given country, we consider the simplified setting in which the critical herd-immunity threshold is achieved following an intermediate period of sub-critical vaccination coverage. We consider five different intermediate coverages between 70% and 90% and these are implemented for 30 years prior to critical-level vaccine introduction. The trajectory of R E following the introduction of the herd-immunity level of vaccination depends on the value of R E at the time that the critical vaccination threshold is attained. That is, the initial conditions – size and age distribution – of the susceptible population at the time the critical vaccination threshold is attained will affect the magnitude of the transient risk. As the underlying model is stochastic, the state of the susceptible population when critical vaccination threshold is attained may be variable. For example, R E would be small and the susceptible population will be small following a recent outbreak, whereas following a period of relative measles absence, the susceptible population and R E would be relatively large. To account for this variation, we ran 100 stochastic realizations of the vaccination scenarios and plotted the measures of the transient risk as a function of the R E at the time the critical vaccination threshold was attained. In general, the transient risk, regardless of measure, increases with the value of R E at the time of introduction and decreases with the level of intermediate coverage (Fig. 2). The former occurs because a high R E implies a lack of recent outbreaks, thus a relatively large number of young susceptible individuals that can age through the high-contact portion of the age distribution following the introduction of the critical vaccination threshold. The latter occurs because higher intermediate vaccine coverage reduces the number of young susceptible individuals that will age through the high-contact portion of the age distribution following the introduction of the critical vaccination threshold. The area of transient increase in R E and the epidemic risk [Fig. 2 (top and bottom rows), Supplementary Figure S2(a, c)] follows a similar pattern. In contrast, the duration of risk in Figure 2 (middle row) (and Supplementary Fig. S2b) does not show the same level of variability, because duration of risk depends on the demographics of susceptible birth and death and the age of the high-contact region of the WAIFW matrix, which is constant in all simulations. Thus, the magnitude of epidemic risk, which measures the outbreak potential conditional on reintroduction is driven primarily by the height of the resurgence of R E , as the duration of the resurgence is largely constrained by the demographic rates.
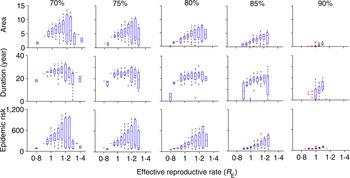
Fig. 2. Risk for five different values of intermediate vaccination coverage: 70%, 75%, 80%, 85%, 90%. The top row denotes area, the middle row describes duration (year), and the bottom row indicates the epidemic size while R E remains >1 for different values of intermediate vaccination coverage. The x-axis denotes the R E values when vaccination coverage switches from intermediate coverage to critical coverage (all figures have the same scale as indicated at the bottom x-axes). In each scenario, we have 100 replicates of a stochastic run of the model. Both area and duration decrease with increase in intermediate vaccination coverage. For detailed description of the figure, see the main text.
The previous simulations assumed that the population size was static (i.e. birth and death rates are equal). Populations that are growing or declining over time will have different rates of susceptible replacement. As shown in Supplementary Figure S3a, the transient risk is much smaller in growing populations in terms of both area and duration where R E >1, and also less variable. In contrast, both area and duration for R E > 1 are considerably higher and are variable in populations that are declining. In a growing population, susceptible individuals are rapidly replaced by new vaccinated individuals in the post-vaccination regimen; thus the overall proportion immune increases rapidly leading to a shorter duration with R E > 1 and lower risk overall. In a declining population (Supplementary Figure S3b), immunized individuals are recruited slowly and it even takes longer than usual to replace the susceptible pool. This implies that countries with declining populations are more likely to be exposed to high-risk periods for resurgent outbreaks.
The resurgence in R E and type of transient risks strongly depend on the actual number of susceptible individuals during the time of vaccine introduction, as this determines how many susceptible individuals remain unvaccinated in the last cohort. For example, increasing the rate of routine vaccination to the critical herd-immunity level when the susceptible population is large results in a different transient dynamic than doing so after an outbreak, when the susceptible population is small. Before an outbreak, the number of susceptible individuals is large, so achieving subcritical level of R E is difficult with a routine strategy that only immunizes newly born individuals; by contrast, increasing vaccination following an outbreak, when most individuals in the population already have immunity due to recent outbreak results in a much lower transient risk. We can characterize four different typical classes of transient phenomenon for R E (Fig. 3a ). For example, if R E <1 when critical-level vaccination is introduced, it may drop below 1 immediately following the introduction of critical-level vaccination, but rebounds after a short period of time by going >1, and then again settles to a value <1 within few years (Fig. 3a , cyan); or it may remain <1 forever (Fig. 3a , magenta), this phenomenon depends on the nonlinear momentum in the dynamic process of the disease. In contrast, if R E is >1 following implementation of vaccine, depending on R E value, it remains >1 for quite a long time before it equilibrates to some point <1 (Fig. 3a , grey and yellow). Notably, in two of these profiles (yellow and cyan), R E first declines, then increases after 15–20 years, indicating a period of low risk, followed by a period of resurgent risk. The former, low-risk period, may in fact have R E <1 because local stochastic fade-out of infection would be highly likely, but is then followed by a period of R E >1 during which a reintroduction would be likely to result in a large resurgent outbreak.
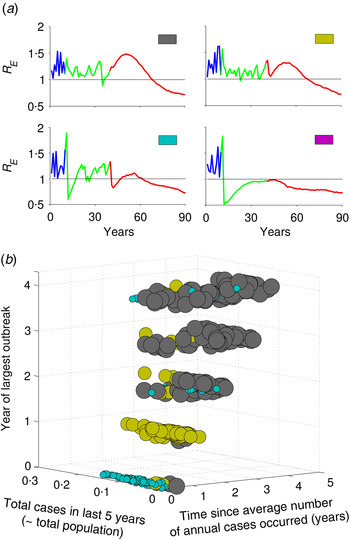
Fig. 3. Characterization of types of risk based on incidence history prior to vaccine introduction. (a) Four types of transient risk profile depending on value of R E at the time of vaccine introduction. (b) Mapping the risk profiles as a function of the three metrics defined in the text, out of all 1000 realizations of stochastic simulations of the model. Colours in panel (b) correspond to the four motifs in panel (a) and the size of the dots is in order to make them more apparent. The intermediate vaccination coverage is 70%.
Keeping track of the actual number of susceptible individuals, or the local value of R E , in a population is challenging in practical sense. To explore an operational classification of resurgent risk, we characterize the different risk profiles based on three measurable patterns of measles incidence in the 5 years prior to vaccine introduction. We define year ‘0’ as the year of vaccination and the prior years as 1, 2, 3 and 4 years before introduction. In this last 5-year period, we consider: (i) the total cases, (ii) the time since the annual number of cases has equalled or exceeded the pre-vaccine annual mean case-load, and (iii) the year of largest outbreak. Figure 3b summarizes the distribution of risk profiles from 1000 stochastic replicates of the model as a function of these three measures. Resurgence of R E followed by short honeymoon period with R E <1 (cyan) is more likely when the largest outbreak and year since mean case-load occur just prior to the introduction of herd-immunity level vaccination. In this setting, the population has relatively few susceptible individuals at the introduction of the critical level and there is only a small cohort of recently born individuals who are protected by herd immunity that age through the high-contact portion of the contact distribution after 15 years. If there have been few recent cases prior to the introduction of herd immunity vaccination (yellow), then the introduction of herd-immunity level vaccination does not drive R E <1 immediately and there is a similar resurgence of R E over a period of 15–20 years as the last cohorts prior to vaccination age through the high-contact age groups. If infection and outbreaks have been very rare prior to the introduction of herd immunity vaccination (grey), then R E initially increases as the susceptible population ages gradually, followed by a gradual decline to the post-vaccination equilibrium as susceptible individuals are replaced by newly vaccinated cohorts. As vaccination coverage during the intermediate period prior to the critical level increases, we get more subcritical risk profiles (magenta, Supplementary Fig. S4). In the higher intermediate coverage scenario, there are always fewer young susceptible individuals who age through high-contact regions, and thus R E always remains at a subcritical level following critical-level vaccination.
These patterns of transient risk depend critically on the size and age distribution of the susceptible population at the time when critical-level vaccination is introduced. A common strategy, in practice, is to introduce a pulsed supplemental campaign in conjunction with the increase in routine vaccination in order to ‘catch up’ those susceptible individuals too old for routine vaccination. We consider three different scenarios for age-targeted supplementary strategies, where we implement supplementary vaccination for 1–10 years, targeting: (i) only 0–1 year age group, (ii) 0–5 years age group, and (iii) 0–10 years age group, in addition to the routine programme. Supplemental vaccination of older age groups has substantial impact in reducing the risk in terms of both area and duration (Fig. 4). It also considerably increases the probability that R E will become subcritical (i.e. <1) by providing immunity to the those unvaccinated individuals in the last cohort since critical-level vaccination. Notably, 1 year of supplemental vaccination, targeting a wide age group (0–10 years), results in a larger reduction of risk than 10 years of continued supplemental vaccination targeting children aged 1 year or <5 years (Fig. 4).
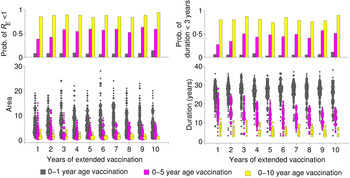
Fig. 4. Effect of extended vaccination coverage. Pulsed vaccinations are performed in conjunction with routine immunization. We vaccinated (i) 0–1 year age group, (ii) 0–5 years age group, and (iii) 0–10 years age group, and compared several periods from 1 to 10 years. The lower panels illustrate the area and duration where R E >1 for these three strategies. The upper panels describe the probability of R E remaining <1 (top left panel), and low duration (<3 years) with R E >1 out of a total of 1000 replicates in each scenario. Colours indicate the vaccination age groups targeted by extended vaccination and the size of the points in the lower panels indicate the number of simulations within a given area or duration.
DISCUSSION
Using an age-structured stochastic, albeit simple, model of measles vaccination dynamics, we illustrate that while critical-level vaccination through routine immunization programmes does lead to an endemic disease-free state, there may be a long period of transient, or even resurgent, risk prior to reaching that equilibrium. In particular, the interaction of the demography of the susceptible population with age-structured contact processes can result in conditions that permit large outbreaks within a few years of vaccine introduction. The amount of risk varies by an order of magnitude depending on intermediate vaccination coverage level. Our analysis also reveals that regions with a declining population, such as Eastern and Western European countries, may be particularly susceptible to long periods of transient risk prior to achieving a disease-free state.
The important practical point is that the marked short-term reduction of measles incidence followed by significant risk of potential outbreak does not necessarily means a programme failure; rather this is a natural consequence of the large fraction of susceptible population from the last cohort that remains unvaccinated after the start of mass vaccination. Keeping track of detailed age-specific susceptibility to quantify the risk of resurgence in a population might be an impossible task in a practical sense. However, we show that the transient dynamics following vaccine introduction follow consistent patterns related to the epidemic history just prior to vaccine introduction. These results point to the fact that effectiveness of control programmes is greatly enhanced by the collection of detailed serological, demographics, and case reports prior to the introduction of control measures.
Elimination of measles requires maintenance of the effective reproductive rate below 1 by achieving and maintaining high levels of immunity, and so a key component in the elimination programme is to manage the residual level of susceptibility of a cohort after it has completed its scheduled vaccination opportunities [Reference Anderson and May28]. This implies that designing an elimination programme for a particular population involves setting target levels of susceptibility, establishing the current susceptibility profile, selecting an approach to reduce susceptibility below the target, and selecting an approach to maintain susceptibility below the target [Reference Orenstein and Gay27, Reference Simons38]. We show that supplemental vaccination campaigns, in tandem with a routine immunization programme, even for few years can greatly improve the situation. Catching up more older age groups in the supplemental campaign greatly reduces the probability of resurgent outbreaks. These catch-up campaigns have shown substantial impact in reducing the disease burden in developing countries. For example, in southern Africa, Botswana, Malawi, Namibia, South Africa, Swaziland, and Zimbabwe have conducted catch-up campaigns that have resulted in substantial decreases in reported measles morbidity and mortality [Reference Minetti17, Reference Bishai39, Reference Uzicanin40]. These campaigns have classically been implemented as single, pulsed efforts instead of the multi-year supplementation that we have illustrated here. The resurgence of transient epidemic risk is a multi-year phenomenon; our results highlight, however, that the combination of high routine vaccination coverage and a single supplemental effort that is wide enough to include the unvaccinated cohorts can mitigate this transient risk.
Most of the WHO's Southeast Asia, European and African countries have committed to measles elimination by 2015 or 2020, and the challenge for regions embarking on measles elimination is to maintain high population immunity with excellent vaccination coverage [Reference Orenstein25, Reference Katz26, 41, Reference Andrus42]. However, measles is still one of the major causes of morbidity and mortality in children throughout the world [43]. Despite high-functioning routing vaccination systems, many countries have seen resurgent outbreaks following years of relatively low measles incidence [44]. For example, routine measles vaccine coverage in France since 2008 has been nearly 90%, although a large outbreak in 2011 resulted in ~14 900 measles cases, with a larger proportion of cases belonging to older age groups and primarily unvaccinated [Reference Antona13]. Similar scenarios were also observed in Brazil, Vietnam, and United States. Thus implementing and maintaining high coverage in routine childhood immunization programmes may be necessary, but not sufficient, in minimizing measles outbreak risk. Our analyses suggest an obvious need for more careful monitoring of the impacts of current immunization programmes on both the size and age distribution of susceptible populations and the interaction with age-specific contact processes. Here we have shown that predictable transient dynamics can lead to a resurgence of outbreak risk, although in practice these dynamics are likely to interact with demographic change and population movements in ways that could futher affect transmission rates and epidemic risk.
APPENDIX A. Model
We extended a simple SIR model with age-structured formulation. Let M, S, E, I, and R denote respectively, the proportion of maternally protected, susceptible, exposed, infected and recovered classes. We assume immunity is permanent. According to the simplified epidemiological life history described in the main text, the disease process can be described by following set of partial differential equations:
 $$\left. \eqalign{& \left\{ {\displaystyle{\partial \over {\partial t}} + \displaystyle{\partial \over {\partial a}}} \right\}M(t,a) = - (\mu (a) + \delta )M(t,a) \cr & \left\{ {\displaystyle{\partial \over {\partial t}} + \displaystyle{\partial \over {\partial a}}} \right\}S(t,a) = \delta M(t,a) - (\lambda (t,a) + \mu (a))S(t,a) \cr & \left\{ {\displaystyle{\partial \over {\partial t}} + \displaystyle{\partial \over {\partial a}}} \right\}E(t,a) = \lambda (t,a)S(t,a) - (\sigma + \mu (a))E(t,a), \cr & \left\{ {\displaystyle{\partial \over {\partial t}} + \displaystyle{\partial \over {\partial a}}} \right\}I(t,a) = \sigma E(t,a) - (\gamma + \mu (a))I(t,a), \cr & \left\{ {\displaystyle{\partial \over {\partial t}} + \displaystyle{\partial \over {\partial a}}} \right\}R(t,a) = \gamma I(t,a) - \mu (a)R(t,a),} \right\}$$
where the boundary conditions
 $$\left.\eqalign{& M(t,0) = \int_{_0} ^\infty bIm(t,a){\rm d}a, \cr & S(t,0) = \int_{_0} ^\infty bS(t,a){\rm d}a,} \right\}$$
where $Im(t,a)$
denote the immune population of age a at time t either from natural infection or vaccinated, and b is the birth rate. Equation (2) states that all newborns from immune individuals are initially protected from maternal antibody, while new births from the susceptible population are still susceptible. This different formulation of population recruitment allows us to estimate the exact susceptible pool at a given time point. The initial population size is considered as 100 000. Detailed parameter descriptions and values are given in Table 1.
$Im(t,a)$
denote the immune population of age a at time t either from natural infection or vaccinated, and b is the birth rate. Equation (2) states that all newborns from immune individuals are initially protected from maternal antibody, while new births from the susceptible population are still susceptible. This different formulation of population recruitment allows us to estimate the exact susceptible pool at a given time point. The initial population size is considered as 100 000. Detailed parameter descriptions and values are given in Table 1.
The age-dependent force of infection at cohort a and time t is given by
 $$\lambda (t,a) = \displaystyle{{\int_{_0} ^\infty \beta (t,a,\alpha )I(t,a){\rm d}\alpha} \over {\int_{_0} ^\infty N(a){\rm d}\alpha}}, $$
where $\beta (t,a,\alpha )$
is the age-dependent contact matrix. The inclusion of total population in the denominator of the definition of force of infection supports the assumption that force of infection is not affected by population growth. The transmission is seasonally forced with sinusoidal forcing of the period 1 year.
$\beta (t,a,\alpha )$
is the age-dependent contact matrix. The inclusion of total population in the denominator of the definition of force of infection supports the assumption that force of infection is not affected by population growth. The transmission is seasonally forced with sinusoidal forcing of the period 1 year.
Vaccination is implemented by transferring children who reach 1 year of age both in M and S classes directly to the recovered class R according to vaccine coverage level.
APPENDIX B. Implementation as stochastic system
The entire model given by (1) has been implemented as a stochastic system using a tau-leap algorithm. Tau-leap is an approximate method (of the Gillespie algorithm) for the simulation of a stochastic system. It performs all reactions for an interval of length τ before updating the propensity functions. The unit for time step of the simulation is day. Here, all demographic process (i.e. birth, death, ageing) and disease process (i.e. transmission, recovery, maternal antibody decay, vaccination) in the deterministic model (1) are assumed to be event-driven. The algorithm is as follows: ${\rm let}\,x(t) = \{ X_{_{ij}} (t)\}, i = \,{\rm age \; group},$
j = disease compartment be the complete list of variables in terms of all age groups and disease compartments. Let E
k
be the list of events that occurs at the rate
${\rm let}\,x(t) = \{ X_{_{ij}} (t)\}, i = \,{\rm age \; group},$
j = disease compartment be the complete list of variables in terms of all age groups and disease compartments. Let E
k
be the list of events that occurs at the rate $R_{_k} (x(t))$
(most of our reactions are density dependent) and with state change matrix M
ij
. First, we initialize the model with initial condition
$R_{_k} (x(t))$
(most of our reactions are density dependent) and with state change matrix M
ij
. First, we initialize the model with initial condition $x(t_0 ) = \{ X_{_{ij}} (t_0 )\} $
and then calculate the event rates
$x(t_0 ) = \{ X_{_{ij}} (t_0 )\} $
and then calculate the event rates $R_{_k} (x(t))$
. We choose a fixed time step, i.e. τ = 1. For each event E
k
, we then generate
$R_{_k} (x(t))$
. We choose a fixed time step, i.e. τ = 1. For each event E
k
, we then generate $\xi _{_k} {\rm \colon}\; {\rm Poisson}(R_{_k} \tau )$
, which is the number of times each event occurs during the time interval [t, t + τ). Finally, we update the state by
$\xi _{_k} {\rm \colon}\; {\rm Poisson}(R_{_k} \tau )$
, which is the number of times each event occurs during the time interval [t, t + τ). Finally, we update the state by $x(t + \tau ) = x(t) + \sum\nolimits_k \xi _{_k} M_{ij} $
.
$x(t + \tau ) = x(t) + \sum\nolimits_k \xi _{_k} M_{ij} $
.
SUPPLEMENTARY MATERIAL
For supplementary material accompanying this paper visit http://dx.doi.org/10.1017/S0950268816002016.
ACKNOWLEDGEMENTS
The authors acknowledge the support from Bill and Melinda Gates Foundation.
DECLARATION OF INTEREST
None.


