


Impact Statement
The weather and climate system of a country have great impact on its local business and agriculture. Hence, it is utmost important to have local-scale projections of the climate variables. In India, the summer monsoon rainfall (ISMR) plays a vital role in agricultural productivity and well-being of people. However, this rainfall is not uniform throughout the country. Thus, it is significant to understand, analyze, and forecast the spatial variability of the Indian monsoon rainfall and find out the local-scale projections of this rainfall. In this proposed method, we have attempted to make high-resolution (HR) projections of ISMR from the low-resolution (LR) data through a deep downscaling technique. We have used historical climate observations to learn a LR to HR mapping with the help of residual networks, with a scaling factor of 4. The proposed model has multiple residual blocks and skip connections between similar kinds of convolutional layers. The proposed model uses bilinear interpolated input to produce the required output. It is found that the residual structure of the model helps to overcome the problems associated with stacking the super-resolution convolution neural networks. The results obtained by the proposed model are compared with the existing models, and it is found that the proposed model performs better than the existing models.
1. Introduction
India is primarily an agriculture-based economy, where much of the irrigation is based on rainfall. Farmers plan their crop calendars based on forecasts of rainfall. Hence, making short-term rainfall forecasts at localized spatial scales is very important. However, India has a diverse weather and climate system due to its physical features. Therefore, the task of accurate weather forecasts is extremely complex and challenging in this region. Due to the complexity of the atmospheric processes, physical process models including dynamical and numerical models are unable to predict rainfall with sufficient accuracy, and they are also computationally expensive. An alternative is statistical modeling, but they generally do not work well at high resolutions. To get local projections at high resolutions, downscaling methods are used on the low-resolution (LR) projections obtained from global or regional models for weather prediction or simulation. Downscaling techniques are used to get climate projections at finer spatial scales (Burger, Reference Burger1996). These methods are also used to predict the monsoon streamflow at river basin (Ghosh and Mujumdar, Reference Ghosh and Mujumdar2008) and cyclonic storms (Kaur et al., Reference Kaur, Krishna, Joseph, Dey, Mandal, Chattopadhyay, Sahai, Mukhopadhyay and Abhilash2020).
Broadly, there are two classes of techniques used for downscaling, that is, statistical and dynamical downscaling. The dynamical downscaling uses partial differential equation-based regional climate models (RCMs) that use boundary conditions of coarse resolution global circulation models (GCMs) for its operation (Tiwari et al., Reference Tiwari, Kar, Mohanty, Dey, Sinha, Shekhar and Sokhi2018). The RCMs are sensitive to their boundary conditions and have a high computational requirement that limits the use of multi-model and multi-initial condition ensembles for reliable projections. On the other hand, statistical downscaling (SD) aims to learn a statistical relationship between LR and high-resolution (HR) observations of climate variables and it helps to get reliable local-scale projections.
SD has a rich and expansive history in the field of climate informatics. Most of the earlier SD are regression-based techniques (Rummukainen, Reference Rummukainen1997; Tiwari et al., Reference Tiwari, Kar, Mohanty, Dey, Sinha, Shekhar and Sokhi2018). One such approach is the automated statistical downscaling (ASD) which presents a traditional framework for downscaling (Hessami et al., Reference Hessami, Gachon, Ouarda and St-Hilaire2008). In ASD, a classification model is first used to identify the rainy days and then a regression method is used to estimate the precipitation on a local scale for the rainy day. Another widely used approach is the bias correction spatial disaggregation method, which begins by bias correcting a GCM to match the distribution of the HR observed dataset followed by interpolation and spatial scaling to correct the local biases (Thrasher et al., Reference Thrasher, Maurer, McKellar and Duffy2012). Apart from the earlier regression-based models, some neural network-based models were also introduced in the downscaling procedure (Kumar et al., Reference Kumar, Chattopadhyay, Singh, Chaudhari, Kodari and Barve2021).
The task of SD is quite similar to that of the super-resolution (SR) approaches used for image resolution enhancement. Most of the SR approach uses convolutional neural networks (CNNs) to generate the HR images from LR data. Recently, some researchers have employed these SR techniques for SD (Kumar et al., Reference Kumar, Chattopadhyay, Singh, Chaudhari, Kodari and Barve2021).
In this study, we propose residual deep downscaling (ResDeepD)—a new residual-based model for deep downscaling to get fine-grained estimates of precipitation from the coarse-grained data of monsoon rainfall over India. This new model aims to improve the predictive capability of the stacked convolutional layers by introducing skip connections.
2. SR-Based Deep Downscaling
A variety of deep learning methods have been applied to tackle SR tasks on images. These methods range from the CNN-based method (Dong et al., Reference Dong, Loy, He, Tang, Fleet, Pajdla, Schiele and Tuytelaars2014) to the SR approaches using generative adversarial nets (GANs) (Ledig et al., Reference Ledig, Theis, Huszar, Caballero, Cunningham, Acosta, Aitken, Tejani, Totz, Wang and Shi2017). These methods differ from one another by their architecture, framework, loss function, and upsampling point (Wang et al., Reference Wang, Chen and Hoi2021). Based on the upsampling operation and their location in the model, there are different frameworks such as pre-upsampling SR (Dong et al., Reference Dong, Loy, He, Tang, Fleet, Pajdla, Schiele and Tuytelaars2014; Tai et al., Reference Tai, Yang and Liu2017), post-upsampling SR (Dong et al., Reference Dong, Loy, Tang, Leibe, Matas, Sebe and Welling2016; Shi et al., Reference Shi, Caballero, Huszar, Totz, Aitken, Bishop, Rueckert and Wang2016), progressive upsampling SR (Wang et al., Reference Wang, Perazzi, McWilliams, Sorkine-Hornung, Sorkine-Hornung and Schroers2018), and iterative up-and-down sampling SR (Haris et al., Reference Haris, Shakhnarovich and Ukita2018). Researchers have also employed different type of networks in SR task. Out of these networks, recursive network, residual network, and dense network are popular among the researchers (Huang et al., Reference Huang, Liu, Van Der Maaten and Weinberger2017; Wang et al., Reference Wang, Chen and Hoi2021).
Climate variables like precipitation are spatio-temporal by nature. The spatial distribution of such a variable is analogous to a single-channel image. Each pixel of the image corresponds to a location and its intensity to the value of the variable in question. Hence, we can treat the spatial distribution of coarse-grained precipitation data (climate variable) as LR image and its local-scale projections as HR image in the resolution enhancement task. In recent years, the adaption of deep learning-based SR techniques on the spatio-temporal climate variables gives rise to deep downscaling methods. The researchers (Vandal et al., Reference Vandal, Kodra, Ganguly, Michaelis, Nemani and Ganguly2017, Reference Vandal, Kodra, Ganguly, Michaelis, Nemani and Ganguly2018) have introduced the augmented stacked version of super-resolution convolutional neural network (SRCNN) (Dong et al., Reference Dong, Loy, He, Tang, Fleet, Pajdla, Schiele and Tuytelaars2014) to downscale the precipitation data. They have used the LR precipitation and HR topographic features as input to predict the HR precipitation. This approach is also used by Kumar et al. (Reference Kumar, Chattopadhyay, Singh, Chaudhari, Kodari and Barve2021) to downscale the Indian summer monsoon rainfall (ISMR) data. Researchers have also used UNet-based architectures (Sha et al., Reference Sha, Gagne, West and Stull2020) to perform SD. Some researchers have also used GAN-based SR models for downscaling of climate variables (Ji et al., Reference Ji, Zhi, Tian, Peng, Huo and Ji2020 and Singh et al., Reference Singh, Albert and White2019). To check the capability of neural networks to downscale different climate variables, Medina et al. (Reference Medina, Manzanas and Gutiérrez2020) have carried out a comparative analysis of deep neural networks to downscale the temperature and precipitation data over Europe. Vaughan et al. (Reference Vaughan, Tebbutt, Hosking and Turner2021) have also tried to downscale temperature and precipitation over Europe with the help of convolutional conditional neural processes. In recent findings, researchers have identified the usefulness of residual networks in image SR (Zhang et al., Reference Zhang, Lin and Sheng2019; Lan et al., Reference Lan, Sun, Liu, Lu, Su, Pang and Luo2021). These findings motivated us to use residual-based network in deep downscaling.
3. Dataset and Pre-processing
For this work, we have collected the daily precipitation data over India for the period 1990–2019 (only ISMR period, i.e., June–September). The data are collected from the climate data service portal of the India Meteorological Department. The ISMR daily precipitation data from 1990 to 2012 are used for training the models, and the data from 2013 to 2019 are used to test the models. We have used the precipitation data over the landmass of India at two different spatial resolutions. The LR data (Rajeevan et al., Reference Rajeevan, Bhate and Jaswal2008) which are in the spatial resolution of 10 × 10 are used as input to the model, and the 0.250 × 0.250 spatial resolution data (Pai et al., Reference Pai, Sridhar, Rajeevan, Sreejith, Satbhai and Mukhopadhyay2014) are used as ground truth for verification. The dimension (latitude × longitude) of the collected LR data is 33 × 35, and for HR data, it is 129 × 135. Since we are interested to downscale the precipitation in the mainland of India, we set the precipitation value outside the mainland to 0. We have also applied 0 padding across the borders of the data to make it a square matrix. With this padding, the shape of each LR data becomes 35 × 35 and the shape of each HR data became 140 × 140.
Apart from the precipitation data, we have also used the topographic information of India in one of the models. So we have collected the static topographic land elevation data of India from the Global 30 Arc-Second Elevation Dataset (GTOPO30) provided by the USGS. For DeepSD model, we have normalized both the precipitation and elevation data by MinMaxScaler method so that the values will lie in the range of 0–1.
4. Methodology
4.1. SRCNN
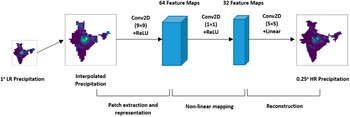
The SRCNN is a three-layer CNN architecture (Figure 1). It is designed to learn the functional mapping between the LR and the HR image. The three layers of the model are dedicated for three different operations. The first layer of this model is termed as patch extraction layer, and it is responsible for extracting overlapped patches from the input image, representing them as high dimensional vector. The next layer performs nonlinear mapping of the high dimensional vector to another high dimensional vector. The last layer of the model is the reconstruction layer that generates HR image by aggregating the high dimensional patches.
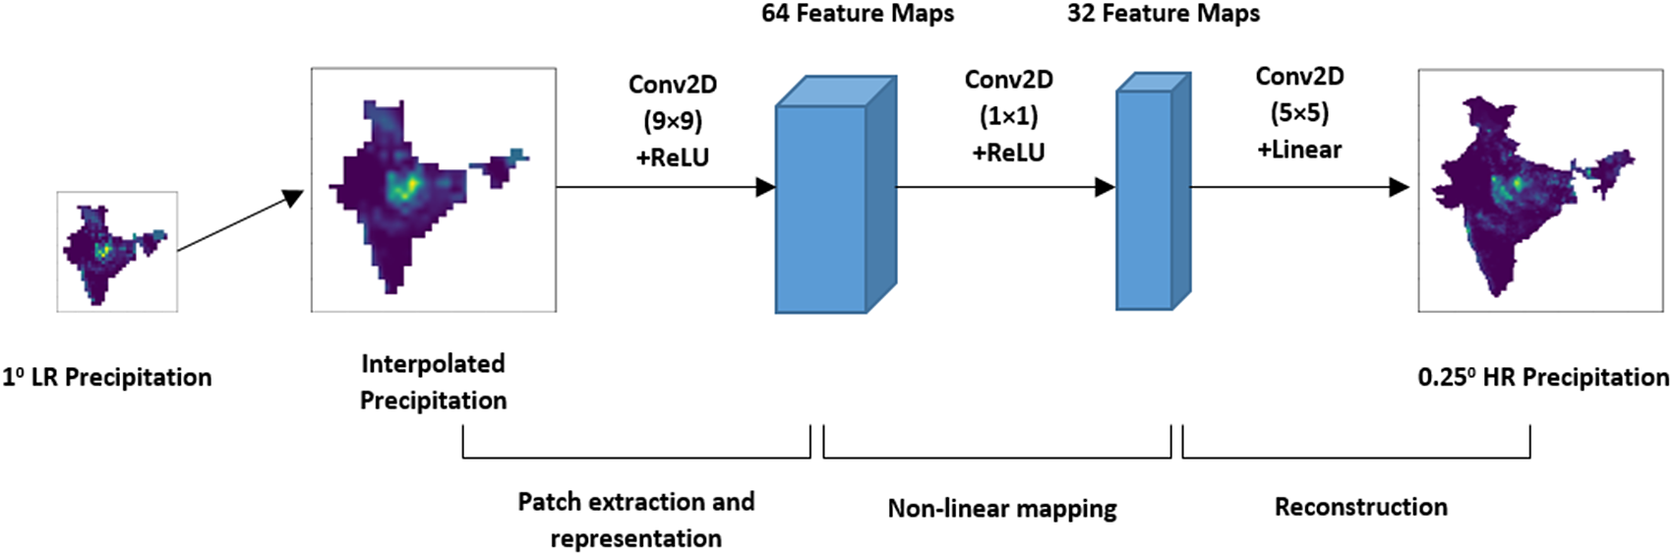
Figure 1. Layered structure of SRCNN model.
In the convolutional operation of SRCNN, the image size decreases depending on the filter size. Hence, the training labels are cropped to meet the required shape of the predicted output during training. Similarly, during testing the test LR images are padded with symmetric or replication padding before applying convolution operation on it. It ensures that the size of prediction corresponds to the ground truth size. In our implementation of the SRCNN, we have used the same architecture as suggested by Dong et al. (Reference Dong, Loy, He, Tang, Fleet, Pajdla, Schiele and Tuytelaars2014) and Vandal et al. (Reference Vandal, Kodra, Ganguly, Michaelis, Nemani and Ganguly2017). The first layer of the network has 64 filters with 9 × 9 kernels. The second uses 1 × 1 kernels to generate 32 feature maps, and the output layer uses a 5 × 5 kernel. The network is trained using Adam optimizer with a learning rate of 0.0001.
4.2. DeepSD
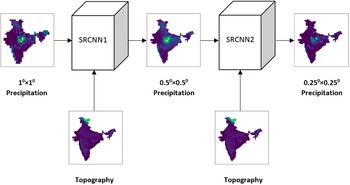
Another alternative approach to deep downscaling uses the DeepSD model (Vandal et al., Reference Vandal, Kodra, Ganguly, Michaelis, Nemani and Ganguly2017). It is an augmented stacked SRCNN model (Figure 2). Here, each SRCNN model is responsible to increase the resolution by a scaling factor of 2. The model takes LR precipitation and HR land elevation data as input to produce the HR precipitation data. We have employed two SRCNN models to create the DeepSD model. In DeepSD, each SRCNN is trained independently with its respective inputs and labels. The intermediate data (0.50 × 0.50) for this model are prepared by bilinear interpolation of the 0.250 × 0.250 HR data. The input precipitation for each SRCNN is prepared by bilinear interpolation of the respective LR precipitation data. Then, the corresponding land elevation matrix is appended to each precipitation sample to make it a two-channel input sample. Similarly, the labels are prepared by the HR precipitation data.
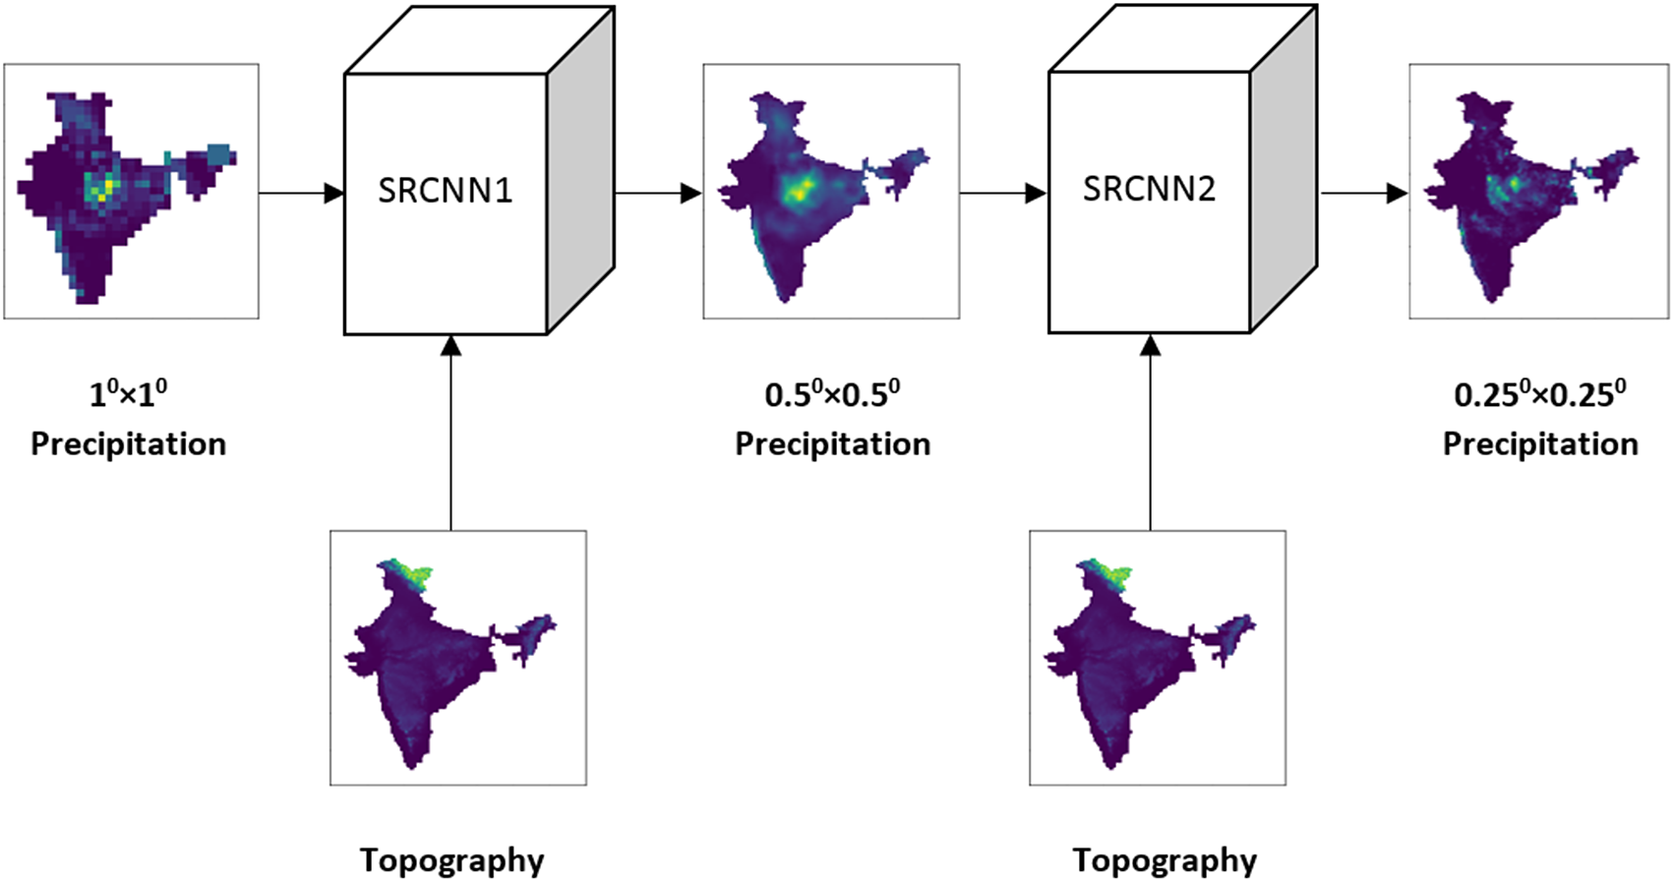
Figure 2. Downscaling with DeepSD model.
During testing, the models are stacked together. The LR test image along with its associated HR elevation is used to predict the first resolution enhancement. The next resolution enhancement is estimated from the previous layer’s estimate and its associated HR elevation. This method uses the progressive up-sampling approach.
4.3. Nest-UNet
The Nest-UNet is a UNet-based architecture proposed by Sha et al. (Reference Sha, Gagne, West and Stull2020) for SD. This network contains multiple convolutional blocks in a layer and has skip connections between them. It is a nested architecture of UNet. In our experiment, we have used it for a resolution enhancement (downscaling) by 4×. We set the number of hidden layer channel to [16,32,64] for the three stages/layers of the model, and we have used upsampling method in the expansive path. We set the last convolutional layer of Nest-UNet as a single-channel layer to get the final result. We have used LR precipitation as the single input for the model.
4.4. ResDeepD
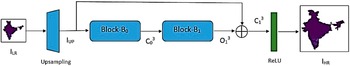
The proposed ResDeepD model is a pre-upsampled model and is comprised of two basic residual blocks with skip connections. This model takes LR precipitation data as input and enhances its resolution for a scaling factor of 4. The LR image is first upscaled to the same size as the HR image using bilinear interpolation. The architecture of the basic residual blocks used in this model is shown in Figure 3 and the proposed ResDeepD model is shown in Figure 4.
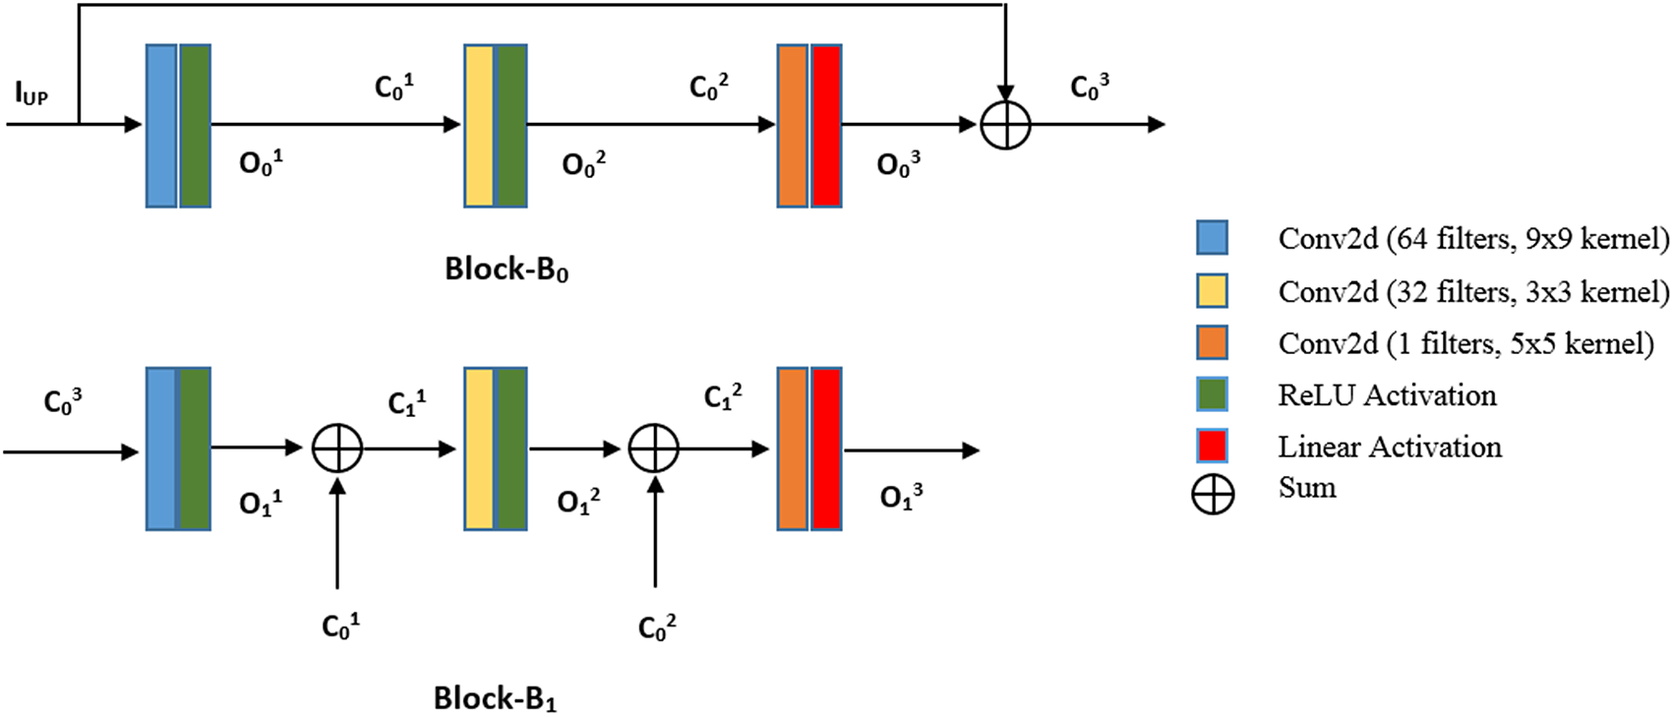
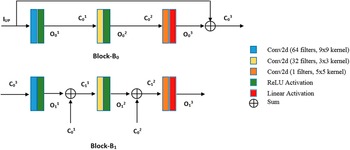
Figure 3. Basic residual blocks.
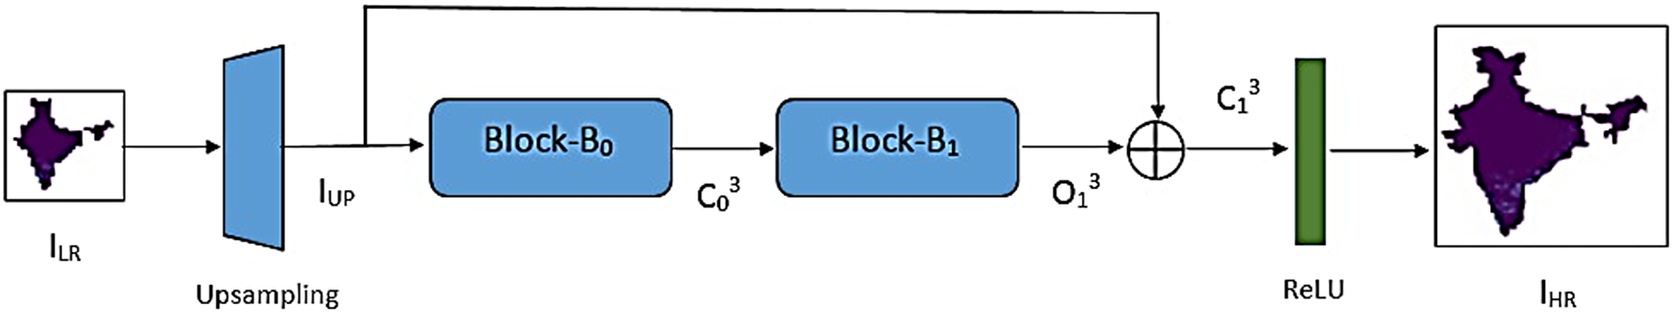
Figure 4. ResDeepD model architecture.
The first basic residual block of ResDeepD is Block-B0. This block contains three convolutional layers. The first two convolutional layers have ReLU activation, and the last layer has linear activation. Moreover, this block is quite similar to the SRCNN model, but it has an identity connection. The cumulative output of Block-B0 can be written as,
 $$ {C}_0^3\hskip0.35em =\hskip0.35em {O}_0^3+{I}_{UP} $$
where O03 is the output of the third convolutional layer with linear activation and IUP is the pre-upsampled input data. The O03 value can be treated as a function of the input IUP. Let the function that converts input IUP to output O03 be R0(IUP). Then, the cumulative output of this block can be represented as,
 $$ {C}_0^3\hskip0.35em =\hskip0.35em {R}_0\left({I}_{UP}\right)+{I}_{UP} $$
The second block of the network is Block-B1. The input of the first convolutional layer of Block-B1 is the cumulative output C03 of its previous block (Block-B0). Similarly, the input of other convolutional layers (layer-k) in Block-B1 is the cumulative output of its previous layer represented as C1k-1. Mathematically C1k-1 can be formulated as,
 $$ {C}_1^{k-1}\hskip0.35em =\hskip0.35em {O}_1^{k-1}+{C}_0^{k-1} $$
where O1k-1 is the output of layer-(k-1) in Block-B1 and C0k-1 is the cumulative output of layer-(k-1) in Block-B0.
In this model, the input image is first upsampled by bilinear interpolation, and then it is passed through the residual blocks. The output O13 of the last residual block is added with the upsampled input IUP to generate the cumulative output C13. This cumulative output is passed through a ReLU activation function to produce the final result. Mathematically, the final HR output (IHR) of this model can be represented as,
 $$ {I}_{HR}\hskip0.35em =\hskip0.35em \max \left({C}_1^3,0\right) $$
If U(x) represents the upsampling function and Bi(x) represents the input to output mapping of the ith residual block, then the above equation can be expressed in terms of the input ILR as,
 $$ {I}_{HR}\hskip0.35em =\hskip0.35em \max \left(\left({B}_1\left({B}_0\left(U\left({I}_{LR}\right)\right)\right)+U\left({I}_{LR}\right)\right),0\right) $$
5. Results and Discussion
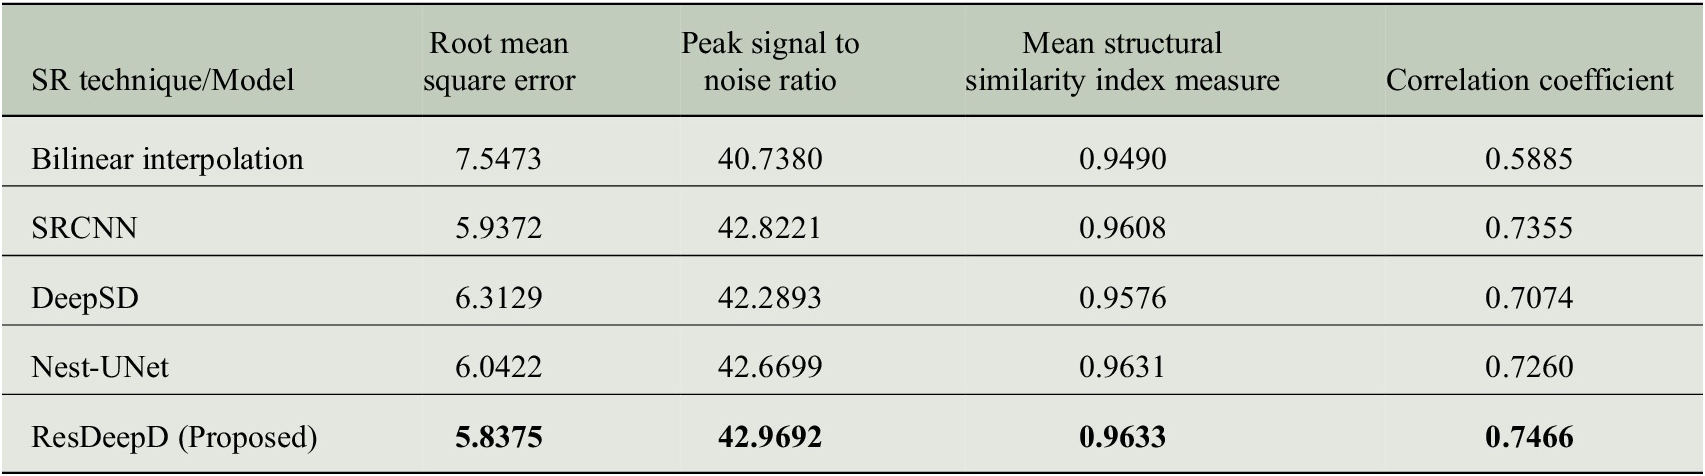
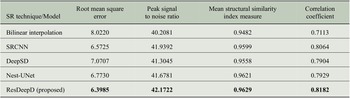
The models are trained and tested with the precipitation data, as mentioned in Section 3. The prediction results of these models are compared to check their ability to provide credible projections. We have used four measures to evaluate the model performance. These performance measures are selected from the domain of SD and image processing. We have used root mean square error, peak signal to noise ratio, mean structural similarity index measure, and correlation coefficient (R) as the performance evaluators.
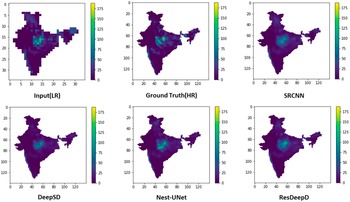
Before calculating the performance, we have masked the predicted results to concentrate on the Indian landmass only. The comparative analysis of these performance measures for different models is shown in Table 1. To visualize the model’s predictive capability, a sample plot of the predicted results for Indian landmass along with the input and ground truth is shown in Figure 5. The results show that the proposed ResDeepD model performs better than other downscaling approaches when the scaling factor is 4.
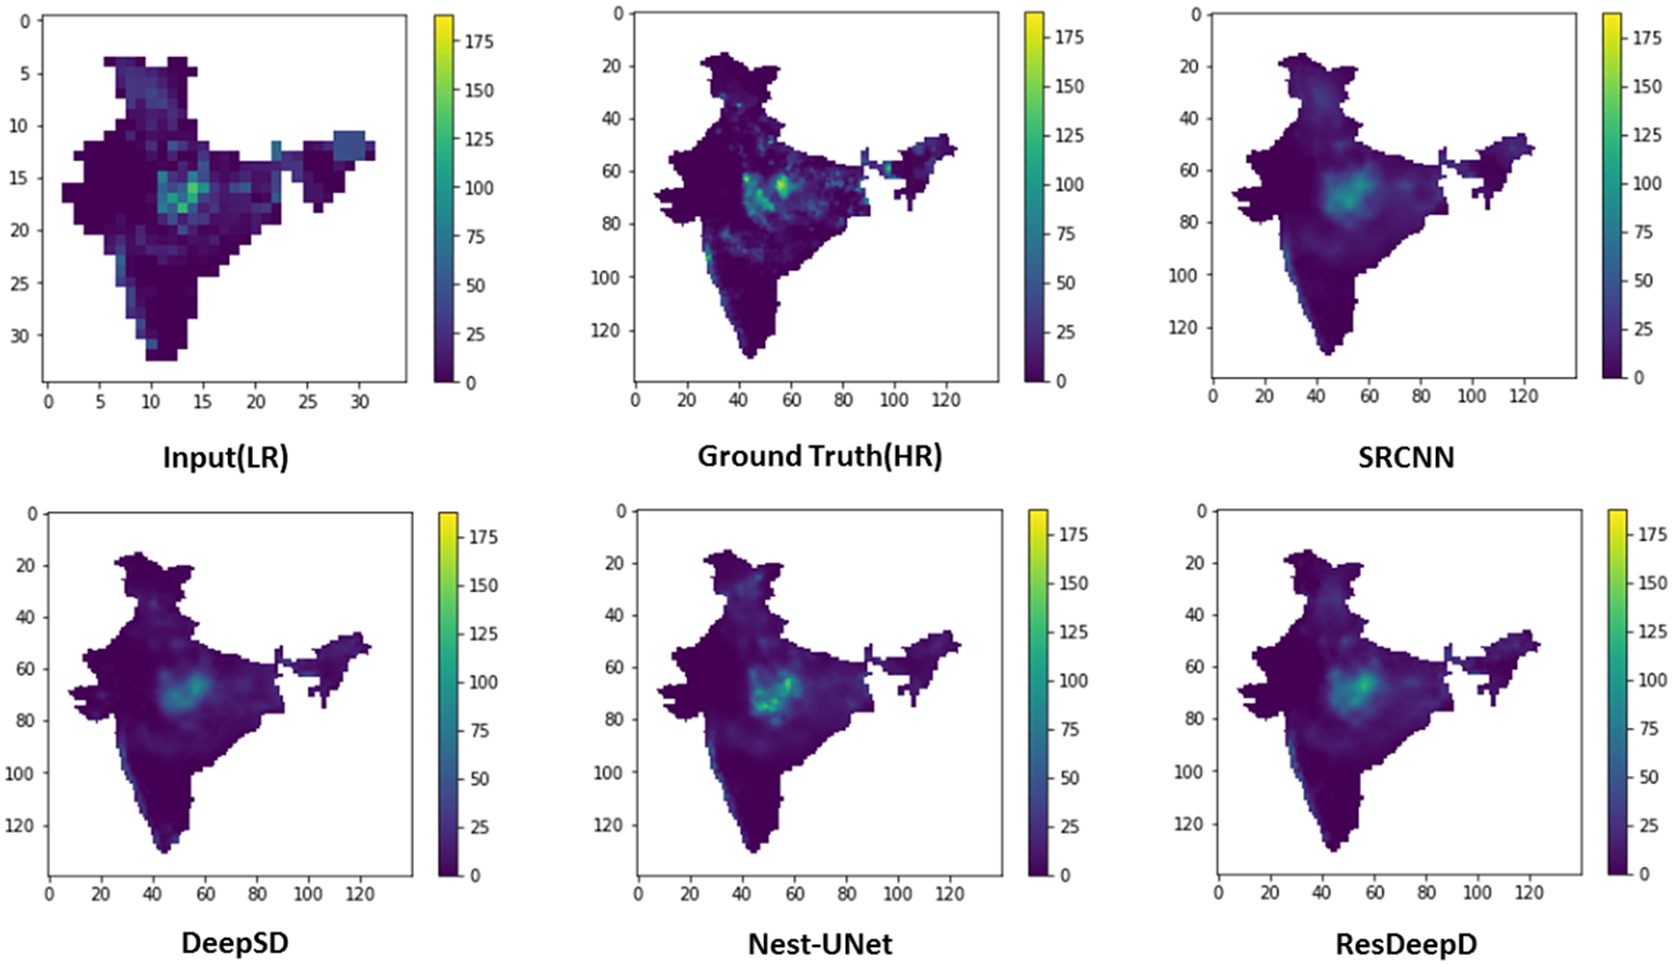
Figure 5. Plots showing predicted results along with the input and ground truth for a particular day (the color bar indicates amount of rainfall in mm.).
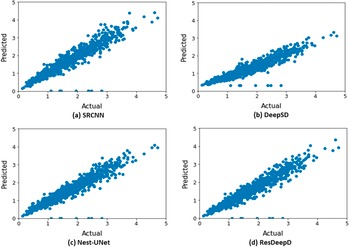
We have also analyzed the effect of downscaling on the daily mean rainfall across India through scatter plots (Figure 6). These plots indicate that the proposed pre-upsampled residual network has better prediction capability than the existing models.
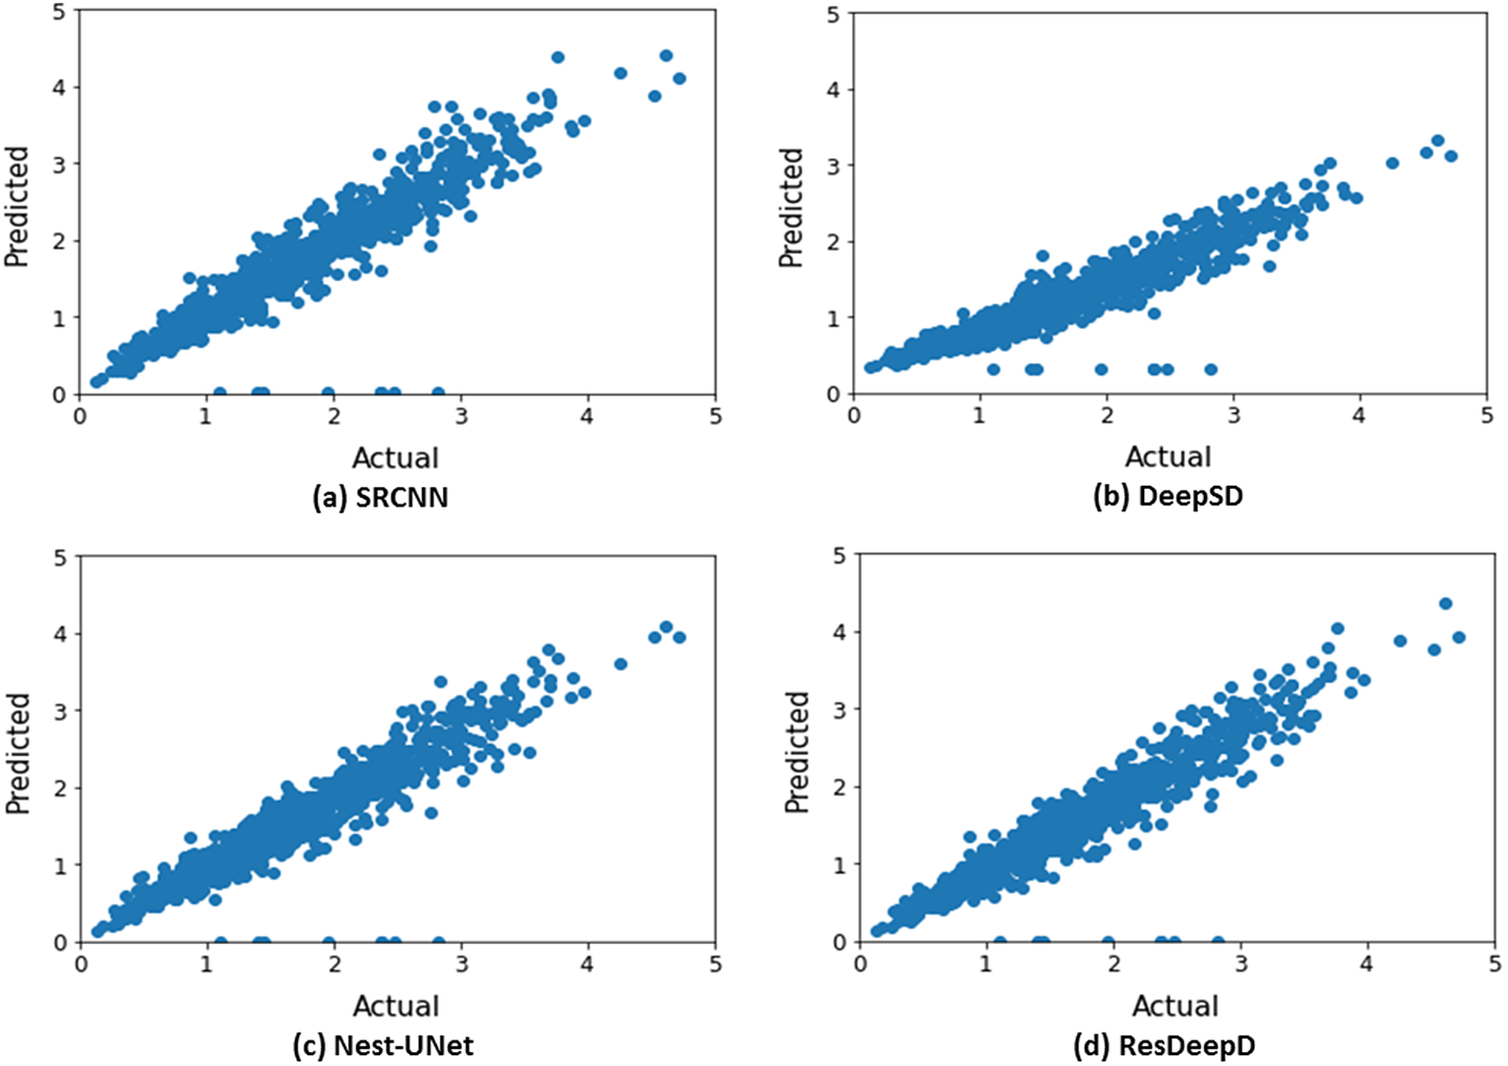
Figure 6. Actual versus predicted value of daily mean rainfall across India (in mm/HR grid) for the period 2013–2019 (only ISMR).
Table 1. Comparison of predictive ability between deep downscaling techniques.
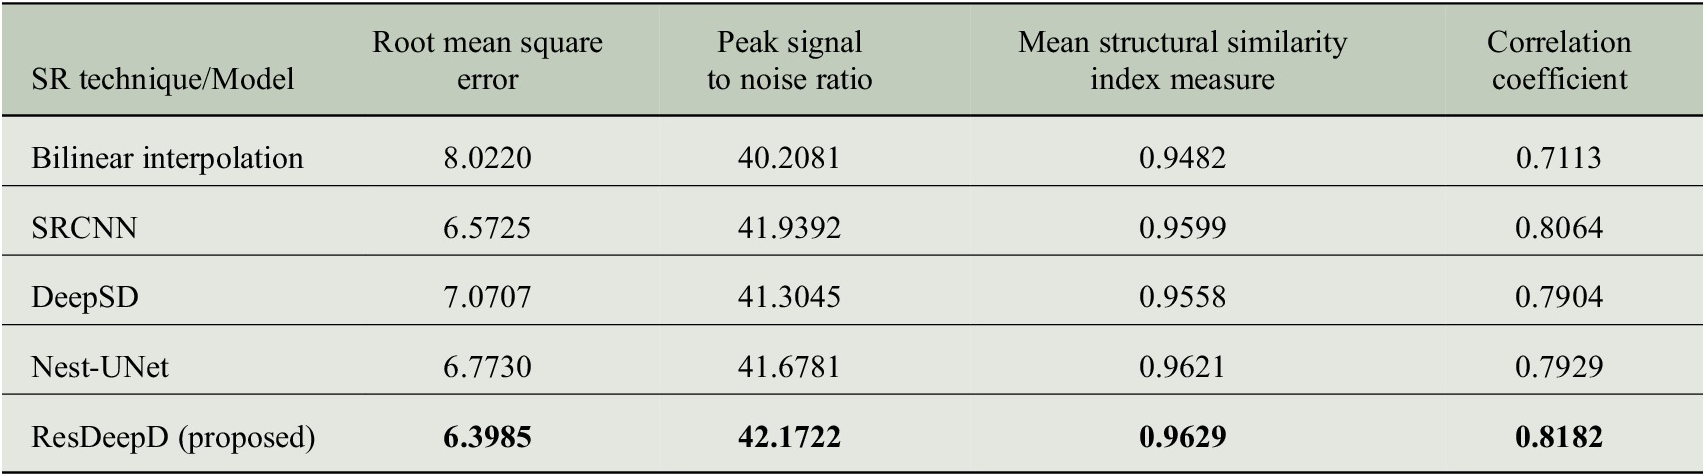
The performance of the proposed residual network is also examined for the extreme weather events like cyclonic storms and deep depressions that occurred in the ISMR period. For this analysis, we have used the predicted results and the ground truth data of the extreme rainfall events (i.e., cyclonic storms, deep depressions, and depressions) that occurred over the North Indian Ocean region between 2013 and 2019 in the ISMR period (Annual RSMC Report, 2013–2019, IMD, Govt. of India). Since we are dealing with the precipitation values over Indian landmass only, we have considered only those extreme events that have some effect on the Indian landmass. It is observed that the proposed network can effectively downscale the precipitation data during extreme events, and it shows better performance than other models on all the measures. The performance measures obtained while examining the extreme precipitation events are shown in Table 2.
Table 2. Model performance during extreme events.
6. Conclusion
Downscaling the climate variables has a significant impact on regional decision-making. Our proposed network can make local-scale projections of ISMR data with less error and better similarity to the ground truth than existing models. We have examined the predictive behavior of these models for ISMR data and for a specific scaling factor. This behavior may change with regional climatic factors of different regions across the globe. In future, this model can be employed to analyze and downscale the climate variables of different geographical regions.
Author Contributions
The first author has performed the experiments and first draft of the paper. The second author has defined the problem, provided technical advice, and polished the paper.
Competing Interests
The authors declare no competing interests exist.
Data Availability Statement
The data used in this work are freely available at: https://www.imdpune.gov.in/Clim_Pred_LRF_New/Grided_Data_Download.html.
Funding Statement
This work was partially funded by Sponsored Research and Industrial Consultancy, IIT Kharagpur, Grant no. IIT/SRIC/AI/STF/ 2020–2021/067.
Provenance
This article is part of the Climate Informatics 2022 proceedings and was accepted in Environmental Data Science on the basis of the Climate Informatics peer review process.


 Open access