


1. Introduction
Around 8 million tons of coffee were exported from producing countries in 2019 (International Coffee Organization, 2020), which makes coffee one of the most traded food commodities worldwide (Girotto et al., Reference Girotto, Pivato, Cossu, Nkeng and Lavagnolo2018). Coffee production is also one of the most important activities in the rural regions of many developing countries as around 20–25 million families in 51 nations depend on coffee production for their livelihoods (Castro et al., Reference Castro, Montes and Raine2004; Lewin et al., Reference Lewin, Giovannucci and Varangis2004; Prasad, Reference Prasad2019). According to Castro et al. (Reference Castro, Montes and Raine2004), in Central America coffee production supports 291,000 farmers and provides around 1 million seasonal jobs.
In Costa Rica, coffee production is an important economic activity for many rural cantons (Pelupessy and Díaz, Reference Pelupessy and Díaz2008), where primary production is mostly carried out by small farms. In fact, 92 per cent of coffee farmers have plots that are less than 5 hectares in size and 6 per cent have plots that are between 5 and 20 hectares (ICAFE, 2017; Dragusanu et al., Reference Dragusanu, Montero and Nunn2021).
The coffee value chain is made up of coffee growers, coffee milling companies, exporting firms and roasting firms. According to the Costa Rican Coffee Institute (ICAFE, 2017), 43,035 coffee growers, 246 coffee milling companies, 76 exporting firms and 65 roasting firms were operating in Costa Rica in 2017. During the 2016–2017 harvest, 1.4 million 46-kg bags of green coffee were exported, representing US$288.3 million. In 2017 coffee production accounted for roughly 0.28 per cent of gross domestic product (GDP) and 8.17 per cent of agricultural GDP (ICAFE, 2017).
Coffee price is, on the one hand, one of the most volatile among primary commodities (Lukanima and Swaray, Reference Lukanima and Swaray2014), and on the other hand, one of the most important determinants of profitability for all actors in the coffee value chain, especially for growers. Price drops affect both short-term and long-term profitability for growers by discouraging investment in coffee plantations, making plots more vulnerable to pests and diseases (Avelino et al., Reference Avelino, Cristancho, Georgiou, Imbach, Aguilar, Bornemann, Läderach, Anzueto, Hruska and Morales2015). As a result, the productivity of plantations falls, generating a double crisis for producers, as the effects of the price reductions are aggravated by those of lower productivity (Renard, Reference Renard2010; Eakin et al., Reference Eakin, Tucker, Castellanos, Díaz-Porras, Barrera and Morales2013). Furthermore, Pelupessy and Díaz (Reference Pelupessy and Díaz2008), Sick (Reference Sick2008), Rettberg (Reference Rettberg2017) and Prasad (Reference Prasad2019) have reported that low international coffee prices also entail higher levels of unemployment, poverty, migration, violence and corruption in coffee-producing regions.
Within the value chain, coffee mills (agro-industrialists) are usually the ones that export the coffee and deal with international buyers. In this scenario, coffee growers face a problem of asymmetric information, as they usually lack knowledge about the expected evolution of international prices, which are highly uncertain and fluctuating. In order to mitigate this information asymmetry, Costa Rica's 2762 Law on the ‘Regime of relationships between coffee producers, manufacturers and exporters’ was enacted in 1961 to regulate coffee berry prices in the country. This law is intended to solve the market failures due to this information gap and to establish equitable relationships between mills and growers in such a way that the price that mills pay for coffee berries must be based on the international prices they get. Specifically, it creates a consignment mechanism in which prices paid to farmers by coffee mills must be a function of the seasonal average final price, production costs and processing yields (Asamblea Legislativa de Costa Rica, 1961; Adams and Ghaly, Reference Adams and Ghaly2007; Dragusanu et al., Reference Dragusanu, Montero and Nunn2021).
Despite this law, it has been observed that coffee mills report quite different annual average prices (see figure 1). Given this variability and the importance of prices for coffee growers, it seems relevant to ask what factors matter most in determining coffee prices and, ultimately, the profitability of this activity.
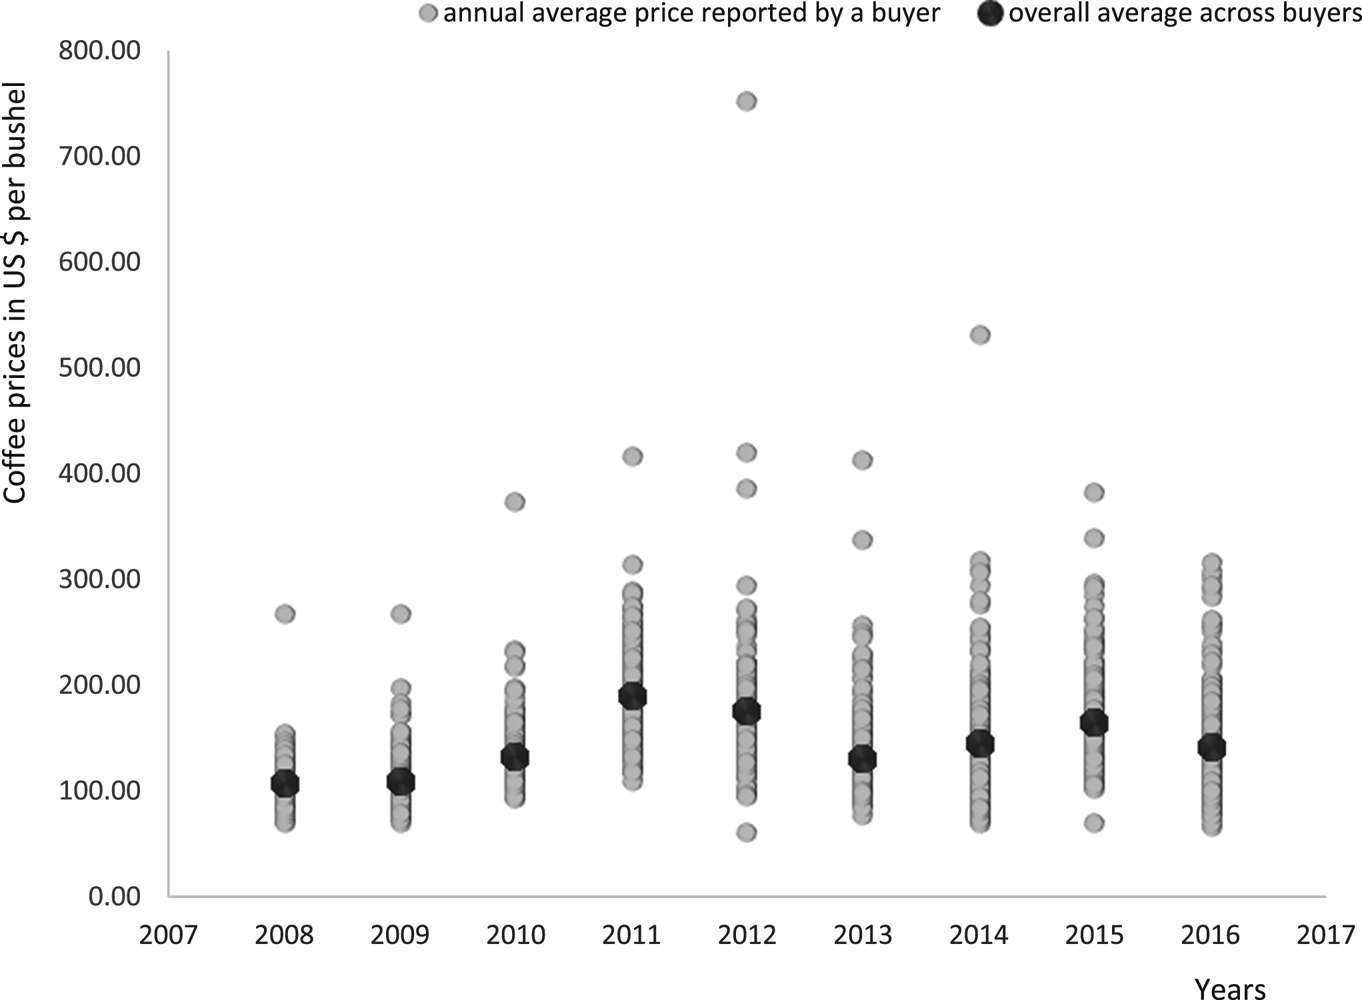
Figure 1. Costa Rica. Annual average prices of coffee berries reported by mills in US$ per bushel from 2007–2008 to 2015–2016 coffee harvests.
Note: Each gray dot represents the annual average price reported by a buyer. The black dots represents the overall average across buyers.
Source: Authors' elaboration based on data from ICAFE (2020).
This article aims at assessing the main driving forces behind the prices paid to coffee farmers in Costa Rica. Among such forces, we identify three groups. First are some external factors, such as the international price or the impact of multinational companies. Second are some intrinsic characteristics that are related to coffee quality, but difficult or impossible to modify by coffee growers, such as altitude or the yield of coffee berries. The third group has to do with differentiation strategies that farmers can use to put them in a better position, mainly by adopting social and environmental certifications and programs. In the latter group, we focus on two cases that are particularly relevant in the Costa Rican coffee sector: Fairtrade (FT), which is a company certification, and organic coffee (OC), which is a product certification linked to coffee quality and the technology used to produce it. We address the following questions: (i) What are the main drivers of coffee prices in Costa Rica? And, more specifically, (ii) What differentiation strategies used by coffee growers are more successful in obtaining better prices?
Among the researchers who have studied the determinants of coffee prices in Costa Rica, Donnet et al. (Reference Donnet, Weatherspoon and Hoehn2008) estimated a hedonic pricing function using data from e-auctions in Central and South America and found that market clearing prices are influenced by sensory characteristics and reputation, including third-party quality rankings, country of origin, coffee variety, and quantity. They also found that e-auction coffee sales result in substantially higher prices than those obtained in conventional commodity markets.
Pelupessy and Díaz (Reference Pelupessy and Díaz2008) concluded that the highest-quality coffees harvested in the highlands of Central America obtain better prices in international markets than coffee harvested in lowland areas, which tend to be of lower quality. However, lowland producers can also increase their sale prices and survive in the coffee sector through market differentiation in terms of environmental and social attributes. Samper (Reference Samper2010) argued that quality and the use of organic production systems are positively related to better prices for coffee growers in Costa Rica. Likewise, Wollni and Zeller (Reference Wollni and Zeller2007) found that farmers participating in the specialty coffee segment in three coffee regions of Costa Rica received higher prices than those participating in conventional channels. Dragusanu et al. (Reference Dragusanu, Montero and Nunn2021) found that the FT certification is associated with a higher sale price and greater sales by coffee cooperatives.
Like some previous studies, we focus on the prices that coffee growers receive, i.e., the first link in the coffee value chain (see, e.g., Wollni and Zeller, Reference Wollni and Zeller2007; Pelupessy and Díaz, Reference Pelupessy and Díaz2008; Samper, Reference Samper2010). However, previous analyses focus on the influence of individual variables such as quality, environmental certifications, or regional differences in coffee prices. The present paper goes beyond these approaches by considering the effect of several groups of factors, including producers' strategic decisions, coffee characteristics and external elements such as the international price. We use a panel data analysis, which has the advantage of allowing us to control for the effect of omitted variables and to test more complicated behavioral hypotheses than is possible using data from a single cross-section or time series (see Hsiao, Reference Hsiao2007).
The remainder of the paper has the following structure. Section 2 presents the conceptual framework and the hypotheses to be tested, and section 3 explains the methodological aspects, including the econometric approach, the variables considered, and the data sources used. Section 4 presents and discusses our findings, and section 5 gathers the main policy implications. Finally, our conclusions are summarized in section 6, along with some suggestions for future research.
2. Theoretical framework and hypotheses
We are concerned about the effect on price of coffee attributes, and especially those that can be strategically decided by growers. To prevent estimation biases, we also control for other elements that may have an influence on the coffee price, such as the international price and the power of multinationals. In what follows, we detail each of the factors under consideration.
2.1 External factors
2.1.1 International coffee prices
It is well-established that international markets are crucial in determining the domestic prices of commodity products, especially in small countries with open economies (Igami, Reference Igami2015). Like other commodities in developing countries, it has been shown that domestic coffee berry prices are strongly influenced by international prices (Worako et al., Reference Worako, van Schalkwyk, Alemu and Ayele2008; Mofya-Mukuka and Abdulai, Reference Mofya-Mukuka and Abdulai2013). An important implication is that the periods during which prices for green coffee are low in international markets tend to generate economic crises in coffee growing regions (see Avelino et al., Reference Avelino, Cristancho, Georgiou, Imbach, Aguilar, Bornemann, Läderach, Anzueto, Hruska and Morales2015; Prasad, Reference Prasad2019).
Therefore, our study includes the international price as an important control variable. Currently, the main international references for coffee prices are the London International Financial Futures and Options Exchange, and especially the New York Stock Exchange (Jarvis, Reference Jarvis2012; Lukanima and Swaray, Reference Lukanima and Swaray2014). Moreover, the International Coffee Organization established a general price indicator system based on prices of the different types of green coffee that are marketed around the world. Within this system, we take a specific price indicator for ‘Other mild arabicas’, which is how Costa Rican coffee is classified (ICO, 2011).
Figure 2 shows that, in the period between 1990 and 2017, domestic coffee prices in Costa Rica followed a very similar trend to that of international prices. Table 1 shows basic statistical information about the domestic price and the international price.
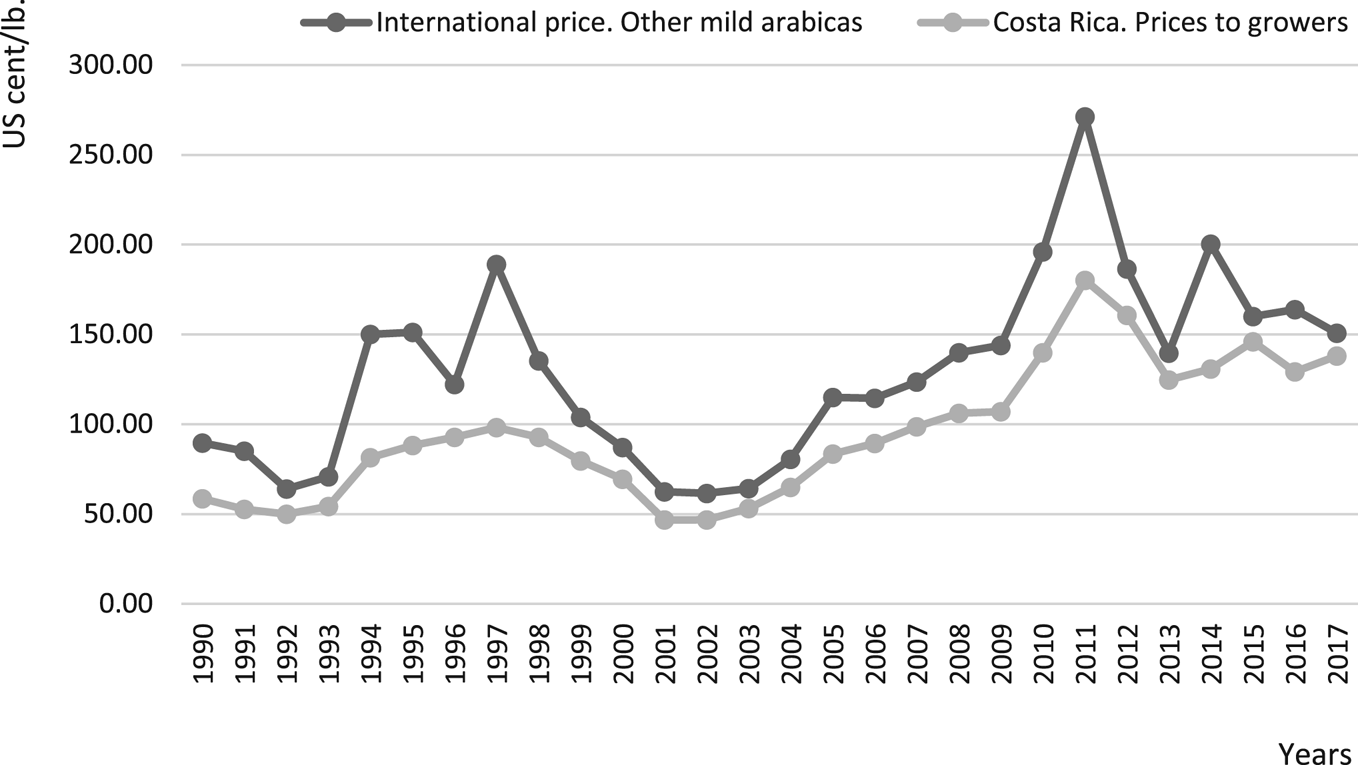
Figure 2. Nominal coffee prices. US Dollar Cents per pound.
Source: Authors' elaboration based on ICO statistics.
Table 1. Descriptive statistics of national and international prices
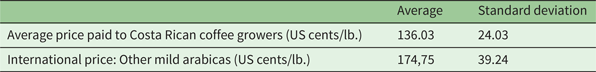
Period: 2008–2016.
Source: Authors' elaboration based on ICO statistics.
2.1.2 Multinational coffee companies
Multinational companies (MCs) control value-added activities in several countries (Dunning and Lundan, Reference Dunning and Lundan2008). These companies are often vertically integrated, in the sense that different stages in the production process take place in a single firm, and/or are horizontally integrated, insofar as they establish the same or similar production processes in different locations, mainly to gain market access or because of tariffs and transportation costs (Borga and Zeile, Reference Borga and Zeile2004).
MCs typically extract a ‘fee’ to offset the risk of investing in specialized and real-estate assets in a host country. This fee might take the form of higher prices for goods they sell and/or lower prices for the commodities they purchase (Teece, Reference Teece1985: 237). Similarly, Dunning and Lundan (Reference Dunning and Lundan2008) consider that MCs can use their dominant position to gain competitive advantages in the form of cheaper inputs in different countries (see also Markusen, Reference Markusen1995).
It has been noted that these phenomena are clearly present in the coffee sector, as well as in other strategic activities dependent on absolute advantages linked to natural resources, such as soil productivity or climate. In fact, as noted by Talbot (Reference Talbot1997, Reference Talbot2002), multinational coffee companies (MCCs) tend to integrate most of the value-added processes along the coffee production chain (vertical integration), and also tend to carry out agro-industrial processes in different countries or different regions in the same country (horizontal integration). These strategies are prone to put MCCs in an advantageous position when it comes to negotiating prices. Therefore, we expect these companies to pay lower prices. Accordingly, we formulate the following hypothesis:
H1: MCCs pay lower prices to coffee growers than other types of coffee mills.
2.2 Intrinsic coffee quality properties
In this group we include those variables that are related to coffee quality but are intrinsically given and not easily modified by growers.
2.2.1 Coffee berry yield
The agro-industrial process of coffee basically consists of the separation of husks and pulp from coffee berries, after which the coffee beans must be completely dried. The resulting product is called green coffee or parchment coffee. A higher yield of coffee berries is expected to imply a higher price paid to coffee growers (ICAFE, 2014), since coffee berries with larger and heavier seeds are associated with higher quality, and mills therefore obtain higher yields from their inputs. Based on these arguments, the following hypothesis is proposed:
H2: Berry yield is positively related to coffee berry price.
2.2.2 Altitude of coffee production regions
Altitude is an important determinant of coffee sensorial qualities (body, acidity and aroma). Pelupessy and Díaz (Reference Pelupessy and Díaz2008) argued that the optimal growing altitude in Central America is between 1,200 and 2,100 m above sea level (masl). Varangis et al. (Reference Varangis, Siegel, Giovannucci and Lewin2003) noted that coffee grown between 800–1,200 masl is usually classified as hard bean (HB) and above 1,200 masl as strictly hard bean (SHB). Agricultural policies in Central America promote high altitude coffee cultivation, as HB and SHB coffee enjoy more prestige and better prices in international markets (Castro et al., Reference Castro, Montes and Raine2004; Pelupessy and Díaz, Reference Pelupessy and Díaz2008). In the case of Costa Rica, it has been reported that coffee quality differs considerably across regions. Samper (Reference Samper2010) claims that while growers in highlands tend to produce higher-quality coffee and earn significant price premiums, those in lower areas offer lower quality and focus on output volume instead.
According to ICAFE (2017), Costa Rica has eight coffee producing regions, which differ with respect to altitude, rainfall volume and soil characteristics. Coffee farms located in Tarrazú region are located from 1,100 to 1,900 masl and the coffee coming from this region is classified as SHB arabica by the Costa Rican Institute of Coffee (Arce and Linnemann, Reference Arce and Linnemann2010; Castro-Tanzi et al., Reference Castro-Tanzi, Dietsch, Urena, Vindas and Chandler2012), which leads us to expect that coffee produced in Tarrazú is, on average, higher quality and thus is sold at higher prices, as we state in our next hypothesis:
H3: Coffee growers located in the Tarrazú production region obtain higher prices than in other production regions.
2.3 Strategic differentiation: environmental certifications
Traditionally, most Costa Rican growers and coffee mills follow a low-cost production approach. However, an increasing number of them are pursuing alternative strategies involving product differentiation, which include geographic indications of origin, gourmet and specialty, as well as environmental certifications such as: OC, FT, Eco-friendly or shade grown, among others (see, e.g., Lewin et al., Reference Lewin, Giovannucci and Varangis2004). It seems relevant to assess the effectiveness of these strategies as compared to more traditional variables such as production costs and productivity.
We focus on two environmental certifications that we consider to be particularly relevant in the Costa Rican coffee sector: FT and OC. FT was one of the first certifications adopted by coffee cooperatives in the early 1990s. Such an adoption prompted them to learn how to meet social and environmental standards widely required in the current world market, and to approach further programs and certifications (Ronchi, Reference Ronchi2002; Snider et al., Reference Snider, Afonso-Gallegos, Gutiérrez and Sibelet2017a). On the other hand, OC production is considered a key strategy for environmental purposes and for the sake of international market penetration (Blackman and Naranjo, Reference Blackman and Naranjo2012).Footnote 1
FT and OC have in common that both are differentiation strategies aimed at socially- and environmentally-aware consumers. There is an important difference, though. ‘Organic’ is a characteristic of coffee and its production process. Therefore, the OC certification is exclusively awarded at the farm level. FT refers to social and environmental standards adopted by the coffee cooperatives and mills as well as growers.
2.3.1 Organic coffee
Coffee growers who aim at being certified as OC must comply with a strict package of technological and environmental standards, including the following practices in their farms (Van der Vossen, Reference Van der Vossen2005; Blackman and Naranjo, Reference Blackman and Naranjo2012):
(i) using composted organic matter rather than chemical fertilizer inputs,
(ii) implementing soil conservation practices such as planting shade trees, planting cover crops and mulching,
(iii) using natural substances for disease, pest and weed control, rather than synthetic pesticides and herbicides,
(iv) minimizing the use of fossil fuels in the production process, and
(v) minimizing pollution during postharvest handling.
In summary, OC growers must reduce chemical inputs and adopt environmentally friendly management practices such as agroforestry techniques that increase the level of biodiversity in farms (Inter-American Development Bank et al., 2002).
Lewin et al. (Reference Lewin, Giovannucci and Varangis2004) state that OC growers obtain economic benefits, primarily because they can participate in a differentiated market and obtain better prices while safeguarding natural resources. Varangis, et al. (Reference Varangis, Siegel, Giovannucci and Lewin2003) argued that roaster companies pay a premium for OC because final consumers are in turn willing to pay higher prices. For example, Mexican OC growers received, on average, 19 per cent more per kilogram than conventional growers in the period from 1995 to 2004 (Barham et al., Reference Barham, Callenes, Gitter, Lewis and Weber2011). In Nicaragua, the price obtained by organically certified farmers was 27 per cent higher than that received by FT certified and non-certified farmers (Jena et al., Reference Jena, Stellmacher and Grote2015). Based on this empirical evidence, our next hypothesis is the following:
H4: Organic coffee berries receive higher prices than non-organic berries.
2.3.2 Fair-trade producer certification
Coffee mills buy berries from growers and carry out the first industrial transformation of these berries. According to Pelupessy and Díaz (Reference Pelupessy and Díaz2008), FT producers are mills, normally cooperatives, that buy coffee from growers, who are in many cases partners of the cooperative itself and meet some of the production standards of FT organizations. To obtain this certification, FT producers must comply with certain environmental and social standards, which include paying a fair price to farmers, transparency and accountability, commitment to non-discrimination, ensuring good working conditions, facilitating capacity building, respect for the environment, and creating opportunities for economically-disadvantaged producers (Ruben, Reference Ruben and Ruben2009). These efforts are expected to be rewarded by higher prices in the market.
Despite what one might expect, empirical results regarding the effect of FT on price are mixed. In Costa Rica, Dragusanu et al. (Reference Dragusanu, Montero and Nunn2021) found that FT cooperatives and grower associations receive higher prices and revenues when the minimum sale price guaranteed by FT is above the international price. They also show that FT is associated with higher incomes and better social indicators for coffee farmers' families. On the other hand, Sick (Reference Sick2008) and Jena et al. (Reference Jena, Stellmacher and Grote2015) show that FT certification does not necessarily imply better prices for coffee growers (see also Bacon, Reference Bacon2005; Haight, Reference Haight2007; Weber, Reference Weber2007; Omidvar and Giannakas, Reference Omidvar and Giannakas2015).
Considering the FT objectives, as well as some of the empirical studies previously carried out in this area, the following hypothesis is posed:
H5: FT-certified coffee mills pay higher prices (both for organic and non-organic berries) than non-certified mills.
3. Material and methods
3.1 Panel data set
We built an unbalanced panel data set from 2008 to 2016 with information about annual average coffee prices paid by mills in Costa Rica and a set of variables that are expected to have an impact on such prices. The coffee berry prices are denoted as DP i (rc)t, where the unit of analysis is the buyer ‘i’ who bought a type of coffee ‘c’ in a production region ‘r’ at time ‘t’ (from 2008 to 2016). The same coffee mill could appear in several groups of the panel if it bought more than one type of coffee or from more than one region in the sample period.
Some variables, such as the coffee production region r, type of coffee c, and multinational coffee company mcc, are time invariant, although they vary across the groups of the panel. On the other hand, the international green coffee price variable, IP, only varies with time, but not across the groups of the panel (therefore, IPi (rc)t = IPt).
Those groups in which the buyer i only reports purchases for one year during the sample period were not included in order to reduce the bias that could be introduced by companies that bought coffee in a speculative and non-systematic manner. After these adjustments, our effective panel consists of 426 groups (i(rc)t = 1,…,426) and 2,415 observations.
3.2 Data sources
Data about the coffee berry yields and domestic coffee prices were taken from the website of the Costa Rican Coffee Institute (ICAFE, 2020). This institution provides the average annual prices paid to growers as reported by the coffee mills to the Costa Rican regulatory agency. The prices are specified by buyer, type of coffee (including organic coffee) and coffee region. These data have been widely used by other researchers (see, e.g., Mosheim, Reference Mosheim2002; Blackman and Naranjo, Reference Blackman and Naranjo2012; Babin, Reference Babin2015; Naranjo et al., Reference Naranjo, Pieters and Alpízar2019, Dragusanu et al., Reference Dragusanu, Montero and Nunn2021; among others). The domestic prices were originally in the domestic currency (colon). To have them in the same unit as the international price, they were converted to US$ using the annual average exchange rate of the Costa Rican Central Bank (Banco Central de Costa Rica, 2019).
Since there is not a unified source of FT-certified firms by year, we built this indicator from several sources. First, we consulted the websites of the Fairtrade Coordinator for Costa Rica and Panama (2020) and the FLOCERT customers information (FLOCERT, 2017). In the sample period, 20 buyers were FT-certified at least in 2 years; nine of them belonged to the COCAFE consortium, while 11 were independent cooperatives or growers' associations. We sent an email to the cooperative managers to check the exact period during which they were certified, and the proportion of coffee sold in the FT market. We received complete answers from COCAFE and four other cooperatives. This information was complemented with data obtained from the websites of the Consortium of Coffee Cooperatives of Guanacaste and Montes de Oro, R.L. (COCAFE, 2019) and the cooperatives themselves. In addition, we conducted a bibliographic review on the participation of Costa Rican cooperatives in the FT market (see, e.g., Ronchi, Reference Ronchi2002; Luetchford, Reference Luetchford2008; Sáenz-Segura and Zúñiga-Arias, Reference Sáenz-Segura, Zúñiga-Arias and Ruben2009; Babin, Reference Babin2012, Reference Babin2015; Díaz and Hartley, Reference Díaz and Hartley2014; Snider et al., Reference Snider, Gutiérrez, Sibelet and Faure2017b, among other studies).
In addition, Talbot (Reference Talbot2002), Faure and Le Coq (Reference Faure and Le Coq2009) and García and Valenciano-Salazar (Reference García and Valenciano-Salazar2016) identified MCCs operating in Costa Rica. We took the information from these studies and double-checked it through the MCCs' webpages. Finally, for international prices we used ‘other mild arabicas coffee’ prices, taken from the International Coffee Organization (2020).
3.3 Variables
We take the logarithm of annual average prices paid by a mill according to coffee type and production region (logDPi (rc)t) as the dependent variable. Regarding the independent variables, some of them are qualitative and some quantitative; the former pertain to buyers and coffee characteristics, while the latter refer to coffee berries yields and international prices. Table 2 shows the definition and the main statistics of each variable.
Table 2. Summary statistics (n = 2415)
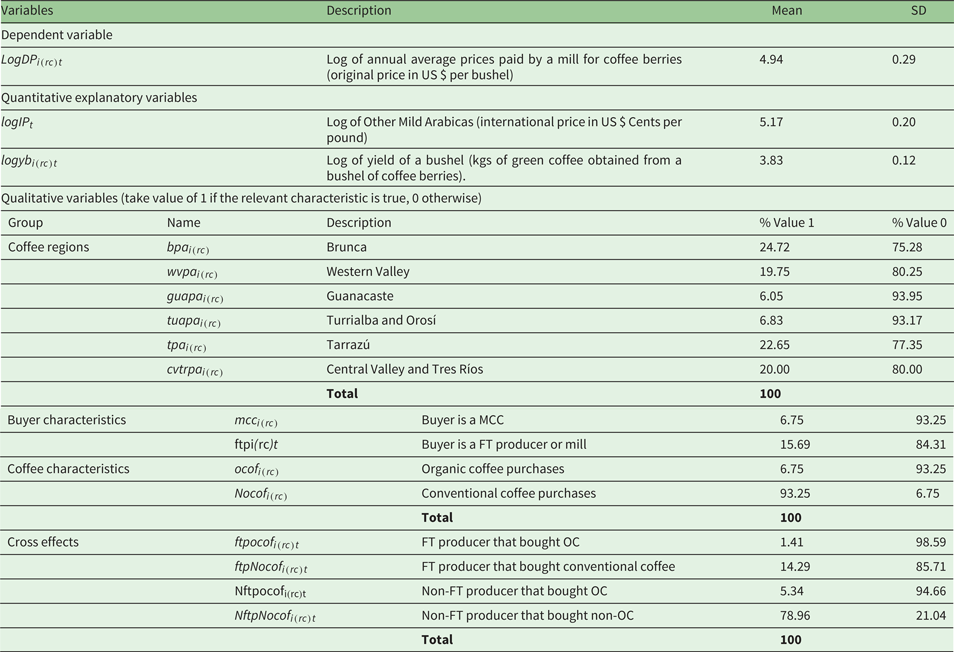
Notes: Panel period 2008–2016.
3.4 Econometric models
Two alternative lineal models were considered. The first seeks to identify individual effects of certified organic coffee (ocofi (rc)) and certified FT buyers (ftpi(rc)t) separately, while the second model considers the cross effects of both variables.


where uit is a random term and the rest of the variables are as previously defined in table 2.
To determine the most adequate approach, the pooled, fixed effects and random effects (RE) versions of the two specifications (equations (1) and (2)) were estimated. In all cases, the results of Hausman Tests and Breusch-Pagan Lagrange Multiplier Tests confirm that a General Least Square Estimator with an RE regression is the most appropriate model for estimating these equations, as shown in table 3.
Table 3. Specification and diagnosis tests
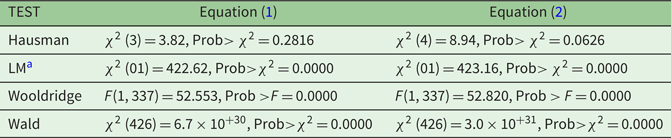
a Breusch-Pagan Lagrange Multiplier Tests.
Additionally, the RE model is the most suitable when the regressors include variables that are constant over the observed time interval but vary between units or groups (Heij et al., Reference Heij, de Boer, Hans Franses, Kloek and van Dijk2004). Since in our panel data set some variables, such as coffee type, multinational company, and production regions, are constant in the same group, this is an additional argument to prefer the RE model.
The Wooldridge test and the Wald test reveal the presence of autocorrelation and heteroscedasticity in our data. To address these problems, we use the Panel Corrected Standard Errors and the Prais-Winsten estimator, which allows us to correct the problems of heteroscedasticity and autocorrelation following a first-order autoregressive process, even when the panel data is not balanced (Baltagi and Wu, Reference Baltagi and Wu1999; Freybote, Reference Freybote2016), as is the case in this study. In addition, the standard errors of the Panel Corrected Standard Errors are more accurate than those of Feasible Generalized Least Squares in these circumstances (Beck and Katz, Reference Beck and Katz1995).
4. Results and discussion
Our results are displayed in table 4. We structure our discussion according to external variables, intrinsic quality variables and differentiation strategies available for growers.
Table 4. Regression results of some determinants of coffee berry price in Costa Rica
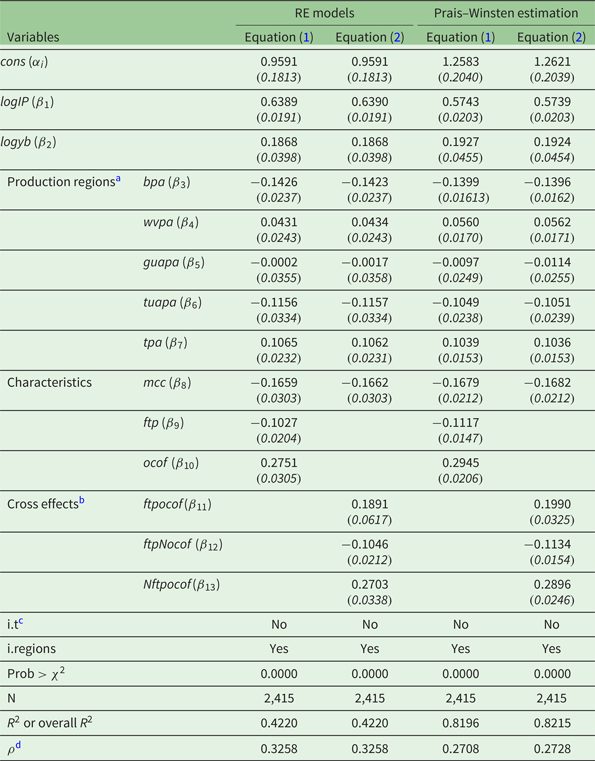
Notes: Standard errors in parentheses.
Unbalanced Panel: years = 9, n = 2,415, groups = 426. Observations per group: average = 5.7, minimum = 2, maximum = 9.
a The Central Valley and Tres Ríos Regions, variable cvtrpai (r)t is omitted.
b The Non-Fair-Trade Producer that bought non-organic coffee (NftpNocof) is the point of comparison of cross effects.
c Given that logIP does not vary between the groups of the panel, controlling for temporal effects was not carried out because the international price (logIPt) captures these effects.
d Rho is the fraction of total variance due to uit..
Regarding external factors, as expected, the domestic coffee berry prices have reacted directly to fluctuations in the international market. Secondly, we cannot reject our first hypothesis (H1) regarding the coffee berry prices reported by multinationals. Coefficient β 8 reveals that MCCs have paid, on average, 16.8 per cent less than other types of coffee mills. This result can be explained as the combined effect of different factors. First, the vertical integration strategy of MCCs allows them to merge the production, processing, and exporting links in the coffee value chain. Some MCCs are often able to go around distributors and reach final consumers directly. Intra-company sales can make the price lower since the company is, in some sense, paying to itself (or another company of the same group). Second, the horizontal integration strategy through the purchase and processing of coffee berries in several producing countries – and in the specific case of Costa Rica, in most producing regions – provide MCCs a stronger bargaining power. Importantly, large, diversified companies such as MCCs are more able to take the market risk and offer the farmers higher prepayments for their coffee in exchange for paying a smaller final price. On the other hand, smaller local mills and cooperatives can typically pay higher prices but only after they have sold the coffee in the international market, when they are certain about their revenues. Farmers may be willing to accept a lower but earlier payment rather than a higher but later payment.
Regarding the group of intrinsic quality variables, note first that yield (the amount of green coffee obtained from a bushel of coffee berries) is positively related to berry prices (coefficient β 2), as suggested in hypothesis H2, which cannot be rejected either. The interpretation is that coffee mills are willing to pay a higher price when berry yield is higher because they can save on inputs and production costs. The yield is related to the weight of the coffee seed and depends mainly on the conditions outside the farm, such as the climatic conditions and the altitude where the coffee is harvested. However, there are also intrinsic conditions of the farm, such as adequate fertilization of plantations, that can increase the agroindustry yield of green coffee (weight of coffee seeds).
We do not reject our third hypothesis either, since we find that coffee growers located in the Tarrazú region (coefficient β 7), have received a higher average price for their berries than that paid in the rest of the regions, as stated in hypothesis H3. Since Tarrazú is between 1,100 and 1,900 masl, this variable can be interpreted, to some extent, as a proxy for altitude. Coefficient β 4 refers to the Western Valley region, which is between 800 and 1,700 masl and yields Strictly Hard Bean, Good Hard Bean and Hard Bean coffees. This coefficient is also positive, providing some additional evidence in favor of H3, although we consider this evidence weaker than the evidence about Tarrazú, which has a higher proportion of SHB coffee region. Our conclusion is in keeping with the approach of Wollni and Zeller (Reference Wollni and Zeller2007), who used the altitude at which coffee is grown in Costa Rica as a proxy for quality and showed that coffee berries harvested in higher areas are sold mainly in specialty coffee markets, where they obtain higher prices. See also Varangis et al. (Reference Varangis, Siegel, Giovannucci and Lewin2003), Pelupessy and Díaz (Reference Pelupessy and Díaz2008), and Samper (Reference Samper2010).
Regarding the variables that refer to signaling and differentiation strategies, OC and FT, they result in very different outcomes. Coefficient β 10 shows that, as expected (hypothesis H4), higher prices have been paid for organic than for a conventional coffee. Specifically, the former has been sold for an average price 29 per cent higher than the latter. This finding is similar to that of Jena et al. (Reference Jena, Stellmacher and Grote2015) in Nicaragua. However, a fully fledged profitability analysis of OC should also account for the fact that organic production entails some reductions in productivity per hectare. In the case of Costa Rican coffee plantations, Lyngbæk et al. (Reference Lyngbæk, Muschler and Sinclair2001: 205) show that the average three-year productivity mean of organic farms was 22 per cent lower than that of conventional farms. Nevertheless, the organic price premium compensates for these lower yields in such a way that, excluding organic certification costs, net income was similar for both groups. A complete analysis must also consider that OC production is more environmentally sustainable than conventional production. In this regard, Blackman and Naranjo (Reference Blackman and Naranjo2012) found that organic certification in Costa Rica significantly reduced use of chemical pesticides, fertilizers, and herbicides and promoted the adoption of organic fertilizer.
Contrary to our hypothesis H5, FT coffee millsFootnote 2 do not appear to have reported a higher annual average price for coffee berries than non-certified mills. In fact, the reverse was true: on average, they reported around 11 per cent less than non-certified mills, ceteris paribus (coefficient β 9). If we look at the second specification (see equation (2)), note that β 13 > β 11 and β 12 is negative, which reveals that FT mills have reported lower average prices for both organic and conventional (non-organic) coffee berries than non-FT mills.
This apparently surprising result merits further discussion. As established by Costa Rica's Coffee Law number 2762, the price paid for coffee berries is established mainly based on prices for green coffee obtained in the national and international markets (incomes) minus processing and exporting costs. Sick (Reference Sick2008) suggested that Costa Rican FT cooperatives or associations incur costs related to certification, processing, financing to buy coffee from its members, traceability, and export logistics. Therefore, if FT mills operate inefficiently, these expenses can overcome the FT price premium before it reaches coffee growers. In addition, Snider et al. (Reference Snider, Gutiérrez, Sibelet and Faure2017b) identified, for some certified cooperatives in Costa Rica, a low market demand for certified coffee, weak price incentives for certified coffee and a high auditing costs. For the Mexican coffee market, see also (Weber, Reference Weber2011).
Secondly, Sick (Reference Sick2008: 201) argued that although FT guarantees a minimum price above average world market prices, this is not necessarily the best available price. The reason is that, in a highly competitive global coffee market, quality coffees are increasingly in demand and high-quality coffee can receive better prices than FT certified coffee. For example, Ruben (Reference Ruben and Ruben2009) claimed that in the current dynamic framework of quality upgrading and higher coffee prices, FT comparative advantage can become eroded in the Costa Rican coffee market (see also Sáenz-Segura and Zúñiga-Arias, Reference Sáenz-Segura, Zúñiga-Arias and Ruben2009).
Some studies have also claimed that, in terms of growers' resilience to international price fluctuations, FT is not always the optimal strategy. For example, in a study of coffee production in the district of Agua Buena, Costa Rica; Babin (Reference Babin2015: 99) concluded that ‘Fairtrade price premiums were inconsequential in providing support for smallholder resistance to land-use change out of coffee production. In contrast, the adoption of agroecological practices such as shade-tree diversification reduced reliance on costly external inputs, which allowed adopting producers to keep land in coffee production at a significantly higher rate than non-adopters’. Also in Costa Rica, Sáenz-Segura and Zúñiga-Arias (Reference Sáenz-Segura, Zúñiga-Arias and Ruben2009: 130), using sampling matching techniques found that growers that sold coffee to non-FT mills reached higher incomes, bore higher expenditures levels, and enjoyed better perception of their organization.
Additionally, Weber (Reference Weber2007) and Omidvar and Giannakas (Reference Omidvar and Giannakas2015) showed that saturation of the world FT coffee market can lead to a reduction in growers' welfare since cooperatives cannot obtain the FT price premium for all the coffee that they sell. Consistent with this insight, Haight (Reference Haight2007) and Sick (Reference Sick2008) claimed that most FT coffee mills in Costa Rica sell much of their coffee to roasters or brokers in conventional markets. They presented three cases; two cooperatives sold only 40 per cent of their coffee at FT prices in Costa Rica, while another cooperative sold only 23 per cent of its coffee in the FT market in Guatemala. Our survey of cooperative managers reveals that the proportion of coffee sold in the FT market varies widely, ranging from cooperatives that were not able to sell anything in the FT market during the period covered in this study, to others that placed 67 per cent of their production in that market.
However, the fact that FT mills do not report higher average prices should not lead one to the conclusion that there is no scope for this certification. First, note that FT cooperatives have reported higher annual average prices for coffee berries than MCCs (β 9 > β 8). Therefore, FT certification can be one additional channel of coffee sales in international markets, which may complete the cooperatives' portfolio of clients, mainly when the world production rises. In addition, the FT program is not only focused on prices. Some part of the FT price premium is used to generate indirect benefits to producers and their relatives, such as technical assistance, credit facilities, or social projects in the communities, and these actions are not reflected in the final price of coffee berries; see, e.g., Sick (Reference Sick2008) and Dragusanu et al. (Reference Dragusanu, Montero and Nunn2021).
5. Policy implications
This study provides some insights that can help come up with some recommendations in terms of farmers' strategies and in terms of public policy.
Regarding coffee growers' strategies, it is important that they become fully aware of the expected responses of prices with respect to different factors and which of those factors are under their control or not. Our results reveal that coffee prices are clearly related to coffee attributes, some of which are intrinsic characteristics of the coffee itself and others are more easily managed by growers.
Within environmental certifications, organic production practices seem to have a significant positive effect on the price while, on the other hand, FT mills have not reported higher average annual prices than non-certified ones. It is important to bear in mind that our analyses are restricted to prices. A fully fledged assessment of the FT program, which is not the object of this study, should also consider additional elements, such as the fact that FT cooperatives use part of the premium to carry out community development activities or training and technical assistance to coffee growers.
To some extent, our findings inform about the success opportunities for coffee growers, who should generate value-added strategies such as the foundation of micro-mills and private family enterprises, producing quality coffee, and the search for more direct marketing channels in international markets (see, e.g., Snider et al., Reference Snider, Afonso-Gallegos, Gutiérrez and Sibelet2017a; Nuñez-Solis, Reference Nuñez-Solis2019).
We can also arrive at some conclusions regarding public policy. Since coffee price is sensitive to some variables that are beyond the control of small growers, such as the fluctuations in the international prices, the intervention of public institutions can be crucial. Such institutions should undertake and improve strategies of market research and adaptation to low coffee prices such as adequate price forecasting systems. A sound prediction strategy would involve continuous monitoring of international coffee prices, by studying the main stock exchanges and the use of statistical forecasting models. Making such information available to coffee producers would help them prepare for downward trends in prices. Currently, ICAFE has a web page where current coffee prices on the New York Stock Exchange are reported (see, e.g., ICAFE, 2015) but no price forecasts are offered. Financial risk reduction programs and business education would also help coffee growers to learn how to cope with fluctuations in coffee prices. In this regard, Naranjo et al. (Reference Naranjo, Pieters and Alpízar2019) point out insurance as a relevant channel to foster private investment, and also to reduce the vulnerability of coffee farmers to shocks.
Environmental international policies point towards countries' carbon neutrality (CN) as a key target. The European Union aims to be climate-neutral, which involves zero net greenhouse gas emissions, by 2050 (European Commission, 2021). Similar objectives were set in various countries around the world (see Zou et al., Reference Zou, Xiong, Xue, Zheng, Ge, Wang, Jiang, Pan and Wu2021), including Costa Rica. In this framework, low-carbon coffee production could be a mechanism to improve market access while rendering environmental benefits in coffee-growing regions (see, e.g., Valenciano-Salazar et al., Reference Valenciano-Salazar, André and Martín-de-Castro2021). Some steps have already been taken in this respect. Actually, the first company in the world to produce CN certified coffee is a cooperative in Costa Rica (Birkenberg and Birner, Reference Birkenberg and Birner2018; Birkenberg et al., Reference Birkenberg, Narjes, Weinmann and Birner2021). Also, the Costa Rican Coffee Institute and the Ministry of Agriculture have designed a strategy to reduce carbon emissions in the coffee sector. The Nationally Appropriate Mitigation Actions (NAMA) program has been adopted by the Costa Rican Government as a way to reach CN at the national level by 2050. In the agricultural sector, some special focus has been given to coffee and livestock (Ángel-Valdés and Pintor-Pirzkall, Reference Ángel-Valdés and Pintor-Pirzkall2017; Birkenberg and Birner, Reference Birkenberg and Birner2018).
Public policy can also contribute to fostering and guaranteeing the success of agricultural diversification. To this aim, public authorities should carry out agroecological studies to determine the products that best suit the climatic and soil conditions of each region. Hethcote et al. (Reference Hethcote, van Zonneveld, Solano, Méndez and Vásquez2016) studied a successful diversified system mixing coffee production with tomato and sweet pepper in a Turrialba coffee region of Costa Rica. Babin (Reference Babin2015: 99) concluded that ‘when addressing agricultural development crises, the promotion of agroecological practices that cut costs may be as good a strategy or better than one that focuses on enhancing yields or establishing price supports’. Alternative activities such as ecotourism and rural tourism could also be encouraged and incentivized, not only as a complement to coffee production, but also as a means to promote the care of nature and local culture (Heyne and Vargas-Camacho, Reference Heyne, Vargas-Camacho, Azara, Michopoulou, Niccolini, Taff and Clarke2018; Howitt and Mason, Reference Howitt and Mason2018).
Coffee growers of higher altitude production regions, such as Tarrazú, have a comparative national and international advantage that allows them to obtain a higher quality of coffee, which ensures higher prices. In order to guarantee the positioning of quality coffee from Costa Rica in general, and from the regions with the highest altitude in particular, the regulatory entity (ICAFE) may promote the Protected Designation of Origin that will allow the main brands of ‘Costa Rican coffee’ to maintain and widen their position in international markets. This strategy has been successfully carried out by producers of wine, meat, fruits, cheese, and other products in Europe (Hajdukiewicz, Reference Hajdukiewicz2014; Marcoz et al., Reference Marcoz, Melewar and Dennis2014; Sadílek, Reference Sadílek2019).
6. Conclusions and further research
Our study confirms that coffee prices, which are key for growers' profitability in developing regions, depend on the one hand, on a set of external variables that are beyond the control of farmers but, on the other hand, on their differentiation strategies.
As in previous studies, we conclude that there is a strong direct relationship between international and domestic coffee prices, and multinationals tend to pay lower prices. We also conclude that prices are positively affected by variables directly related to the quality of coffee but not easily controlled by growers, such as higher altitude (e.g., Tarrazú region) and larger yields. Regarding the specific environmental differentiation strategies that we have focused on, we find that organic production tends to get higher prices, while FT mills do not report having paid higher annual average prices, which suggests the necessity of further research for a fully fledged analysis of coffee differentiation strategies.
Additional paths for future research include the consideration and comparison of a wider variety of differentiation strategies and checking to what extent the results obtained in Costa Rica can be extrapolated to other coffee producing countries.
Acknowledgements
The authors would like to thank Elena Huergo, Tania Osejo and Guillermo Arenas, as well as the editors and two anonymous referees, for valuable feedback. J.A. Valenciano-Salazar acknowledges support from the Scholarship Department of the National University of Costa Rica (grant JB-C-1106-2016). F.J. Andre acknowledges funding from the Spanish Ministry of Science and Innovation (project PID2019-105517RB-I00).
Conflict of interest
The authors declare none.


 Open access