


1 Introduction
Product development is defined as the process of introducing new products. However, in industrial contexts, such as in a truck manufacturer, product development is also utilized to change and enhance existing products. The documents used to initiate such a change process are known as engineering change requests (ECRs). The motive for making engineering changes can be to improve, enhance, or adapt a product to identify opportunities or issues (Pikosz & Malmqvist Reference Pikosz and Malmqvist1998). Accordingly, ECRs are used to specify desired product changes and keep track of the evolution of a requested change from initiation, search for solution, verification, and decision on acceptance. As such, ECRs contain both product- and process-related information.
The engineering change process takes place in different phases of product development, and different authors have proposed generic models. Jarratt et al. (Reference Jarratt, Eckert, Caldwell and Clarkson2011) suggested a six-state engineering change process that begins with the ECR to be raised, followed by the identification of solution, risk assessment of solution, selection and approval of solution, implementation, and finally, a review of the change (Figure 1).

Figure 1. A generic engineering change process (Jarratt et al. Reference Jarratt, Eckert, Caldwell and Clarkson2011).
The ECR process is a part of the engineering change process corresponding to the first four states of Jarratt et al.’s (Reference Jarratt, Eckert, Caldwell and Clarkson2011) generic engineering change management (ECM) process (Figure 1); the last two states are known as the engineering change order process. Meanwhile, Hamraz et al. (Reference Hamraz, Caldwell, Wynn and Clarkson2013) reviewed methods to analyze ECM processes and identified 25 key requirements for such methods, including various components for building and using a process model.
In industry, an ECR goes through multiple states during the ECR process and can have 20–30 states within the high-level process mentioned by Jarratt et al. (Reference Jarratt, Eckert, Caldwell and Clarkson2011). For example, an ECR can change ownership, which means that ECRs can have many sequences during the resolution process of the change request. Arnarsson et al. (Reference Arnarsson, Gustavsson, Malmqvist and Jirstrand2017) affirmed that engineers need to analyze these sequences to improve the ECR process.
Companies now realize that large amounts of data are stored in databases, and that this data can be used to ensure continuous improvements and support decision-making for new projects (Davenport, Harris & Morison Reference Davenport, Harris and Morison2010; Bichsel Reference Bichsel2012; Wu et al. Reference Wu, Zhu, Wu and Ding2014). This vast amount of data include ECR reports. Single, large development projects can contain up to tens of thousands of ECRs (Giffin et al. Reference Giffin, de Weck, Bounova, Keller, Eckert and Clarkson2009; Arnarsson et al. Reference Arnarsson, Gustavsson, Malmqvist and Jirstrand2017). Due to the number of ECRs and the need for processing ECR data, it is crucial to both rationalize and secure the quality of the ECR process.
This paper describes an industrial case study where the design structure matrix (DSM) is used to model the sequence of ECRs to identify current best practices and propose improvements to the ECR process. Such rationalization can be done by utilizing timestamps from ECR documents that contain information on time and sequence throughout the process. Measuring the ECR process is not trivial; however, different types of ECRs are routed in different pathways through the system. There is, hence, no single ECR process, but rather many. In this regard, ECRs can be characterized as a stochastic process, which evolves between discrete ECR states during its lifetime (e.g., under investigation, testing).
It is difficult to understand and gain an overview of such processes. Nonetheless, Markov chain (Gilks, Richardson & Spiegelhalter Reference Gilks, Richardson and Spiegelhalter1995) probabilistic models can be used to model how discrete state processes evolve over time. The content of this paper documents the potential of applying Markov chains to analyze ECR processes, including the use of Markov chain matrices for stochastic process visualization of process sequences.
2 Earlier work
This section reviews earlier work on design process modeling and simulation, ECR processes, and Markov chain models.
The ECR process is a kind of a design process as it is used to describe a possible enhancement or an issue with a product. Project with a duration of several years can contain large volumes of ECRs (Giffin et al. Reference Giffin, de Weck, Bounova, Keller, Eckert and Clarkson2009; Arnarsson et al. Reference Arnarsson, Gustavsson, Malmqvist and Jirstrand2017) and many requirements change over time during development (Almefelt et al. Reference Almefelt, Fredrik, Patrik and Johan2006). ECRs are thus an important sub-process in designs and need to be carried out effectively. Wynn & Clarkson (Reference Wynn and Clarkson2017) surveyed available design process and simulation models and confirmed the rich variety of models. They argue that detailed, task-based models of design processes can support the design, management, and improvement of ‘meso-level’ processes, such as the ECR process. The ECR process is a complex one due to elements that can change, such as ownership and states during the resolution process of an ECR (Arnarsson et al. Reference Arnarsson, Gustavsson, Malmqvist and Jirstrand2017). Most design changes for products and systems emerge from predecessors and it is therefore critical to understand how and why changes propagate during the engineering design process (Giffin et al. Reference Giffin, de Weck, Bounova, Keller, Eckert and Clarkson2009).
Due to the complexity of the processes, no single model can fit all. However, DSMs (Steward Reference Steward1981; Eppinger & Browning Reference Eppinger and Browning2012; Browning Reference Browning2016) have successfully been used to construct task-based models of design processes, including stochastic factors. Accordingly, DSMs offer support for both qualitative and quantitative analyses of processes (e.g., visualization of processes, computation of process lead times). The main strength of the DSM is the efficient visualization of complex processes characterized by significant amounts of iterations.
A Markov chain model is a stochastic model used to describe randomly changing systems or processes, in which the probability of each transition only depends on the current state, not on the events that occurred before it (Figure 2). The process is represented as states (nodes in the model) and transition (arrows in e.g., Figure 5) show the probability for certain probabilities occurring.

Figure 2. Illustration of three activity state models with dependency relations between activities (Ahmadi, Roemer & Wang Reference Ahmadi, Roemer and Wang2001).
Meanwhile, Markov chain models (Gilks et al. Reference Gilks, Richardson and Spiegelhalter1995; Norris Reference Norris1998) have many applications in real-life situations, especially when one wants to investigate and understand processes evolving in different discrete states. Markov chain models have previously been utilized to analyze product development processes (Figure 2). Ahmadi et al. (Reference Ahmadi, Roemer and Wang2001), for instance, employed Markov chains to develop procedures to minimize iterations during the development process, which adversely affect development time and costs. Similarly, Cho & Eppinger (Reference Cho and Eppinger2001) used Markov chains to simulate a product development process with the aim of providing better project planning and control. Likewise, Dong (Reference Dong2002) used ideas from Markov chain models to understand organizational interactions during product development processes.
Smith & Eppinger (Reference Smith and Eppinger1997) used an extended DSM to model design iterations in situation- or system-specific design processes, called Work Transformation Matrix (WTM). The WTM and Markov chain DSM models are similar in the sense that they describe a sequence of possible coupled events and estimate the degree of coupling between them. State in a Markov chain terminology corresponds to a task in a DSM and a transition in a Markov chain corresponds to a relation in a DSM. Smith & Eppinger (Reference Smith and Eppinger1997) further note that generating reliable data for a DSM is challenging and will require additional effort for each new system-specific design process that is modeled. Using the Markov chain method to create a Markov chain model is essentially a DSM.
The ECR process, in contrast, relies on a standardized process that is applied to a multitude of different systems and components. The adaptations made, for instance, with respect to estimated severity of the change, are dynamic as they are decided on by the actors during the process execution. Standardization constitutes an opportunity in this case: ECR data are stored in corporate product data management databases in standard formats. Arnarsson et al. (Reference Arnarsson, Malmqvist, Gustavsson and Jirstrand2016) demonstrated how data mining and analytics tools can be applied to visualize and explore ECR databases, showing, for example, change request frequency over time in a design process.
Combining ECR databases, data mining, and Markov chain matrices enable the quick construction of DSM models of the ECR process.
3 Aim
This study aims to gain more holistic insights into the sequences taking place early in the product development process of ECRs. By analyzing ECR processes from a Markov chain DSM perspective, one can draw conclusions regarding how product developers handle issues during projects and detect similarities and differences among different product development projects. Comparisons can be done on success factors and outliers by investigating why projects differ in the process, thereby identifying communication issues and improving efficiency in handling ECR issues. Such analyses are not industrial practice today.
The following research questions are addressed in this paper:
(1) What patterns can be observed in a single project?
(2) What patterns can be observed comparing multiple projects?
(3) What improvements can these observations lead to?
(4) What are the efforts, benefits, and limitations of using Markov chains for ECR analysis?
4 Significance
The statistical ECR process DSM analyses have not been performed so far although the data is available. Nevertheless, engineers want to examine the overall resolution process of an ECR so as to improve it. Although no previous research specifically analyzing the data from sequence of ECRs in product development projects has been conducted, the literature cited above has identified questions that can aid the analysis of ECRs. This paper addresses this research gap and aims to apply Markov chain modeling to analyze the ECR database in product development to gain insight into sequences.
5 Research approach
This study is based on a product development database containing ECRs from an industrial commercial vehicle development project (see Figure 3). Compared to manually analyzing a few ECRs at a time, the Markov chain DSM approach allows the analysis of large sets of ECRs, thus providing new, data-driven insights. Transitions of ECR states are mostly random and it is therefore suitable to use Markov chain as it can model randomly changing systems where it assumes that the future state only depends on the current state.
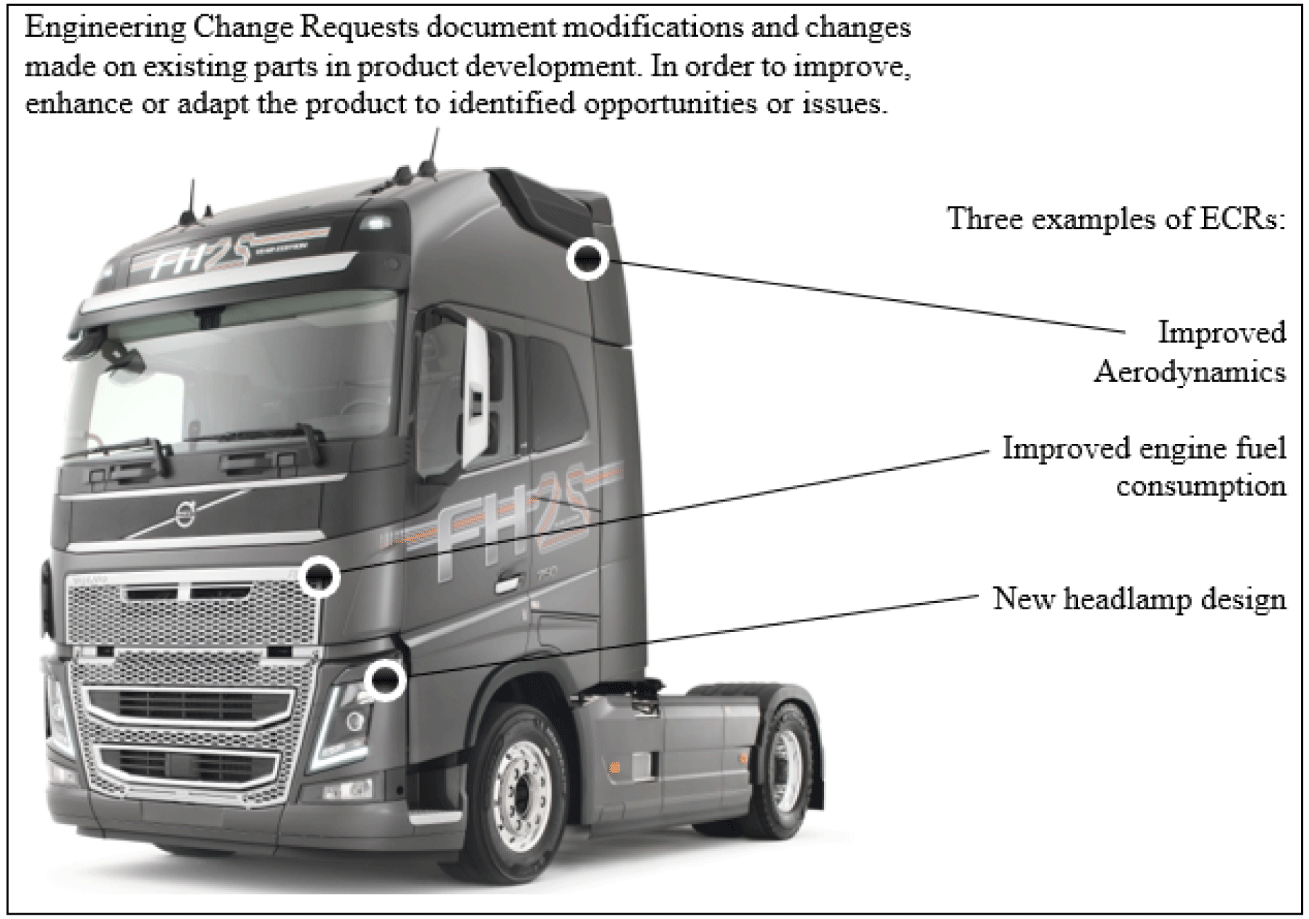
Figure 3. Example of an industrial commercial vehicle that generates ECRs during product development with examples of ECRs and their location on the vehicle.
Table 1. Main phases for the process states used in the Markov chain DSM
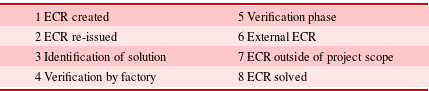
Table 2. A list that shows where ECR state names from data fit within the engineering change process

The data within the ECRs contain state transitions that include timestamps (e.g., data and time) and have the possibility to take on more than 30 unique states. Each ECR takes up a state for different phases within the resolution process, starting from ‘ECR created’ to ‘ECR solved’ (see Table 1). Each ECR contains data about all the historical state transitions it has taken under the resolution process and whether an ECR has changed owner during the process. For this industrial case study, we decided to limit our scope to the first three categories in Table 1 as it is more beneficial to compare sequences until the identification of possible solutions. After which, the verification process starts, and due to the many verification methods used, it is harder to point out process improvement for different methods of verification. In Table 2, state names are listed within the three first phases and where they fit in Jarratt et al.’s (Reference Jarratt, Eckert, Caldwell and Clarkson2011) engineering change process. The rows in Figures 5–9 are established according to the company’s process and have not been re-sequenced. In a DSM analysis, one task is to re-sequence the initial sequence to an ‘optimal’ sequence (i.e. minimize length of iterations); this is not done here.
A Markov chain is a type of stochastic process where the transition probabilities between the available states fulfill the Markov property, which means that the probability of evolving from one state to another only depends on the current state. This implies that the process is, in a sense, memoryless and does not care about the history of the process. For the given case, when we consider an ECR as a discrete stochastic process, it means that when an ECR is in a specific state at a specific time point, the probability of being transferred from that state to another only depends on the state the ECR is in at that time point. This is because we assume that the Markov property (i.e., memoryless property) holds.
We can describe the process by using a Markov chain DSM, which outlines the probabilities of evolving from one state to another (i.e., the element ( $x,y$) in the matrix represents the probability of the ECR evolving from state $x$ to state $y$). For the product development project considered here, information is available regarding time, date, and the states in which the ECRs evolved during the project. By utilizing this information, we can estimate the collective Markov chain DSM for all the ECRs in the project. The matrix is estimated by counting the number of times ECRs transitioned between the states and then normalizing the matrix by rows.
The Markov chain DSM can then be used to understand the normal sequence of ECRs (i.e., what seems to be the most common transition patterns for the ECRs). Moreover, we can detect issues in the process by, for example, finding states where many ECRs are re-issued or closed prematurely. Another approach is to create Markov chain DSMs for sub-groups of ECR types or for sub-groups of the company organization. By comparing the different transition matrices, we can detect differences and similarities between the sub-groups and draw conclusions.
The data science capabilities in this research are described in a methodology for the whole process in Figure 4. The data regarding the ECRs are stored in corpus databases, extracted into Excel files, and loaded into Python for cleaning and preparation. The Markov chain DSM was computed in Python and then estimated on the data.
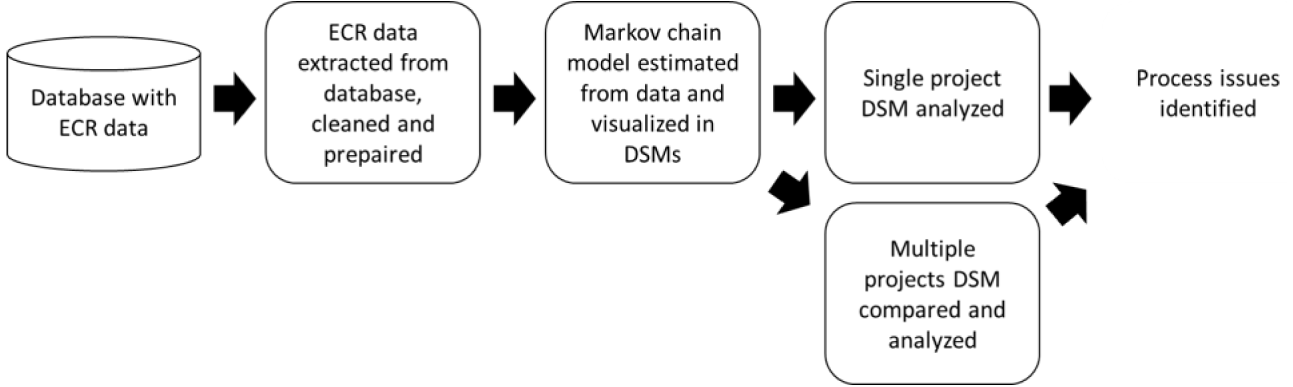
Figure 4. Flowchart of the methodology.
The transition matrices were computed using all of the data from the eight main phases in order to include all transitions, despite that the final results in figures in paper only display the three first phases. This results in that the sum of state transition probabilities are not always equal to 100% in Figures 5–9 as there are rows belonging to phases 4–8 in Table 1 that are not shown. Also, only probabilities above 1% are marked in the matrix, which also effect the percentage sum. The probabilities above 10% are highlighted with a gray box and the box becomes darker with higher probability numbers. It may also seem that some states like, for example, state 15, does not have any incoming transitions despite having outgoing transitions. This is because only sub-matrices of the full matrices are shown in Figures 5–9 in order to effectively highlight the most interesting parts. Figure 9 shows a globalization of Figures 5–8 in order to obtain statistically valid reference points and see if deviations are due to a systematic error or a single case. This can give an indication for detections of anomalies, which deviate from what is expected or the most common way. Patterns need to be evaluated by the company’s process expert to know if patterns are well founded or problematic. Anomalies can lead to innovations in processes since in principle they can show improvements or problematic behaviors due to lack of respect for current standards or common ways of working.
Table 3. The number of ECRs that each project contained and the sum of ECRs

The analysis of ECRs and their state transitions are presented in Markov chain DSMs (see Figures 5–8). Data from four product development projects were analyzed, consisting of 620–2,949 ECRs with over 100,000 state transitions. Due to data privacy reasons, fictional status names and numbers were introduced into the matrix, but they still reveal similar information. The Markov chain model is a transition probability matrix with element ( $x,y$) in the table, where x is the row and y is the column representing the probability that an ECR transitions to state y when it is situated in state $x$. For example, in Figure 5, there is a probability of 99.1% for an ECR transitioning to state 10 ( $x$-axis) when the ECR has state 1 ( $y$-axis).
There are 15 ECR process states used in the Markov chain DSM that are organized into three categories. Each state has a numerical name and description where the first numerical digit indicates which states belong to the same category.
6 Results
The results are structured into two parts: The first part shows matrices that visualize ECR status sequences within four projects; the second part focuses on pattern identification with a key user.
6.1 Markov chain DSM estimated from data and visualized in a matrix for sequence
Figures 5–8 present a Markov chain DSM visualizing sequences for four single projects with the number of ECRs ranging from 619 to 2,992. By comparing the matrices for different projects, we can identify the most common sequences for ECRs as well as deviations from what the company considers as best working practices. The sequence can be read out by starting at state 1 on the  $y$-axis and reading the highest probability for a transition to another number on the $x$-axis.
If we then repeat the above process for project A in Figure 5, for instance, but start from the next state on the  $y$-axis that had the highest previous probability, we can trace the most likely path ending at state 39. The most common pathway is, therefore, as follows: $1\rightarrow 10\rightarrow 19\rightarrow 3\rightarrow 31\rightarrow 39$. The #symbol to the most right on the $y$-axis represents the number of documents for that specific line. Reading 619 for state 1 means that 619 ECRs were written, having state 1 as initial state. Moreover, ECRs can take on an earlier status after progressing forward, which means they can loop in the matrix. This can be observed when the number of ECRs is compared on the $y$-axis for states 1 and 10 as state 10 has more ECRs recorded to sequence in state 10 than initially in state 1.

Figure 5. Sequence visualization for project A with 619 ECRs.

Figure 6. Sequence visualization for project B with 1,056 ECRs.

Figure 7. Sequence visualization for project C with 2,952 ECRs.

Figure 8. Sequence visualization for project D with 2,992 ECRs.
6.2 Pattern identification with a key user
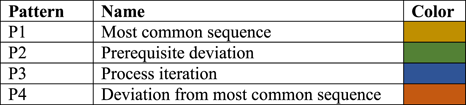
An evaluation was done together with a key user who has domain knowledge about how the process is supposed to be used and who can identify areas of interest in the process. The key user with domain knowledge was asked to draw conclusions based on his or her expertise to generate facts and patterns in the ECR process. Patterns were marked with the letter ‘P’ and a number in the figures based on how many they were. In Table 4, patterns were given names and were color-coded for visual purposes; the colors do not have deeper meaning.
(i) Pattern P1 shows the most common way the ECRs sequence through statuses; 1 $\rightarrow$ 10 $\rightarrow$ 19 $\rightarrow$ 3 $\rightarrow$ 31 $\rightarrow$ 39. Projects A, B, and D follow this pattern, whereas project C follows pattern P4. Notably, it is more common to transition to 3 instead of 19 from 10. This is a process deviation similar to the initial state 19 following state 10.
(ii) Pattern P2 highlights a column with the probability for statuses 31 and 35, which statuses 1–22 can transition into. According to a key user, status 3 is always a prerequisite for using statuses 31 and 35. Therefore, statuses 1–22 should go through status 3 before transitioning to any status higher in that group.
(iii) Pattern P3 was only found in project B, but we see iterations in the ECR process when ECRs transition from states 10 to 11, 19, 3, and 31; a small amount of them transition back to status 10. There are four iteration loops that take place early in the process around status 10.
(iv) Pattern P4 is a deviation pattern from P1, where project C deviates from the most common patterns such as that in projects A, B, and D.


Table 4. Descriptive name and color for each pattern
6.3 Comparison of projects
Table 5 shows the interaction of projects and their pattern for benchmarking where we observe the following:
(i) Projects have two to three patterns each.
(ii) P3 and P4 are unique for specific projects.
(iii) P2 is common for all.
(iv) P1 is common for all, except project C.
Table 5. Interaction of projects and patterns
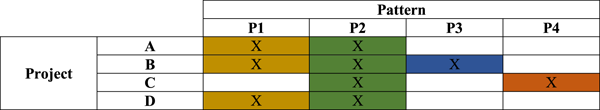
Figure 9 presents the average DSM for all the four projects in this study. Notably, only patterns P1 and P2 are visible in the figure. However, the probability of state 10 to sequence to states 19 and 3 is almost the same since pattern P1 should be the dominant sequence, and P4 is a process deviation. Pattern P4 appears, therefore, to be isolated to Project C but on the edge of taking place in other projects. Meanwhile, pattern P3 is not visible in the average DSM and seems to be isolated to Project B since the probability of sequences in the iteration is so small that they fade out in a larger dataset.

Figure 9. Sequence visualized for all the four projects in one DSM with 7,619 ECRs.
7 Discussion
This study shows how the Markov chain DSM can be used to model and analyze real design processes, focusing on what conclusions and improvement opportunities can be obtained with such a model. The aim is to identify patterns and benchmark lead time from ECRs that are difficult to analyze on a case-by-case level. Using an ad hoc approach, such as DSM, can contribute to improvements in the product development process. The usage of Markov chain modeling can be generalized for other ECRs since ECRs are widely used in industry, and any shortcoming in relation to such would be on gathering the data for data sources.
It has been shown by empirical studies that working with new or re-designs of product is an iterative process, as concepts are developed, tested, and iterated (Giffin et al. Reference Giffin, de Weck, Bounova, Keller, Eckert and Clarkson2009; Wynn & Clarkson Reference Wynn and Clarkson2017). Traditional management principles like standardized State-Gate process (Cooper Reference Cooper2008) with a waterfall approach try to minimize ECRs with a structured processes (Sommer et al. Reference Sommer, Hedegaard, Dukovska-Popovska and Steger-Jensen2015), but still many ECRs are managed in complex development projects (Giffin et al. Reference Giffin, de Weck, Bounova, Keller, Eckert and Clarkson2009). Currently Agile processes (Beck et al. Reference Beck, Beedle, Van Bennekum, Cockburn, Cunningham, Fowler, Grenning, Highsmith, Hunt, Jeffries and Kern2001) are becoming more accepted, as research shows performance improvement within companies who rely more on frequent iterative intensive processes like Agile or Agile/Stage-Gate Hybrids (Sommer et al. Reference Sommer, Hedegaard, Dukovska-Popovska and Steger-Jensen2015; Lindlöf & Furuhjelm Reference Lindlöf and Furuhjelm2018; Söderqvist, Lindlöf & Trygg Reference Söderqvist, Lindlöf and Trygg2019).
Standardized ECR processes will be needed in both State-Gate and Agile, as iterations are ubiquitous in product development. ECRs are dealt with frequently in the Agile process; hence, regardless of companies working according to Agile or State-Gate, ECRs are a key sub-process in the product development process. The consequences might be that more frequent synchronization points like by-weekly Agile schedule would generate more ECRs but possibly more minor ECRs with shorter resolution times due to the time pressure from more frequent synchronization points. Because if they would not be solved within the next sprint duration ECRs would queue up; so change requests in Agile need to be run differently than in State-Gate.
Given the data in the matrices many patterns can be explored. The selection of the four most interesting patterns further discussed in the paper was based on the highest probability and validated in consultation with a company process expert, who confirmed that these were most important from the company’s perspective.
The following sections answer the research questions given the findings of this study:
7.1 What patterns can be observed in a single project?
Markov chain DSM sequence matrices for a single project can be used to understand the sequence of ECRs through the different ECR states. It can be used to directly draw conclusions by noting common patterns or finding anomalies (see Figures 4 to 7).
By analyzing patterns in a single project one by one, we note that most projects have two or three patterns, identify the most common sequence through project states (i.e., P1 and P4), determine process issues where certain states are considered prerequisites and are skipped (i.e., P2), and observe process iterations where states loop back to a previous state (i.e., P3).
The limitation of examining a single project is that one cannot benchmark between other projects, and therefore cannot tell what the most common way of working is.
7.2 What patterns can be observed comparing multiple projects?
An even more powerful utilization of the Markov chain DSM is that it makes it possible to compare sequence matrices for different projects in the organization and identify differences in work sequences. We found that by creating matrices for more than one project at a time generates a holistic overview of the process, and the visualization provides a way to benchmark patterns between projects.
We can, therefore, confirm that pattern P1 is the most common way of working and pattern P4 is a process deviation. Pattern P2 occurs in all projects and indicates that some do not follow the flowchart regarding how to work with ECRs in different stages of the process. Meanwhile, pattern P3 only happens in one project and shows process iterations that indicate some rework.
7.3 What improvements can these observations lead to?
After an ECR has been created (i.e., state 1) and distributed (i.e., state 10), the next sequence should be to assign a correct solving responsible (i.e., status 19) before sequencing into the investigation phase, beginning with state 3. This is the correct way of working, and this is confirmed by benchmarking the most common way of working between the projects. As can be seen in project C (i.e., pattern P4), the next probable action when distributing an ECR is that the confirmation of a solving responsible is skipped, and the ECR proceeds directly to the identification of possible solution. This process deviation implies a risk that a correct solving responsible is not assigned to a responsible person leading the ECR identification of a possible solution. This is fairly early in the ECR process states, where it is known that most ECRs should follow the same pathway. However, there is room for improvement to make sure that everyone is consistent in his or her work and follows pattern P1 instead of pattern P4.
The key user affirmed that ECRs should always sequence to state 3 before state 31, as the former is a prerequisite for the latter. This means that all states from 1 to 22 should never sequence to 31 as can be observed in all projects in pattern P2. For example, when an ECR has reached solving responsible (i.e., state 19), the common process is to identify a possible solution (i.e., state 3) as the next state but not to assess that solution (i.e., state 31). Announcing that work has started it needs to take place before the assessment of the solution. Anything else is a process issue that should be improved.
Pattern P3 shows iterations in the sequence process where states return to a previous state. Project B has four iterations, but this is not the case in the other projects. These iterations all start in state 10, and after sequencing to states 11, 19, 3, and 31, they sequence back to state 10. Based on the known fact that process changes can be costly, one can assume that the same applies for iterations in the process. Why only one project has process iterations is unknown, but it is worth investigating whether handling ECRs can be done correctly from the start such as in projects A, B, and D.
7.4 What are the efforts, benefits, and limitations of using Markov chains for ECR analysis?
Any version of Python can be used as software for the implementation of the Markov chains DSM. General skills or background as data scientist or analyst is needed to implement and create the DSM. The Markov Chain DSM has a data dependency from the ECR reports, which is the timestamps (date and time) of each state transition during the resolution process. In and out time of each state can therefore be calculated for all states during the resolution process of an ECR report. Then data cleaning and compiling efforts are needed, and this usually takes less than a week. Although creating the model from data entails less than a day, ample time is needed to implementing it. Adjusting the axis labels and representation can take long, depending on the desired outcome. Furthermore, there are other aspects that can be considered as user friendly so that anyone can upload data and run the model.
The benefit of using such a DSM for ECR sequence analysis is that the sequence of states can be compiled in a holistic visual representation that reveal patterns about sequences in a project.
There are also limiting factors that must be considered. First, it is usually not enough to merely create the model; domain knowledge must also be applied in the analysis process. Second, key users with domain knowledge are needed for the evaluation of patterns; the said key users can pinpoint patterns that are interesting for their work. Last, by using Markov chains, one assumes that the Markov property (i.e., memoryless) holds for the ECRs. An initial analysis indicates that in most cases this property will hold, but there are scenarios where the entire path up to a specific state can affect the probability of transitioning to new states. However, if the matrices are only utilized for analysis (and not for simulating processes) this is not an issue.
8 Conclusions & future work
This study clearly shows that modeling ECR data with the Markov chain DSM can be done, and that the results are useful for analyzing the sequences of ECRs. We used four different project DSMs that, in turn, identified four patterns as key results. First, the DSM identified the most common sequence for states within an ECR. Second, there is a tendency to skip state 3 (i.e., identification of solution) and sequence straight to state 31 (i.e., assessment of solution), which is a process deviation. Third, it is possible to identify iterations occurring in the sequence process, which means that we are able to see loops in the DSM, where ECRs sequence back to an earlier point. Notably, the DSM can be used to point out iterations; as such, we can ask the engineers why they occur and how we can possibly prevent states from sequencing back to improve how we work with ECRs. Last, the model helps to identify deviation from the most common sequence of ECRs as there is a tendency to skip state 19 (i.e., ECR with solving responsible), which is the most common way of working, and sequence instead to state 3 (i.e., identification of solution).
The key results show that the Markov chain DSM is beneficial in analyzing the ECR process. It is possible to closely examine the sequences and improve the handling process for ECRs so that they follow the intended way of working. Accordingly, certain sequences should be made mandatory to ensure the correct process flow as recommended by the key users.
Future research includes developing a simulation module where one can utilize the Markov chain models for predicting how specific ECRs will transition in the future. Such a module can be utilized during a product development project for detecting issues that, for example, are predicted to be troublesome (i.e., not solved within a specified limit).
Giffin et al. (Reference Giffin, de Weck, Bounova, Keller, Eckert and Clarkson2009) showed that more complex components yield a higher number of necessary changes needed to be made. It would be interesting to analyze which component or element are more suitable for a change or have higher influence on transition probabilities. But the data does not allow the analysis of susceptibility to change a component as we do not have any component DSM data with parts that have changed. This is outside the scope of the current paper but an interesting area for future work to combine a component DSM with a process DSM.
It is a possibility to analyze ECR according to severity levels as this data is available. The DSMs could be filtered based on small, medium, or large changes based on logged severity level and further explore if there are differences in ECR patterns for small, medium, and large cases.
It would also be interesting to apply additional metrics to the Markov chain model, for example, that measure in- and out-degrees. Then states with a high out-degree could be seen as hubs in the transition process, giving further insights into the Markov chain matrix. Matrices could also be filtered on sub-levels like components, design groups, or function groups to see if additional patterns emerge. A user-friendly GUI is also being developed in which the Markov chain DSMs can be visualized and analyzed.
Financial support
The financial support of AB Volvo and the Swedish Governmental Agency for Innovation (Vinnova, grant number 201703059) is greatly acknowledged. This study was conducted within the Vinnova Vinnex Excellence Center for Product Realization and the Production Area of Advance at the Chalmers University of Technology.


 Open access