


Large- or real-scale (full-scale) disposal tests with simulated heaters are essential for the development of suitable barrier systems for the encapsulation of high-level radioactive waste (HLRW). They are required both to validate the safety functions and to investigate the processes taking place after closure of the repository. Worldwide, only a few heated real-scale tests have been launched: the prototype repository experiment in crystalline rock at Äspö, Sweden (Johannesson et al., Reference Johannesson, Börgesson, Goudarzi, Sandén, Gunnarsson and Svemar2007; Dohrmann & Kaufhold, Reference Dohrmann and Kaufhold2014; Svemar et al., Reference Svemar, Johannesson, Grahm, Svensson, Kristensson, Lönnqvist and Nilsson2016), the PRACLAY experiment in Boom Clay at the HADES rock laboratory in Belgium (Bernier et al., Reference Bernier, Li and Bastiaens2007), the ALC (full-scale demonstrations experiment at Bure URL) experiment in Callovo-Oxfordian Clay at ANDRA's rock laboratory in France (Gugala, Reference Gugala2015), the recently installed FE experiment (full-scale emplacement experiment) in Opalinus Clay at Mont Terri in Switzerland (Müller et al., Reference Müller, Garitte, Vogt, Köhler, Sakaki, Weber, Spillmann, Hertrich, Becker, Giroud, Cloet, Diomidis and Vietor2017) and the FEBEX test investigated in the present study.
Previous large and full-scale experiments demonstrated that corrosion, mineral dissolution and precipitation, Mg enrichment at the heater and cation exchange occur across the whole bentonite barrier. The cation exchange capacity (CEC) is probably the most important parameter for evaluating the performance of a barrier in crystalline rocks because it reflects the swelling capacity of the bentonite and may be determined with comparatively high precision. Most dissolution/precipitation reactions (involving e.g. carbonates, sulfates, selected silicates) and cation exchange may be explained based on geochemical modelling (Arcos et al., Reference Arcos, Bruno, Benbow and Takase2000; Wallis et al., Reference Wallis, Idiart, Dohrmann and Post2015). The mechanisms behind corrosion and Mg enrichment, in contrast, are still under discussion (Kaufhold et al., Reference Kaufhold, Sanders, Dohrmann and Hassel2015, Reference Kaufhold, Dohrmann and Ufer2016). The Mg enrichment is particularly interesting because the possible Mg source (incongruent smectite dissolution and/or cation exchange) is related to the chemical stability of smectite, and the type of alteration product (saponitic smectite, brucite or other Mg-silicates) determines the local performance (e.g. swelling capacity) of the barrier.
The ‘full-scale engineered buffer experiment’ (FEBEX) was the first full-scale test of a horizontal disposal system for HLRW (Lanyon & Gaus, Reference Lanyon and Gaus2015). It consisted of two heaters embedded in compacted bentonite blocks. The heater of the FEBEX experiment started operating in 1997. The first parts of the experiment were removed in 2002 (partial dismantling; Huertas et al., Reference Huertas, Fariña, Farias, García-Siñeriz, Villar, Fernández, Martin, Elorza, Gens, Sañchez, Lloret, Samper and Martínez2006). Details about the experiments have been summarized previously (e.g. Fernández et al., Reference Fernández, Cuevas and Rivas2001; Lanyon & Gaus, Reference Lanyon and Gaus2013; Fernández, Reference Fernández2017; Garralón et al., Reference Garralón, Gómez, Peña, Buil, Turrero, Torres and Sánchez2017). The second heater was dismantled in 2015 (García-Siñeriz et al., Reference García-Siñeriz, Abós, Martínez Leon, De la Rosa, Mäder and Kober2016) after 18 years of operation at 100°C. A full monitoring account of the FEBEX experiment was compiled by Martinez et al. (Reference Martinez, Abós and García-Siñeriz2016).
The varying performance of bentonite samples retrieved from part 1 of the FEBEX test may be explained by the various hydration and temperature gradients in the bentonite in contact with the granite (Huertas et al., Reference Huertas, Fariña, Farias, García-Siñeriz, Villar, Fernández, Martin, Elorza, Gens, Sañchez, Lloret, Samper and Martínez2006; Villar et al., Reference Villar, Fernández, Rivas, Lloret, Daucausse, Montarges-Pelletier, Devineau, Villieras, Hynková, Cechova, Montenegro, Samper, Zheng, Robinet, Muurinen, Weber, Börgesson and Sandén2006; Lloret & Villar, Reference Lloret and Villar2007; Villar & Lloret, Reference Villar and Lloret2007). The investigation of the proceeding hydration, therefore, was of particular interest in the second part of the project. The aim of the present study is to investigate the cation exchange reactions and the geochemical and mineralogical reactions taking place at various interfaces and selected sampling sites and finally to identify the geochemical and mineralogical changes to the bentonite caused by the heater and inflowing water over 18 years of operation.
MATERIALS AND METHODS
Samples
Samples were taken from various sections of the FEBEX experiment, focusing on interfaces (e.g. cement/shotcrete–bentonite, iron–bentonite; García-Siñeriz et al., Reference García-Siñeriz, Abós, Martínez Leon, De la Rosa, Mäder and Kober2016). The cement/shotcrete was characterized by Huertas et al. (Reference Huertas, Fariña, Farias, García-Siñeriz, Villar, Fernández, Martin, Elorza, Gens, Sañchez, Lloret, Samper and Martínez2006). In addition, four radial profiles in the bentonite buffer were sampled without interfaces. The samples were drilled either from blocks from interfaces or from cores (Fig. 1). Interface samples were collected by scratching off the surface with a sharp knife. The samples were sealed in aluminium foil. In addition, some specific samples were collected (Fig. 2) from macroscopically interesting sample sites (black material from liner surface, reddish clay in the holes of the liner).
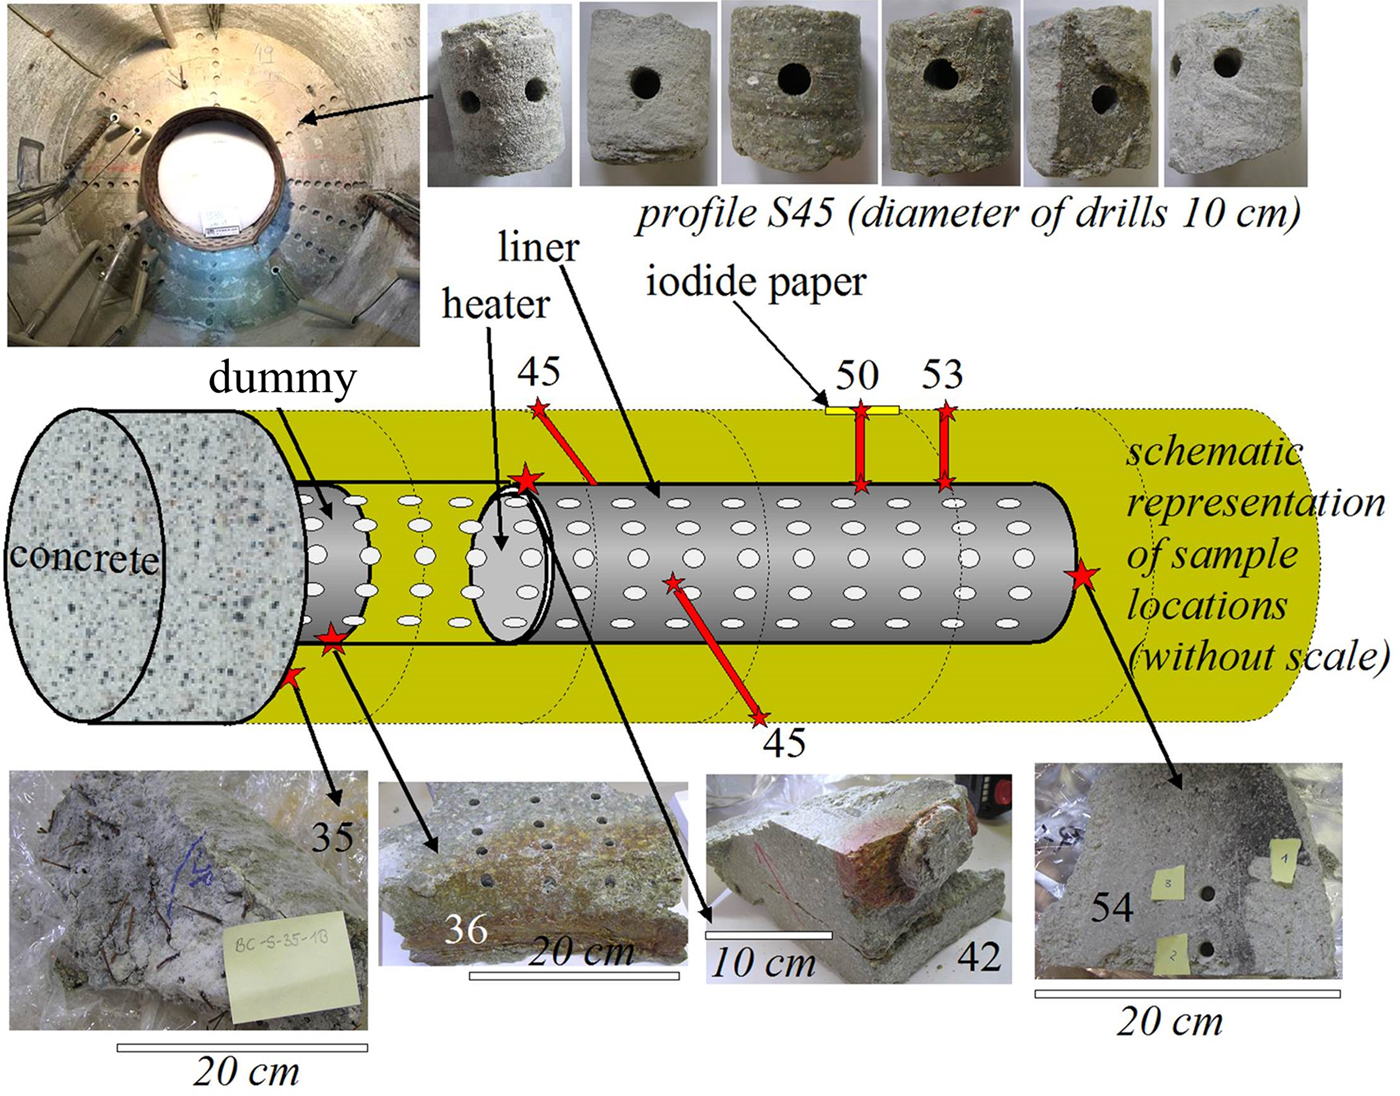
Fig. 1. Schematic representation of sample locations (various interfaces and four profiles). For a full dismantling and sampling layout, see García-Siñeriz et al. (Reference García-Siñeriz, Abós, Martínez Leon, De la Rosa, Mäder and Kober2016).
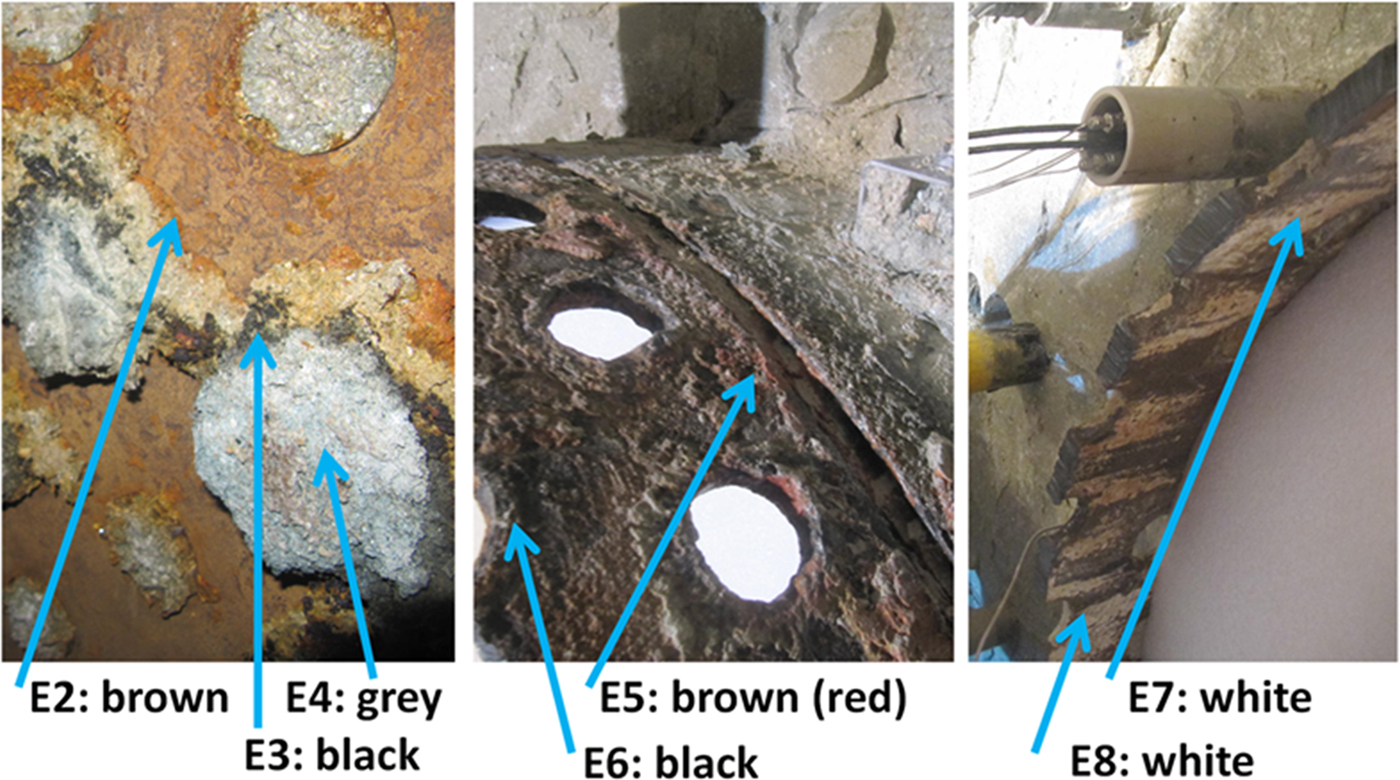
Fig. 2. Sampling of special interfaces of the FEBEX experiment. These samples were not official FEBEX samples, but were taken from surfaces that had undergone geochemical reactions according to visual inspection. Samples were collected according to the colours observed in the field. E = extra.
Methods
The geochemical composition of the samples was determined by wavelength-dispersive X-ray fluorescence spectroscopy (XRF), elemental C- and S-analysis (LECO, USA) and CEC including exchangeable cations (ECs). Selected samples were also analysed by X-ray diffraction (XRD), scanning electron microscopy (SEM), infrared (IR) spectroscopy and simultaneous thermal analysis (STA) coupled with a mass spectrometer (MS) to study the composition of the evolved gas.
For XRF analysis of powdered samples, a PANalytical Axios spectrometer was used (ALMELO, The Netherlands). Samples were prepared by mixing with lithium metaborate (Spectroflux, Flux No. 100A, Alfa Aesar) and melting into glass beads. The loss on ignition (LOI) of the samples was determined by heating 1000 mg of the materials at 1030°C for 10 min.
The total organic carbon (TOC) content was determined with a LECO CS-444 analyser after dissolution of the carbonates. Carbonates were removed by treating the samples several times at 80°C with HCl until no further gas evolution was observed. Aliquots of 170–180 mg of the dried materials were used to measure the total carbon (TC) content. Total inorganic carbon (TIC) was calculated as the difference between TC and TOC. The samples were heated in the device to 1800–2000°C in an oxygen atmosphere (LECO 3000) and the CO2 was detected by an IR detector.
The CEC was measured using the Cu-triethylenetetramine (Cu-trien) method (Meier & Kahr, Reference Meier and Kahr1999). The FEBEX samples were analysed using 30 mL Cu-trien solution and no additional water. Two different sample masses were analysed and average values were calculated. After Cu-trien saturation, the solutions were centrifuged to sediment the bentonites, and the supernatant solutions were diluted and analysed using inductively coupled plasma–optical emission spectrometry (ICP-OES; Thermo Scientific ICAP 6300 DUO ICP-OES, Thermo Fisher Scientific, USA) to measure the ECs and Cu for the calculation of CEC values. For ICP-OES analysis, the following parameters were used: argon radial plasma, nebulizers (cross-flow and modified Lichte), no auxiliary gas flow, gain value for plasma (1.400 W) and calibration every seventh measurement. The Cu-trien complex concentration was also analysed using visible (VIS) spectroscopy (Jenway 6200, Cole-Parmer, UK) to cross-check the ICP-Cu concentration. Each CEC value was calculated by averaging four single CEC values (two from ICP analysis and two from VIS spectroscopy). Each EC value was calculated by averaging only two single EC values measured using ICP. The error (±3σ) in values determined using the Cu-trien5×calcite method for bentonites (Dohrmann & Kaufhold, Reference Dohrmann and Kaufhold2009) is different for various cations and the CEC. The scattering is lowest for K+ (±0.3 meq/100 g), followed by Mg2+ (±0.8 meq/100 g), Ca2+ (±0.8 meq/100 g), Na+ (±1.9 meq/100 g) and the total CEC (±3.1 meq/100 g). These values may be used to evaluate approximately the accuracy in this study.
The XRD powder traces of the samples were recorded with a PANalytical X'Pert PRO MPD θ-θ diffractometer (Co-Kα radiation generated at 40 kV and 40 mA), equipped with a variable divergence slit (20 mm irradiated length), primary and secondary Soller, diffracted beam monochromator, point detector and a sample changer (sample diameter 28 mm). The samples were investigated from 1° to 80°2θ with a step size of 0.03°2θ and a measuring time of 5 s per step. For specimen preparation, the back-loading technique was used. The XRD traces were used for Rietveld refinement with the BGMN code. Refinements were performed according to Ufer et al. (Reference Ufer, Stanjek, Roth, Dohrmann, Kleeberg and Kaufhold2008).
Oriented XRD mounts (texture slide XRD) were prepared using 15 mg/cm2 clay. An aliquot of 1.5 mL of suspension was deposited on circular (diameter = 2.4 cm) 3 mm-thick ceramic tiles. The suspensions were filtered through the tile using a vacuum filter apparatus. X-ray diffraction patterns of the oriented mounts were recorded with the same diffractometer as the bulk powder samples The air-dried and ethylene glycol (EG)-solvated (60°C overnight) samples were investigated from 1° to 40°2θ with a step size of 0.03°2θ and a counting time of 6 s per step.
For SEM investigation, a FEI Quanta 600 F scanning electron microscope operated in low-vacuum mode (0.6 mbar) was used, without prior sputtering of the samples with gold or carbon. The microscope was equipped with the EDX system Genesis 4000 of EDAX. A freshly broken surface of the unprocessed air-dried sample was fixed on a carbon grid and used for SEM inspection.
Mid-IR (MIR) spectra of the samples were obtained with the KBr pellet technique (1 mg sample/200 mg KBr). Spectra were collected on a Thermo Nicolet Nexus (USA) Fourier-transform IR spectrometer (MIR beam splitter: KBr detector DTGS TEC; deuterated triglycine sulfate detector and thermoelectricity cooled) with a resolution of 2 cm–1. Measurements were conducted before and after drying of the pellets at 150°C in a vacuum oven for 24 h.
Simultaneous thermal analyses were performed with a Netzsch 449 F3 Jupiter thermobalance (Germany) equipped with a DSC/TG (diffferential scanning calorimetry/thermal gravimetry) sample holder linked to a Netzsch QMS 403 C Aeolus MS. A total of 100 mg of powdered material previously equilibrated at 53% relative humidity (RH) was heated from 25 to 1150°C with a heating rate of 10°C/min.
The water content was determined gravimetrically after drying for 1 week at 60°C.
RESULTS AND DISCUSSION
Database and reference
All results that are discussed below are summarized in Tables 1 and 2. Geochemical and mineralogical changes of the bentonite caused by the heater and inflowing water over 18 years of operation may be identified only if reliable reference data of the bentonite before the experiment are available. Most of the changes identified in other large-scale tests, however, were restricted to the contacts with the hot metal or with the cement (Dohrmann et al., Reference Dohrmann, Olsson, Kaufhold and Sellin2013, Reference Dohrmann and Kaufhold2017; Kaufhold et al., Reference Kaufhold, Dohrmann, Sandén, Sellin and Svensson2013, Reference Kaufhold, Dohrmann, Götze and Svensson2017). Therefore, reference data may also be obtained from material derived from the centre of the blocks taken at a distance from the interfaces. For such samples, however, cation exchange has to be taken into account.
Table 1. Mineralogical and chemical characterization of the interfaces sampled for the present study.

0.0 means <0.5 mass% (few but present).
aSignificant changes of the parameter compared to initial values. These are discussed in the text.
Table 2. Geochemical data of the four profiles (sections 45 [two profiles], 50, 53) investigated in the present study.

Table 2. (contd.)

For the present study, none of the originally used bentonite was available as a reference material. Therefore, the FEBEX bentonite used for the ABM test (Alternative Buffer Materials; Dohrmann et al., Reference Dohrmann, Olsson, Kaufhold and Sellin2013; Kaufhold et al., Reference Kaufhold, Dohrmann, Sandén, Sellin and Svensson2013) was used as ‘FEBEXABM reference’ (sample before ABM test). The FEBEXABM CEC and EC reference data (Table 1) were compared with values determined by Fernández et al. (Reference Fernández, Cuevas and Rivas2001, Reference Fernández, Baeyens, Bradbury and Rivas2004), who studied the pore water of the FEBEX bentonite and concluded that an equivalent of ~0.13 mass% NaCl was present in the bentonite in excess of actually exchangeable Na+. This mass equals 2.3 meq/100 g exchangeable Na+, which was subtracted from the reference values to reflect only exchangeable Na+. Exchangeable Na+ values of the FEBEXABM reference (27 meq/100 g) were identical to those of Dohrmann et al. (Reference Dohrmann, Olsson, Kaufhold and Sellin2013), but slightly lower than those of Fernández et al. (Reference Fernández, Baeyens, Bradbury and Rivas2004) (29 meq/100 g). Dohrmann et al. (Reference Dohrmann, Olsson, Kaufhold and Sellin2013) studied the FEBEXABM reference clay using the so-called ‘Cu-trien5×calcite’ method in which the exchange solution was pre-saturated with respect to calcite in order to avoid further calcite dissolution during the CEC experiment. These authors reported 7 meq/100 g less exchangeable Ca2+ caused by the presence of partly soluble Ca phases. In addition to the FEBEXABM reference, 22 of those samples investigated in the present study were selected and the values averaged to calculate a ‘FEBEX22 reference’. These 22 samples were taken at a distance of >10 cm from the heater and from the granite, and the average values of the FEBEX22 reference samples showed no variation with respect to the chemical composition and exchange quantities.
The carbonate content of the ‘FEBEX22 reference material’ based on XRD Rietveld analysis (calcite 1 mass%) was in good agreement with the LECO data (0.1 mass% C, which corresponds to 0.8–0.9 mass% calcite), whereas the difference of 7 meq/100 g exchangeable Ca2+ indicates calcite content of ~0.3 mass%. Fernández & Villar (Reference Fernández and Villar2010) reported 0.60 ± 0.13 mass% calcite plus dolomite (taken from Fernández et al., Reference Fernández, Baeyens, Bradbury and Rivas2004). It is not clear whether these differences might be explained by uptake of HCO3– during water uptake followed by precipitation of calcite in the FEBEX22 reference material. The evolved gas analysis of thermally induced gases indicated the presence of at least traces of a sulfate mineral, but sulfides were not identified (<0.01 mass%). The K2O content may be explained by 5 mass% K-feldspar resulting in ~0.85 mass% K2O and some exchangeable K+ in the smectite or illite layers (~0.14 mass% K2O).
FEBEX bentonite as used in the ABM test in Äspö contains smectite with varying hydration states when analysed in air-dried conditions. This might be described as interstratification of smectites with varying numbers of water layers. The coexistence of varying hydration states is a common phenomenon of smectites (Ferrage et al., Reference Ferrage, Lanson, Sakharov and Drits2005). Exchangeable Mg2+ values of the FEBEXABM reference (38 meq/100 g) were approximately identical to those reported by Dohrmann et al. (Reference Dohrmann, Olsson, Kaufhold and Sellin2013) (37 meq/100 g), but larger than those of Fernández et al. (Reference Fernández, Baeyens, Bradbury and Rivas2004), who used Ni(en) (34 meq/100 g) and Cs+ (32 meq/100 g) index cations for extraction. Overall, the chemical data confirm the mineralogical composition determined by Rietveld analysis. The results are in good agreement with those published by Lanyon & Gaus (Reference Lanyon and Gaus2013), for example, except for the varying feldspar contents. The Rietveld refinement yielded 14 mass% feldspar, while ~3 mass% had been reported in previous studies. For quantification of the mineralogical composition, Rietveld analysis was performed using the same parameters for all samples. This is the prerequisite for a possible identification of differences of samples based on quantitative XRD.
Cement (shotcrete)/bentonite
Samples taken at the contact with the cement (shotcrete) interface (two samples each representing ~20 cm2 interface) showed an increase of MgO, C and S (Table 1, BC-S-35 samples). In addition, a marked decrease of the CEC was found for the 0.1 cm samples. These were investigated using XRD, IR spectroscopy and STA and were compared with the reference (Fig. 3). In the contact samples, a new band at ~3698 cm–1 was observed (Fig. 3a). This band may be attributed either to brucite (Mg(OH)2) or to kaolinite or even to a different Mg-silicate-hydrate phase containing Mg(OH)2. At ~570 cm–1, a small shoulder was observed (spectral range not shown), which would point to brucite and hence would also explain the observed MgO increase. In the STA (MS curve m = 18; Fig. 3b), a new dehydroxylation peak at ~530°C was observed. This peak might also result from formation of either kaolinite or brucite (or Mg-silicate-hydrate phases).

Fig. 3. Mineralogical characterization of the cement/shotcrete contact sample. (a) IR spectra; (b) STA-MS curve; (c) XRD texture slide (air dried). Black = reference; red = BC-S-35-1b.
The XRD texture slide (Fig. 3c) confirmed the full expandability of the smectite and showed traces of illite-muscovite (~0.1 mass% according to the K2O increase) and some intensity at ~7 Å, which might be attributed to kaolinite. In addition, a broad peak was also observed pointing towards brucite, but based on this peak even Rietveld did not provide unambigous evidence for the existence of brucite. In summary, either kaolinite or brucite (or a similar phase) formed at the cement/shotcrete contact, along with carbonates and sulfates. According to Turrero & Cloet (Reference Turrero and Cloet2017), “the porewater conditions at the interface are favourable for the formation of Mg-rich precipitates.” All analyses (IR spectroscopy, LECO, STA) confirmed a slight increase in carbonate and sulfate contents, which might have resulted from the cement/shotcrete, which consists of silicates, carbonates and gypsum. At the contact (1 mm sample), a significant decrease in the CEC was observed (25–50%). Even at a distance of 1 cm, a CEC decrease of 5–10% was recorded (1 cm samples in Table 1). This might be explained by the pH effect on the CEC (caused by the cement/shotcrete) because the CEC increases with increasing pH. The CEC decrease, therefore, points either towards smectite alteration or towards a dilution effect caused by the precipitation of cement phases in the bentonite pores.
The contact between bentonite and cement/shotcrete was also investigated by SEM (Fig. 4). A slightly brighter transition zone appeared in the backscatter electron images (Fig. 4a), which varied from a few hundred micrometres up to 1 mm in width. Within this transition zone, crystallization of fine particles was observed. Because of their small particle size, no reliable EDX data were obtained. In contrast, Turrero et al. (Reference Turrero and Cloet2017) observed a reaction zone of ~1 cm in which most of the mineral alterations were observed. In the sample investigated in the present study, microcracks were observed, in agreement with Turrero & Cloet (Reference Turrero and Cloet2017). The CEC indicated mineralogical alteration up to a distance of 1 cm from the contact. The reaction zone identified by SEM, however, was <1 cm. The reason for the CEC decrease at the 1 cm distance might be due to solid-state reactions (such as collapse of interlayers or cation exchange) that did not affect the clay microstructure and hence were not detected by SEM. Turrero & Cloet (Reference Turrero and Cloet2017) reported possible preferential fluid pathways that would explain changes in the pore-water composition, hence leading to cation exchange.

Fig. 4. SEM investigation of the cement/shotcrete bentonite interface. (a) and (c) represent different SEM investigation spots and (b) and (d) are close-ups showing the area marked by the squares in (a) and (c), respectively.
Iron/bentonite
The iron heater was surrounded by a perforated liner also made of iron (see e.g. Huertas et al., Reference Huertas, Fariña, Farias, García-Siñeriz, Villar, Fernández, Martin, Elorza, Gens, Sañchez, Lloret, Samper and Martínez2006). Some air was trapped between both iron elements. In the current disposal concepts, no such air-filled volumes exist. The contact samples taken from blocks 36 (liner/dummy) and 42 (liner/heater) showed reddish colours that corresponded to increased Fe2O3 contents. The XRD Rietveld refinement, STA and IR spectroscopy proved the presence of goethite (patterns and spectra not shown). The presence of goethite points towards oxic corrosion. The goethite/Fe2O3 increase was 2–3 mass% in the first millimetre of the bentonite. More information about corrosion was gained from the investigation of the ‘E samples’ (Table 1) that were collected at specific interfaces (see Fig. 2).
The MgO increases in the E samples were small despite the fact that the E samples were taken directly from or at least near the liner. Only a slight increase in MgO was observed in the grey material collected between the heater and liner. Samples E2, E3 and E5 showed elevated Fe contents. By far the largest Fe increase was recorded in sample E6. For samples E7 and E8 (white crust inside liner), marked increases of both C and CaO were detected, which might be explained by the presence of aragonite and reduced amounts of dolomite (Table 1). In sample E2 (reddish, scratched off the inside of the liner), goethite was detected by XRD. Except for a slightly lower carbonate content, samples E3 and E4 were similar to the reference. These samples probably swelled through the holes of the liner into the space between the liner and heater. Some of the carbonate was dissolved and apparently accumulated at the inner liner surface (samples E7 and E8). No newly formed Fe phases were observed in sample E3, although the Fe2O3 content increased by ~3 mass%.
In contrast, the black crust (sample E6) scratched off the liner contained siderite and magnetite, but also the primary components of bentonite (as smectite). Traces of native Fe were also detected in this sample, pointing towards an intimate intergrowth of both the metal surface and bentonite. For Rietveld refinement, it was advantageous to add a maghemite structure (which yielded a better fit). The actual presence of maghemite, however, is difficult to verify. Interestingly, sample E6 showed a 10 Å intensity that was described as muscovite in the XRD Rietveld analysis. Muscovite, however, was present in neither the bentonite nor the metal. Some smectite may have collapsed upon dehydration to 10 Å and hence was described as muscovite in the Rietveld refinement. It may also be that real muscovite formed, but the K content decreased, which would not correspond to the formation of muscovite. In the white crust, >30 mass% carbonates were detected by XRD, which was confirmed by both IR spectroscopy and STA (data not shown).
Interestingly no Fe2O3 increase was observed in the contact samples taken from block 54. This block was in direct contact with the heater and not with the liner, which means that little air was entrapped there that could have led to oxic corrosion. Anaerobic corrosion, on the other hand, which might be the dominant process affecting the heater in the long run, was not observed.
Mg increase
At the heater–bentonite interface, both an increase in the metal content (Cu or Fe) as well as an increase in the Mg content were observed in previous tests (Karnland et al., Reference Karnland, Olsson, Dueck, Birgersson, Nilsson, Hernan-Håkansson, Pedersen, Nilsson, Eriksen and Rosborg2009; Kaufhold et al., Reference Kaufhold, Dohrmann, Sandén, Sellin and Svensson2013; Svensson, Reference Svensson2015). These effects, however, were restricted to the contact and hence were only detectable in the contact samples. Yet metal corrosion and Mg increase have been observed at the same time, but to varying extents. In the contact sample of block 36, for example, an Fe2O3 increase of 4 mass% but no Mg increase was detected. The special history of this block was described by Wersin & Kober (Reference Wersin and Kober2016). A smaller Fe increase but a slightly larger MgO content was observed in one of the contact samples of block 42. The MgO increase, however, was insignificant (+0.5 mass%) and hence is not discussed further. A significant increase in the MgO content, however, was observed in the contact sample of block 54. This block was in direct contact with the heater surface and not with the liner as in the other samples. No signs of corrosion were detected, but the MgO content increased by 5.7 mass% (from 4.4 to 10.1 mass%), which is larger than the MgO increase reported from the ABM tests (Karnland et al., Reference Karnland, Olsson, Dueck, Birgersson, Nilsson, Hernan-Håkansson, Pedersen, Nilsson, Eriksen and Rosborg2009; Kaufhold et al., Reference Kaufhold, Dohrmann, Sandén, Sellin and Svensson2013, Reference Kaufhold, Dohrmann, Götze and Svensson2017; Svensson, Reference Svensson2015). This contact, therefore, was investigated in more detail to identify the Mg phase and to draw conclusions about the reaction mechanism. Two samples (BM-S-54-5B-1 and BM-S-54-5C-3; Table 1) were taken from the contact surface of block 54. In previous tests, the MgO increase was accompanied by the formation of trioctahedral domains that were detected by powder XRD (Fig. 5) and IR spectroscopy. The initially collected amount of sample from the block was not sufficient for XRD Rietveld analysis. A new sample, therefore, was taken and denoted as BM-S-54-1NH.

Fig. 5. XRD powder diffraction data of the reference (sample 21-FEB) and samples taken from the contact of block 54. The originally taken sample (BM-S-54-5B-1) was insufficient for XRD. Therefore, two new samples were scratched off the surface and denoted as BM-S-54-5B-1N and BM-S-54-5B-1NH (‘N’ = new).
For sample BM-S-54-5B-1 with the largest MgO increase, a new peak was found at 1.54 Å, which indicated the presence of trioctahedral domains or phases. In addition, a marked decrease of the CEC was observed (almost 40% for sample BM-S-54-5B-1). The amount of exchangeable Na+ decreased, while exchangeable Mg2+ increased. The XRD Rietveld refinement of the pattern shown in Fig. 5 revealed the presence of a trace of brucite in the contact samples. No clear reflection of brucite was observed, however. The presence of kaolinite was ruled out based on the oriented XRD mount (Fig. 6b).
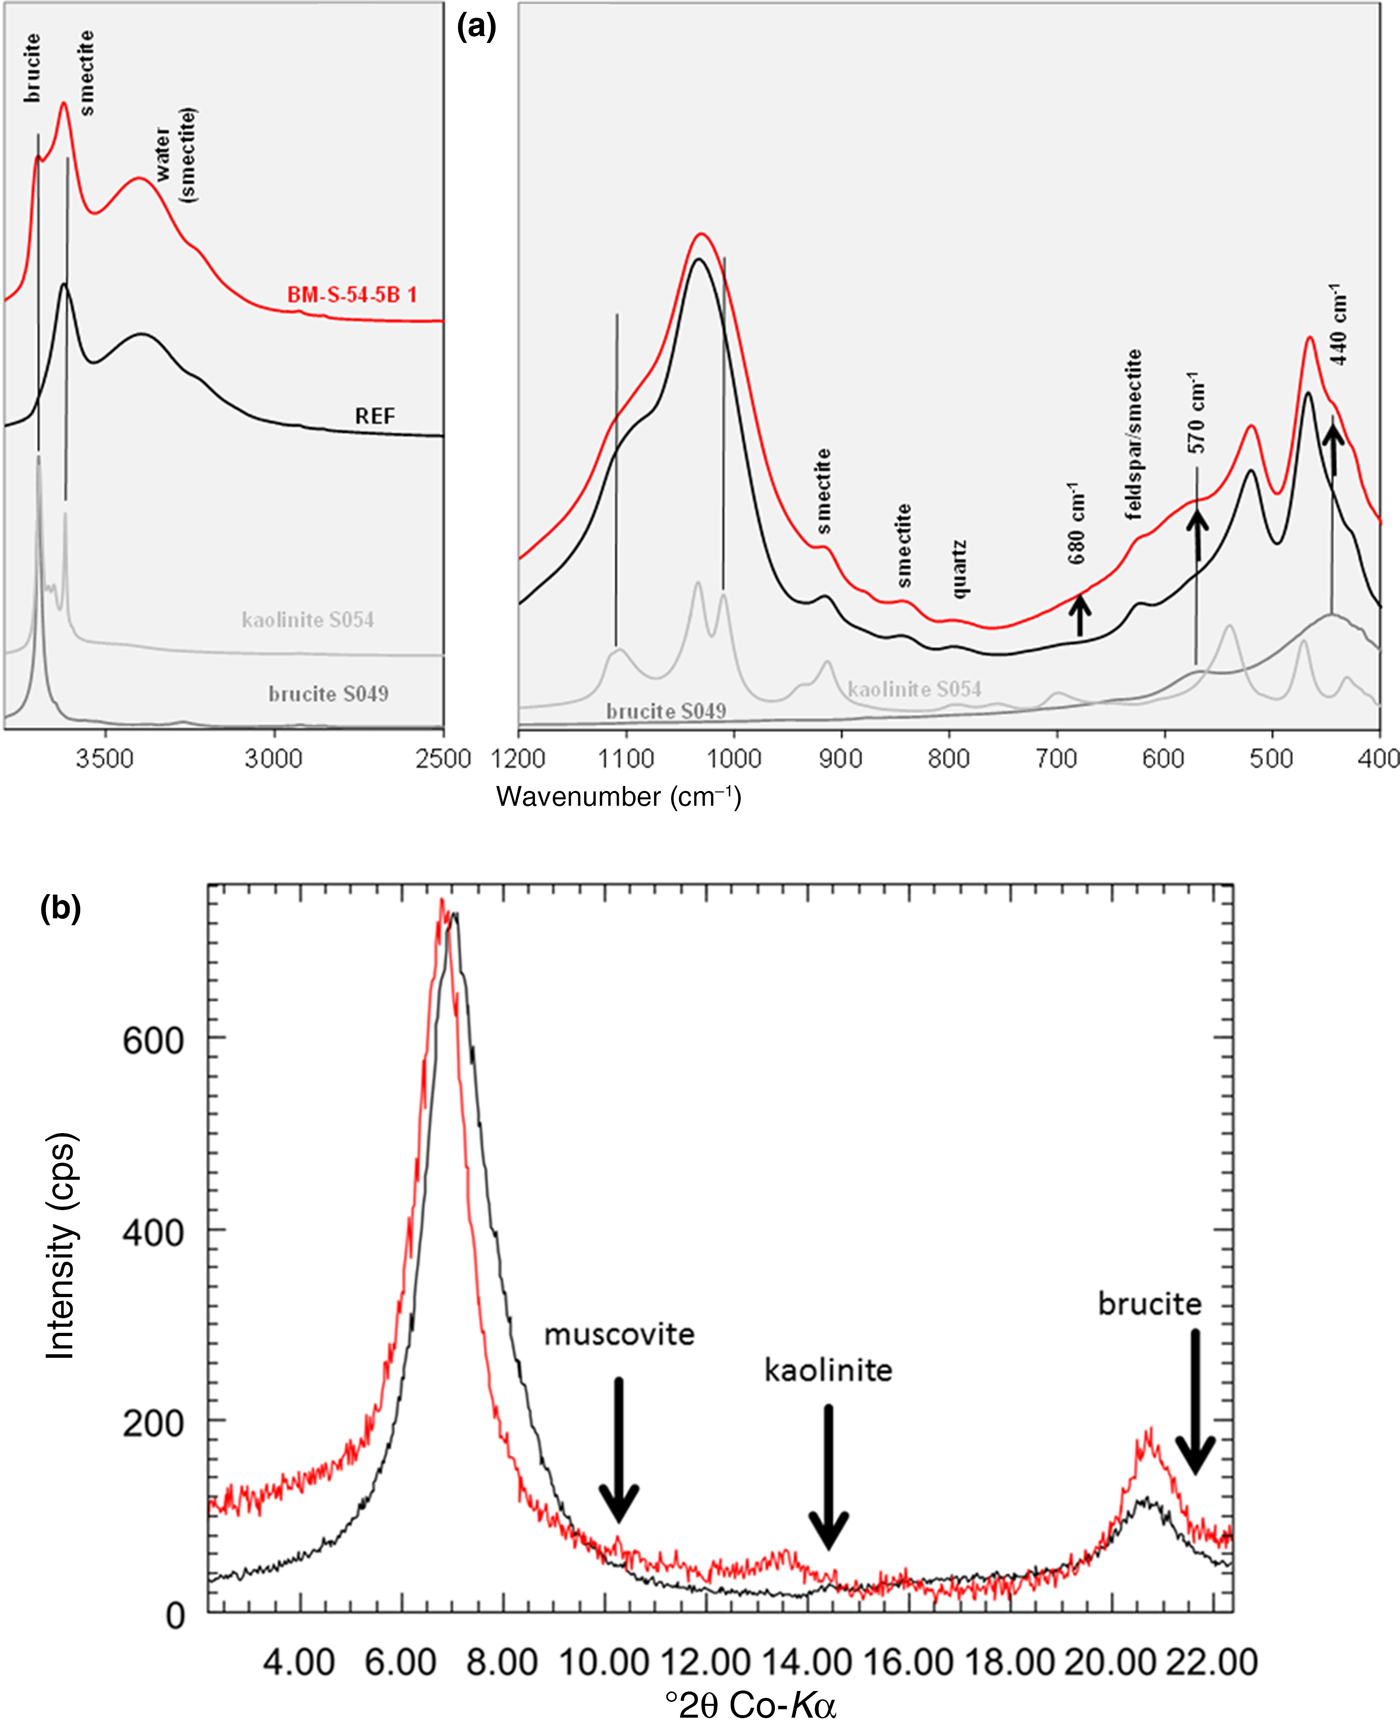
Fig. 6. IR spectrum (a) and XRD texture slide pattern (b) (air dried) of the reference material (black) and the contact sample BM-S-54-5B-1 (red).
The formation of brucite would explain the MgO increase, but not the presence of the 1.54 Å reflection (Fig. 5). Therefore, XRD indicated the formation of both brucite and trioctahedral sheet silicates. Interestingly, XRD Rietveld refinement did not reveal a decrease in the smectite content, although the CEC was markedly reduced. The expandability was proven by XRD, using texture slides (upon EG treatment, the peaks shifted to 17 Å; Fig. 7). A slightly lower value was found for sample BM-S-54-1NH (16.7 Å). This difference, however, does not allow the conclusion of reduced swelling capacity. Differences in the peak positions of the patterns were mainly caused by a small sample displacement error during XRD analysis. Both the reference and the contact sample show full expandability with EG. The intensity differs, however, which points towards varying degrees of preferred orientation.
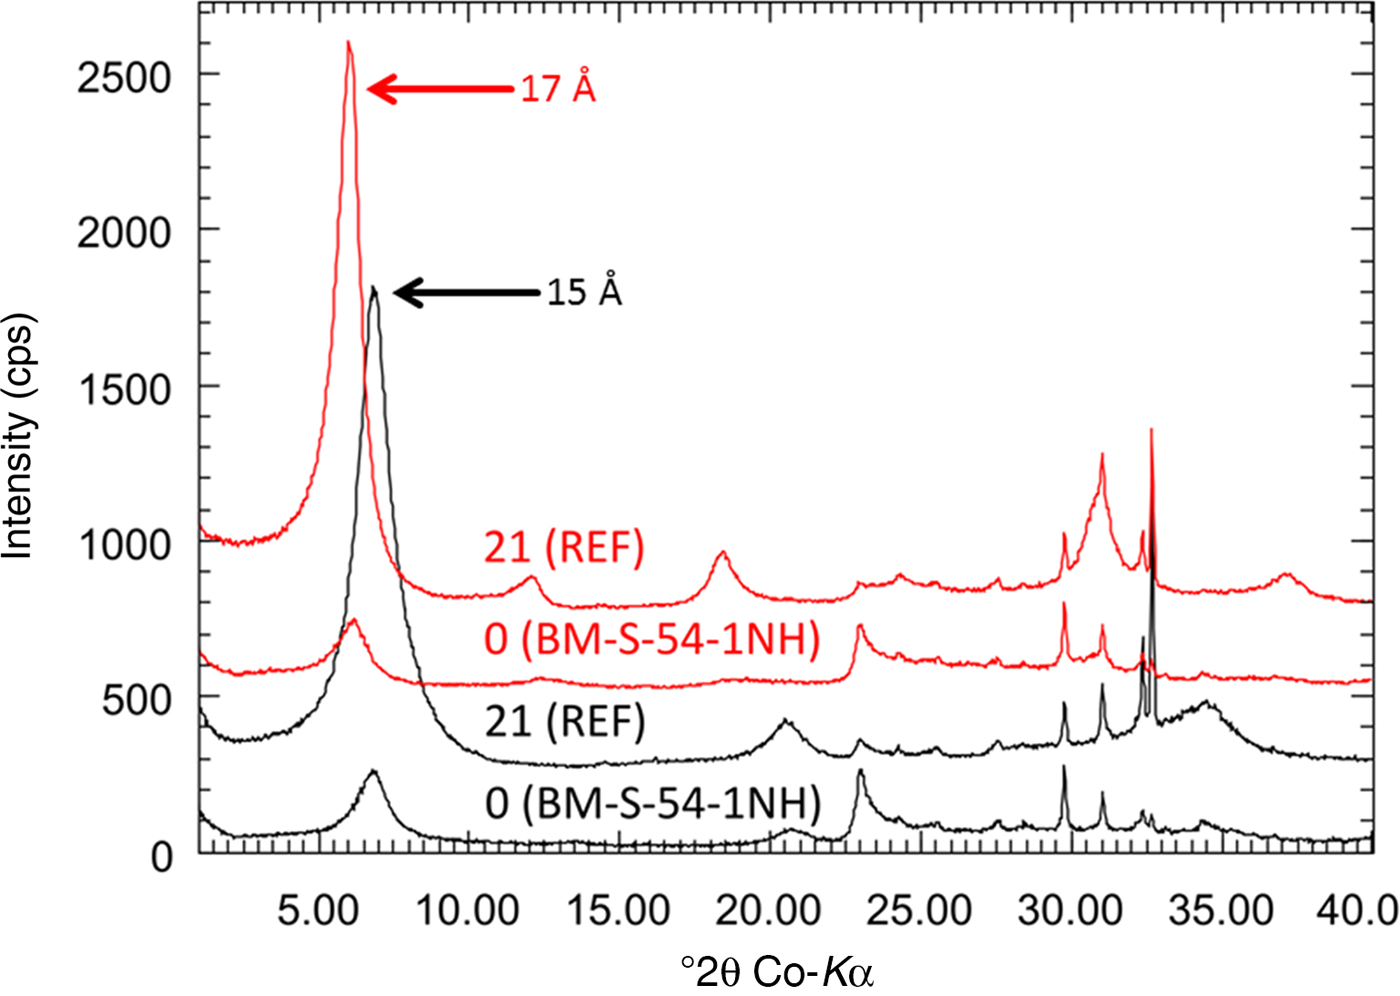
Fig. 7. XRD texture slide analysis (black: air dried; red: EG) of the contact sample.
Kaolinite formation was ruled out based on XRD, which assisted in interpretation of the IR spectra (Fig. 6a). In the IR spectrum, a new band was observed at ~3698 cm–1, which was assigned to brucite because of the absence of kaolinite. In addition, a slight increase in intensity of the contact sample was observed at 570 and 440 cm–1, which might be explained by brucite (Fig. 6a). The band at 680 cm–1 was used to identify the formation of trioctahedral domains/sheet silicates in previous studies (Kaufhold et al., Reference Kaufhold, Dohrmann, Sandén, Sellin and Svensson2013). For the contact sample of block 54, a slight increase in intensity but no distinct band was observed. The 680 cm–1 band cannot be interpreted unambiguously. In addition, a slight increase in the IR intensity at ~880 cm–1 was observed, which would be explained by formation of AlFeOH bonds, but not by either kaolinite or brucite (compare with grey reference spectra in Fig. 6a). In addition, the Fe increase was small, accounting for the formation of AlFeOH bonds.
The contact at the front of the heater was also investigated using SEM (Fig. 8). It is represented by an even surface with small white spots. As expected, the Mg content was slightly greater at the surface, but actual values differed depending on the EDX spot position. In addition, the bright spots on the surface were rather small (<100 nm). No EDX data could therefore be collected to represent the white spots. These white spots might represent neoformed minerals because they were not detected anywhere else in the sample except for at this interface. These particles might be brucite or a Mg-rich clay mineral. Interestingly, the zone in which the white spots formed is rather thin (~5 µm). Therefore, methods with higher resolutions should be applied in order to further characterize the white spots. This block will be investigated in more detail in a follow-up project. Notably, such precipitations might also form upon cooling after termination of the heating period.
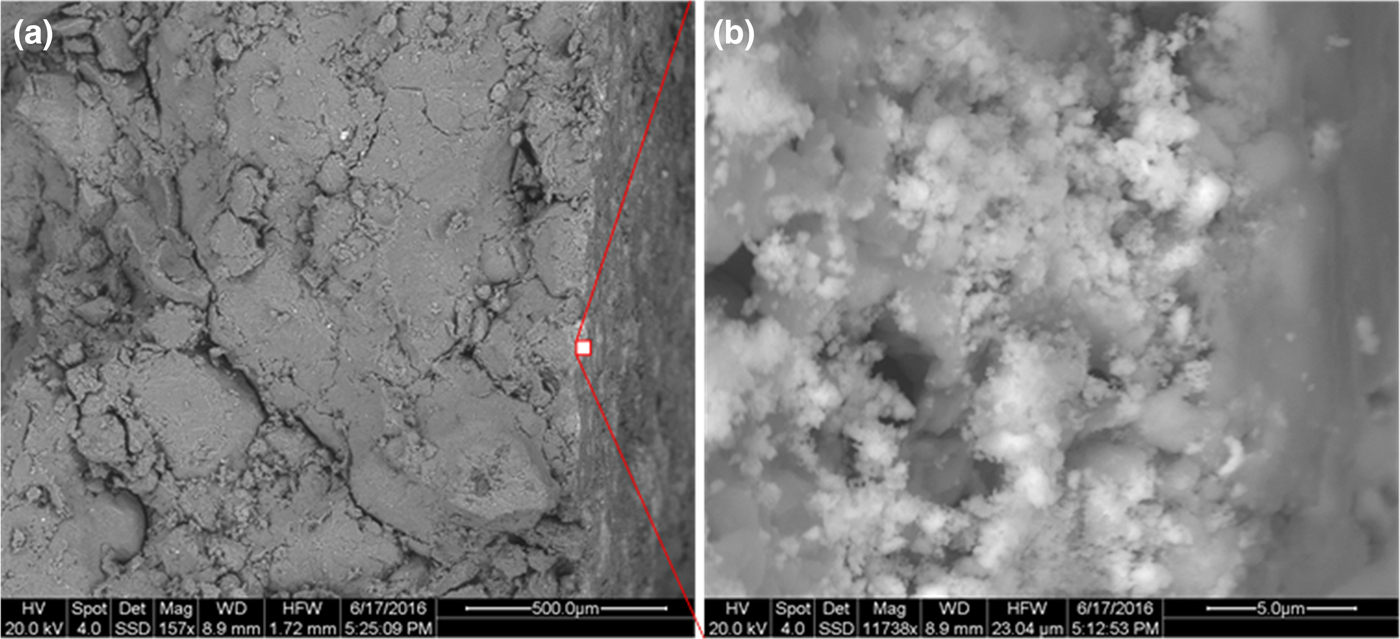
Fig. 8. SEM investigation of the contact at the front of the heater. The white spots in (a) can be best observed in the close-up image in (b).
Water content
After drilling, the samples were dried at 60°C and the water loss was determined (Fig. 9). An aliquot of this material was used to determine the further mass loss at 60–105°C (1 week of drying). The results are in good agreement with those published by Villar et al. (Reference Villar, Iglesias, Abós, Martínez, de la Rosa and Manchón2016). The water content near the heater ranged from 20 to 24 mass% and increased towards the granite up to 26–28 mass%. Similar water contents were recorded at various sampling sites. The water content gradient has to be taken into account when interpreting the geochemical results and particularly when comparing them with other large-scale tests.
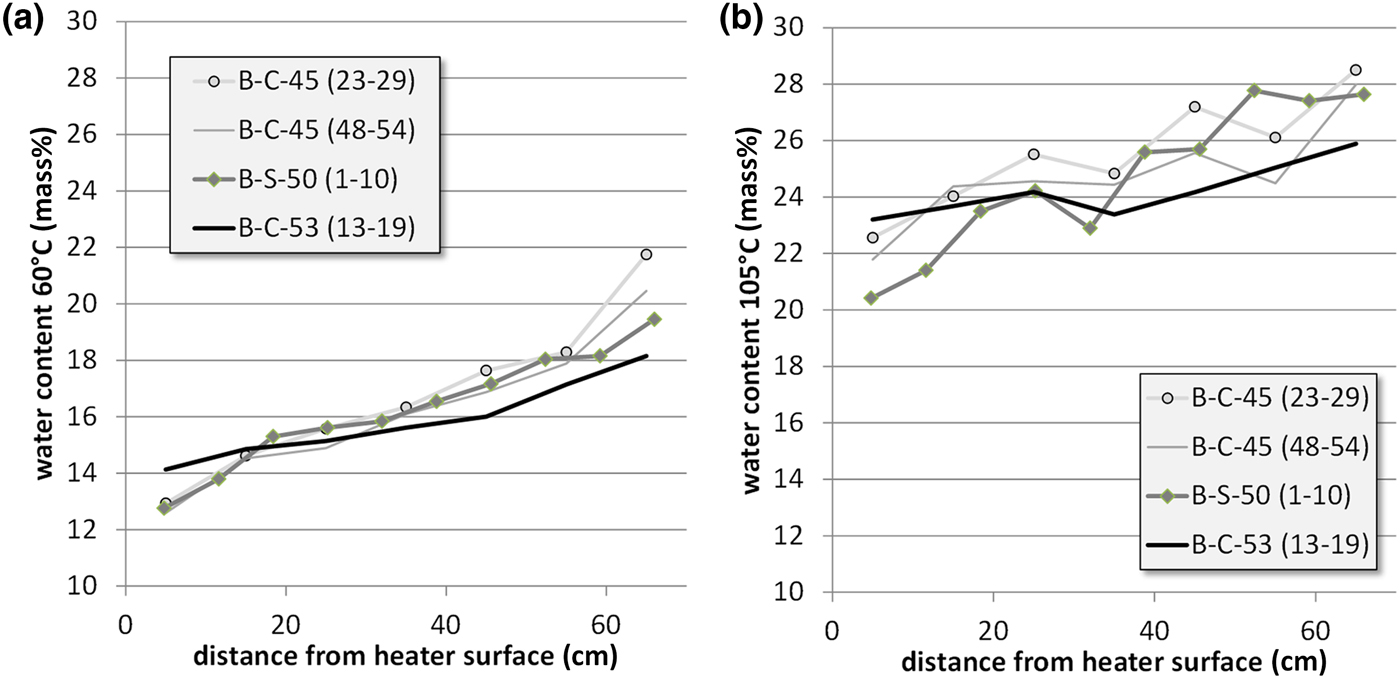
Fig. 9. Water contents of the bentonite profiles of three sections determined at 60°C (a) and 105°C (b).
CEC/cation migration
The most suitable samples for studying cation exchange processes and cation migration through the entire barrier were those taken from the profiles (Fig. 1) of sections 45, 50 and 53. All of the different sections showed comparable trends: exchangeable Mg2+ showed a sharp increase towards the heater that corresponded to a decrease in exchangeable Na+ in this part (Table 1, Fig. 10). This was confirmed by Villar (Reference Villar2017; NAB 16-017) who studied sections 47 and 53 of the FEBEX experiment after dismantling. The concentration of exchangeable Mg2+ was lower compared to the FEBEXABM reference material in most parts of the profile (65 to ~10 cm), except for samples collected near the heater. The concentration of exchangeable Na+, on the other hand, was slightly larger in distances from the heater surface ranging from 65 to ~10–30 cm. Near the heater, the opposite trend was observed. The similar shape of the curves for exchangeable Mg2+ and Na+ indicated a cation exchange process and hence a larger Mg2+ concentration in the pore water near the heater.
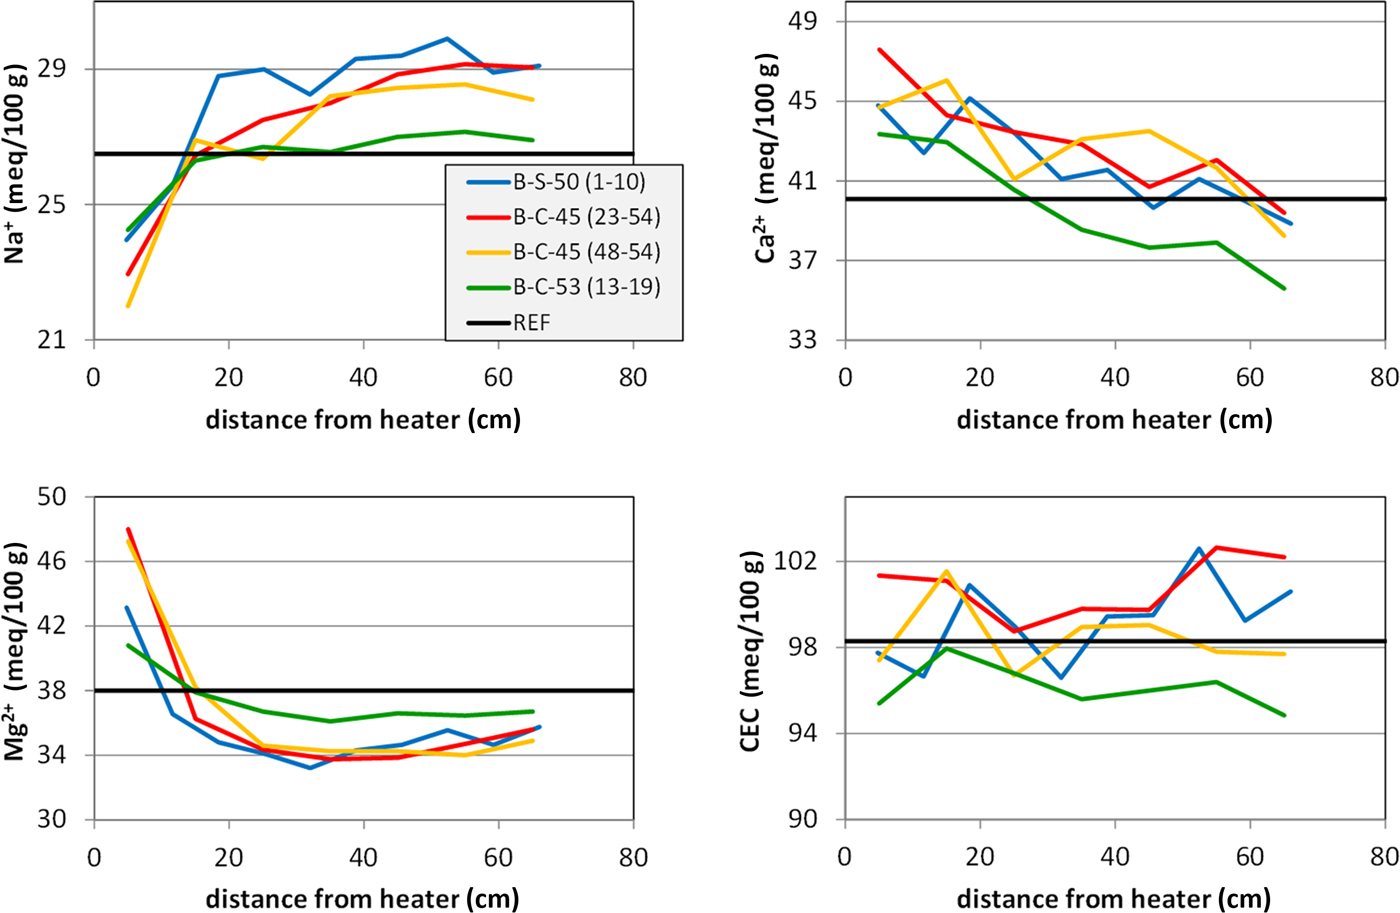
Fig. 10. ECs of the profiles (data from Table 2).
Careful evaluation of the anion concentration of pore water is necessary in order to evaluate the proportion of actually exchangeable Na+ that was influenced by unknown amounts of excess NaCl dissolved in the pore water (cf. Fernández et al., Reference Fernández, Cuevas and Rivas2001). Strongly increasing Cl– contents with respect to the reference material close to the heater have been observed in aqueous extracts of sections 47 and 53 that correlated with increasing Na+ content (Villar, Reference Villar2017). On the other hand, both Cl– and Na+ decreased in the colder regions. Ca2+ and SO42– correlated similarly, but showed maxima at 10–30 cm distances from the bentonite–heater interface. Exchangeable Ca2+, on the other hand, showed trends similar to the water-content curves (Fig. 10). Both parameters may be systematically related because the proportion of pore water determines the solubility of carbonates and sulfates.
The exchangeable Ca2+ was compared with the inorganic carbon content (Fig. 11a) and total sulfur (Fig. 11b). The error in exchangeable Ca2+ induced by calcite dissolution during the CEC experiment should be proportional to the carbonate content. Interestingly, the inorganic carbon content showed the opposite trend. Despite appreciable scatter, larger carbonate contents were observed at a considerable distance from the heater. The carbonate content, therefore, does not determine the amount of exchangeable Ca2+. The S content, on the other hand, was close to the detection limit. Nevertheless, larger values were detected closer to the heater. The Ca2+ curve, therefore, could possibly be explained by the redistribution of sulfates. The S values, however, are small – 0.05 mass% S corresponding to 0.25 mass% gypsum. Based on a sample mass in the CEC experiment of 100 mg, 0.07 mg Ca would be available from gypsum, which corresponds to only 0.2 mmol/100 g. The gypsum content, therefore, does not explain the Ca curve.
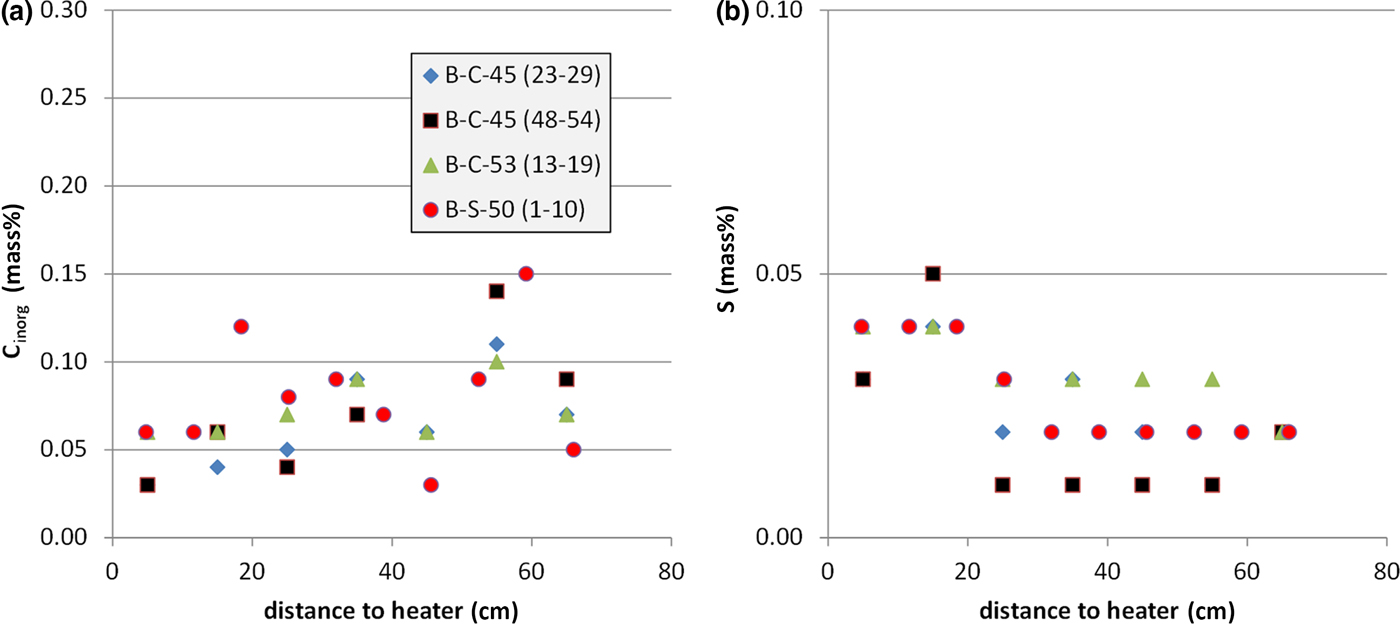
Fig. 11. Inorganic C content (a) and S content (b) depending on the distance from the heater (four profiles).
The opposite trends of carbonate and exchangeable Ca2+ cannot be explained with the existing data. It is possible that some CaCl2 was present in the pore water, but in that case, the opposite trend would be expected, because more pore water was present in samples further away from the heater. Villar (Reference Villar2017), on the other hand, subtracted excess Ca2+ from soluble Ca phases by means of anion analysis of samples taken from section 50. Taking into account these corrections, the exchangeable Ca2+ values remained around the value for the reference bentonite. In the long-term test of buffer material project (LOT), no such gradients of ECs were detected (Karnland et al., Reference Karnland, Olsson, Dueck, Birgersson, Nilsson, Hernan-Håkansson, Pedersen, Nilsson, Eriksen and Rosborg2009), but various gradients were observed in the first package of the ABM project (ABM-I; Dohrmann et al., Reference Dohrmann, Olsson, Kaufhold and Sellin2013; Wallis et al., Reference Wallis, Idiart, Dohrmann and Post2015) and in the second package (ABM-II; Dohrmann & Kaufhold, Reference Dohrmann and Kaufhold2017).
However, it is not clear why varying profiles were observed. The degree of water saturation might be important. The FEBEX groundwater has pH 9.6 and low salinity (Na-Ca-HC03-F type; Degueldre, Reference Degueldre1994) with 0.7 mM Na and 0.14 mM Ca. Other cations are present in traces: 2.1 µM Mg, 2.3 µM Sr and 3.6 µM K. Although the groundwater is almost free of Mg2+, this did not decrease the exchangeable Mg2+ values of the bentonites. The low Mg content, on the other hand, suggests that the Mg that accumulated at the bentonite–heater interface stemmed from some incongruent dissolution of smectites. Fernández & Villar (Reference Fernández and Villar2010) also reported on increasing exchangeable Mg2+ values of FEBEX bentonite samples in column tests after 7.6 years of heating and hydration (up to + 10 meq/100 g close to the heater). Those authors used a Ca-Na-Mg-type water for saturation with a ~200-fold larger Mg content compared to the FEBEX groundwater (Ca was 8-fold more concentrated and the Na content was 0.66-fold greater compared to the FEBEX groundwater). Although the Mg concentration was large in the water used by Fernández & Villar (Reference Fernández and Villar2010), the resulting exchangeable Mg2+ values were not larger than those found in samples after reaction with the FEBEX groundwater used in this experiment.
The CEC is probably the most important parameter for evaluating the performance of a barrier in crystalline rocks because it reflects the swelling capacity of the bentonite and may be determined with comparably high precision. The CEC values remained unaffected in all profiles, which indicated that smectites remained expandable. These CEC values, however, corresponded to samples taken at least a few centimetres from the heater surface. Samples taken directly from the contact show some decrease in the CEC (results presented above), which proved the loss of some swelling capacity of the smectite that, however, is restricted to the very contact.
Apart from cations, anions might also migrate through the barrier, with 129I– being particularly hazardous (Kaufhold et al., Reference Kaufhold, Pohlmann-Lortz, Dohrmann and Nüesch2007). In the frame of the FEBEX experiment, iodide migration tests were installed (yellow bar in Fig. 1). In section 50, iodide-saturated filter papers were placed between the granite and bentonite. Such a tracer was similarly installed in section 30 and investigated during the partial dismantling in 2002 (ENRESA, 2006). The iodide concentration depended on the distance to the gallery axis (to the heater) and varied from 0.2 to ~2.0 mg/g (= 0.02–0.20% = 200–2000 mg/kg = 200–2000 ppm). Interestingly, a higher iodide concentration was recorded near the heater, although the iodide tracer was further away. This behaviour corresponds to the expected behaviour of a tracer following water migration (ENRESA, 2006). For the present study, XRF powder analysis was used to detect the iodide. The detection limit was 0.5 mg/kg. Both references and all but one of the samples of the iodide profile showed iodide concentrations of <0.5 mg/kg. Only for the sample that was far away from the iodide paper was a value above the detection limit measured. This might be explained based on the results reported for section 30 (ENRESA, 2006), but this value (0.6 mg/kg) is close to the detection limit and hence should be treated with caution. The iodide concentration in this profile is ~4000-fold less than that of section 30 (ENRESA, 2006). The XRF trace element analysis indicated that either iodide did not diffuse through the bentonite barrier at all or was washed out. In section 30, significant iodide concentrations were found (after less time). Therefore, it is more probable that the iodide diffused away.
SUMMARY AND CONCLUSIONS
The current study presents geochemical and mineralogical investigations of interfaces and selected profiles of the FEBEX experiment. At the cement/shotcrete–bentonite interface, a reaction zone of 0.1–1.0 mm was observed. This is characterized by the precipitation of carbonates and sulfates. In addition, a trace of either kaolinite or brucite (or a related phase) formed that could not be identified unambiguously. Cation exchange data proved that the chemical impact of the cement on the bentonite was not restricted to 1 mm because cation exchange and a slightly lower CEC was observed at a distance of even 1 cm from the cement.
Bentonite samples in contact with the metal liner showed an increase in the Fe content, which was mainly present as goethite. This oxic corrosion may be explained by the comparably large amount of air that was entrapped between the heater and the liner. Samples taken directly from the Fe surface of the liner showed an intimate intergrowth of bentonite constituents and Fe phases – even native Fe. In addition, precipitation of carbonates at the inner surface of the liner was observed. At the face of the heater (section 54), where bentonite blocks were in direct contact with the heater surface, no signs of corrosion were detected. Instead, a marked increase in the Mg content was observed.
An increase in the Mg content at the contact with the heater was detected in many previously published descriptions of large-scale disposal tests. For samples taken in section 54, however, the largest Mg increase accounting for + 5.7 mass% MgO was recorded. X-ray diffraction revealed the formation of trioctahedral domains or phyllosilicate minerals, as previously reported, but also the formation of brucite, which was also detected by IR spectroscopy. Using SEM, white spots were observed on the contact surface, and the overall thickness of the reaction zone was ~5 µm. The EDX analysis indicated a large Mg content of these phases, but because of their small size of <100 nm, no representative chemical analyses were obtained by SEM. These results help with the understanding of the mechanism behind the Mg enrichment that is needed for reasonable modelling. The large Mg enrichment in section 54 where no corrosion was observed proved that the Mg enrichment is not related to Fe corrosion. In addition, the presence of two Mg-rich phases proves that formation of trioctahedral domains results from Mg enrichment. In conclusion, Mg – which is particularly soluble and may be from cation exchange and incongruent dissolution of silicates – was possibly precipitated in the hot contact zone where the water content was lower. Precipitation of Mg phases at the contact, in turn, resulted in a Mg concentration gradient, leading to further Mg migration towards the heater. This model has to be validated based on laboratory tests and chemical modelling.
Dissolution and precipitation processes were observed in previous large-scale disposal tests. In the FEBEX experiment, a slight decrease in the carbonate content at the heater was observed, particularly when goethite formed. At the same time, aragonite was observed at the inner liner surface. A slight variation in the carbonate content of the blocks was detected, which might be explained by material heterogeneity.
The investigation of the water content of the profile samples proved that water saturation in bentonite has not been achieved. Larger water contents were found near the granite towards the heater.
The FEBEX groundwater is a Na-Ca-HC03-F type and is of low salinity. Water taken up during saturation might explain the increasing exchangeable Na+ and Ca2+ values. However, this was only partly confirmed after dismantling. Exchangeable Mg2+ shows a sharp increase towards the heater, corresponding to a decrease of exchangeable Na+. Near the heater, exchangeable Mg2+ was higher compared to the reference values and Na+ was lower, which, together with a similar shape of the curves, indicates cation exchange. Exchangeable Ca2+, on the other hand, showed an approximately linear increase towards the heater, but due to methodological problems caused by carbonate dissolution, these Ca2+ values are difficult to explain.
In section 50, where an iodide tracer was applied before the experiment, no residual iodide was found. The values were 4000 times less than those reported in section 30 (ENRESA, 2006), 9 years previously. It is concluded that iodide was washed out.


 Open access