


INTRODUCTION
The fields of quality improvement (QI) and patient safety (PS) were brought to mainstream attention by the Institute of Medicine (IOM)’s reports To Err Is Human and Crossing the Quality Chasm, published in 2000 and 2001, respectively.Reference Kohn, Corrigan and Donaldson 1 , 2 The first report included a call to action for healthcare providers to work together to build a safer health system, while the second report introduced the concept of the six aims of quality healthcare: safety, timeliness, effectiveness, efficiency, equitability, and patient-centeredness.Reference Kohn, Corrigan and Donaldson 1 , 2 In the wake of this movement, a 2004 Canadian study found that 7.5 adverse events occurred per 100 hospital admissions, with greater than one-third being preventable.Reference Baker, Norton and Flintoft 3 Although such estimates are difficult to replicate and complex to interpret, most healthcare providers have witnessed problems with healthcare delivery and struggled to find solutions.
Since these reports were published, the number of QI and PS initiatives has skyrocketed in all medical disciplines, and the importance of these efforts is emphasized throughout the Royal College of Physician and Surgeons of Canada’s “CanMEDS 2015 Physician Competency Framework.”Reference Frank, Snell and Sherbino 4 QI and PS carry particular relevance for the discipline of emergency medicine (EM), which is practiced in a fast-paced and high-risk environment where adverse events may be more likely and more consequential than in other areas of medicine.Reference Calder, Forster and Nelson 5 , Reference Stang, Wingert, Hartling and Plint 6 Additionally, rising numbers of emergency department (ED) visits across Canada and a mismatch in resources have resulted in strained systems and overextended providers, which have been associated with an increased incidence of adverse events.Reference Bernstein, Aronsky and Duseja 7 - Reference Stang, Crotts, Johnson, Hartling and Guttmann 9 Fortunately, EM clinicians working in diverse settings across the country have worked hard for decades to improve the quality of ED care, including reducing wait time and improving safety. The maturing field of QI can help in maximizing the chances of positive impact and sustainability.Reference Chartier, Josephson, Bates and Kuipers 10 , Reference Chartier, Simoes, Kuipers and McGovern 11 Readers will find in this series a review of QI concepts that they can apply to their work in ED care.
CLINICAL SCENARIO
Recent cases highlighted in your ED’s mortality and morbidity rounds involved delays in the administration of antibiotics to patients with sepsis, which may have contributed to patients’ poor outcomes. As a result, you performed a small audit of patients admitted with sepsis and found that the median time from patient triage to delivery of antibiotics (time to antibiotic) was 6 hours. Given the 3-hour target time recommended in the Surviving Sepsis Campaign guidelines,Reference Dellinger, Levy and Rhodes 12 you decide to develop a QI project focused on improving this metric. Your ED chief commits to helping you get the buy-in of relevant parties by being an active supporter of the project, and to considering operational changes that you believe may be necessary.
PROBLEM IDENTIFICATION
Problems of quality and safety are sometimes identified through the retrospective analysis of local data, but more often they initially become known through the informal collection of frontline providers’ anecdotal stories. They often relate to one or many of the IOM’s six aims of quality healthcare. The problems chosen for improvement should:
-
▪ Be important (i.e., they can affect patient outcomes such as mortality and morbidity, and/or patient experience).
-
▪ Occur relatively frequently (i.e., enough to measure and intervene).
-
▪ Have evidence of a gap between current and optimal performance (e.g., compared with an accepted practice or a known benchmark).
-
▪ Be within the scope (or locus of control) of the improvement team to address.
STAKEHOLDERS
A stakeholder is anyone who is affected by a problem and/or its solutions and who can therefore influence the success or failure of a project.Reference Brugha and Varvasovszky 13 Understanding the perspectives of different stakeholders in relation to a problem is critical to determining the possible scope and impact of the project you are considering. One effective way to identify all stakeholders is to brainstorm with colleagues on all the possible components of the problem at hand and whom they each affect. You should then contact key individuals from all these groups or hospital departments. All stakeholders—both internal and external to the ED—should be consulted early in the development of a QI project to ensure buy-in and sustainability.
STAKEHOLDER ANALYSIS
Not all stakeholders should be engaged with the same level of intensity, and pragmatic methods from political science have proved useful to QI projects. Defining the expected level of involvement of all stakeholders from the outset usually prevents wasted time and missed opportunities. One effective way to break down the level of various stakeholders’ necessary engagement is through the use of a power-versus-interest grid.Reference Bryson 14 Based on your knowledge of the system and the project at hand, you should position all stakeholders in a two-by-two matrix with axes of power and interest. The people with the most power and interest (top right corner of the grid) are the “players,” who are actively involved in the project and whose expectations must be managed closely; this includes involving them in important decisions and taking their feedback into consideration. The people with a lot of power but relatively little interest in the project (bottom right corner) are the “context setters,” who often have leadership roles in the organization and thus must be kept satisfied and apprised of the project’s progress. The people with a lot of interest but little power (top left corner) are the “subjects,” such as patients or peripheral participants, who should be kept informed and engaged. Finally, the people who have little power and interest in the project (bottom left corner) form the “crowd,” which has little to gain or lose from the project and must simply be monitored as the project advances. You must also remember that various stakeholders have different perspectives and motivations—including patient care, process efficiency, staff satisfaction, and finances—that will influence the strategy you use to approach each of them. After brainstorming with colleagues, you construct the power-versus-interest grid found in Figure 1 to help identify relevant stakeholders. This example may reflect the reality of a larger-scale project in a large institution. The specific elements will vary greatly depending on the size and type of project and the environment, but the important step is to reflect on the system at hand and those involved in it. Small projects without many resources can be successful and lead to meaningful improvement of patient care if the right players are involved from the start.
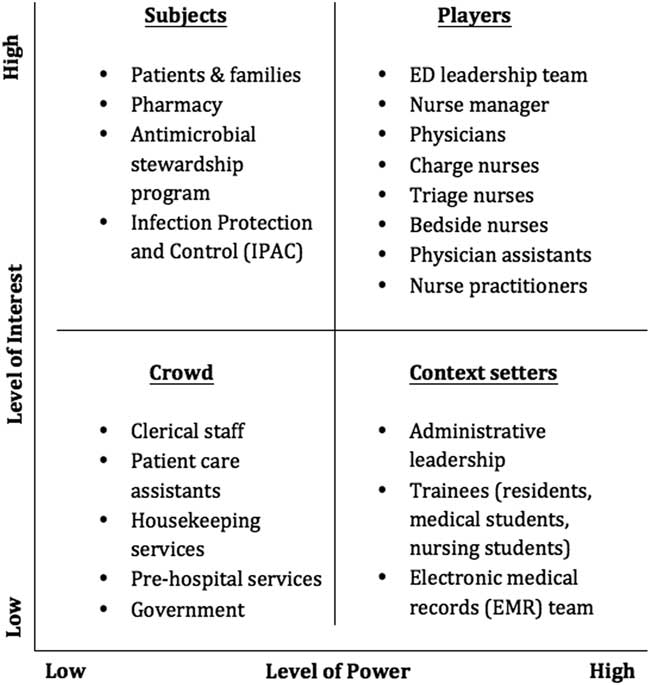
Figure 1 Power versus interest grid for sepsis project. The x-axis represents the various stakeholders’ level of power in the system you are trying to change, and the y-axis represents their level of interest in the problem and its solutions.
Although your stakeholder analysis will reveal many diverse groups, not all will be actively involved in the development and execution of the project. Those who are more closely involved often can be divided into four major groups: champions, helpers, bystanders, and resistors.Reference Beatty and Barker Scott 15 Champions encompass the few who will lead the change with you and who should be involved intimately in the project’s progression. Helpers constitute another small group that will encourage and enable the project, but without taking any leadership role. Bystanders compose the largest group and can come from any and all of the stakeholder groups previously identified. Bystanders have a neutral attitude toward the project—they neither help nor hinder progress—but they can be swayed either way based on formal and informal leaders’ influence. Finally, resisters are the vocal few who actively oppose and disrupt change for a variety of professional and/or personal reasons. Although your first reaction may be to minimize contact as much as possible with the resisters, they often have valid concerns that should be understood because they may actually improve your project substantially, or this will at least prevent unnecessary delays down the line. At times, the most vocal opponents of a project will become the biggest cheerleaders once their concerns are heard and addressed.
CORE CHANGE TEAM
From your list of stakeholders, you must enlist the core change team that will be intimately involved and invested in the success of your project. This team can be small, but you should consider involving multidisciplinary frontline providers, as well as management and administrative representatives, in order to create a combination of expertise and leadership that leads to success. The members of your core change team do not necessarily need to have defined roles within the group, but you should ensure that you answer the following questions:
-
▪ Who will lead? This person is responsible for the day-to-day functioning and advancement of the project, and ideally works within the system being improved.
-
▪ Who will provide clinical expertise? These people have intimate knowledge of the process at hand and are well-regarded members of the community (e.g., frontline physicians, nurses, and other relevant members of the ED team).
-
▪ Who will provide system expertise and/or management support? This person has authority over the process to enable tests of change to occur, and understands and believes in the importance of the project (e.g., the ED chief or nursing manager). While they do not necessarily have to participate in the day-to-day operations of the project, their support and involvement may enable you to access resources and leadership support to ensure success and sustainability.
Engaging EM clinicians in projects is often challenging for a variety of reasons. As such, various techniques can be employed to engage individuals. First, presenting local data to showcase the variability or discrepancy between local and accepted standards can make a compelling argument for the need for change. We have found that outcome data (e.g., patient-oriented outcomes) are often useful to obtain buy-in, as are process measures that demonstrate the variability between providers. And finally, insist on the trial nature of any project (i.e., the group can return to the baseline processes if the proposed change does not work).
Patients and their families deserve a separate mention given their importance and the dedicated care required for their involvement. Patients can help identify improvement opportunities, create a sense of urgency through compelling storytelling, and provide creative ideas to redesign processes of care given their different viewpoint.Reference Stang and Wong 16 There is growing evidence that involving patients in healthcare improvement efforts can be rewarding for staff and patients and improve care processes and health outcomes.Reference Landers, Abusalem, Coty and Bingham 17 , Reference Baker, Fancott, Judd and O’Connor 18 It is important, however, to avoid falling into the trap of involving patients for the sake of fulfilling organizational requirements or for the sake of appearances.Reference Baker, Fancott, Judd and O’Connor 18 Important steps to ensure that patients’ involvement adds value include assessing whether the organizational culture is willing to take their contribution seriously, to address power imbalances within the team, and to support patients and their families in the process.Reference Baker, Fancott, Judd and O’Connor 18 The episodic nature of ED care complicates patient recruitment, but many hospitals keep a list of patients who have an interest in volunteering their time. Patient involvement can be beneficial to many QI projects, but the capability and commitment to engage patients longitudinally is needed in order to make it worthwhile and respectful.
ROOT CAUSE ANALYSES
EM providers are often action-oriented in their clinical practice, frequently needing to implement a treatment plan before they have a great understanding of the problem at hand. However, this approach does not tend to serve QI projects well. Developing an adequate knowledge of the root causes of a problem as the first step can avoid implementing solutions that are tailored to the wrong etiologies and lead to meaningless or even harmful results. There are different ways to understand the root causes of a problem. We present here three of the most common ones: Ishikawa diagrams, Pareto charts, and process mapping. Each method yields different insights and can thus be used in isolation, but their complementarity makes them synergistic in combination.
Ishikawa diagrams
Ishikawa diagrams, also known as fishbone diagrams, are cause-and-effect visualizations of a problem.Reference Ishikawa 19 They help break problems down into their underlying factors and group them under meaningful headings. They also exemplify the fact that problems with quality are often the result of a complex interplay among providers, the system, and situations. To construct an Ishikawa diagram, the quality problem is written on the far right of the figure. A central line (the spine of the fish) is drawn horizontally, from which diagonal lines (the ribs of the fish) extend. Between these lines, you group various causes under specific headings to help organize the problem’s etiologies. The chosen headings should be tailored to the specific project, but can include:
-
▪ People (including their attitudes, skills, knowledge, actions and communication).
-
▪ Management and leadership.
-
▪ Processes, policies, and procedures.
-
▪ Plant and equipment/materials.
-
▪ Environment (i.e., local culture, and organizational and governmental structures).
For your sepsis project, you elect to break down the headings into: physicians, nurses, policies and procedures, and plant and equipment. Under each heading, the various stakeholders are encouraged to list all the challenges they perceive. If the headings that should be utilized are not initially clear to your team, you may also use “sticky notes” to list all the issues. Moving them around and collating them into related themes may help reveal useful headings. These factors should relate only to problems and not to solutions, and some of the problems may in fact not have any clear or foreseeable solutions but are still worth identifying. As seen in Figure 2, your Ishikawa diagram reveals that multiple factors are involved in the delay to antibiotic treatment for patients with sepsis. This schema can be employed to start a conversation about which factors can be targeted and prioritized for intervention (i.e., those with potential large gains for a relatively small amount of work, or low-hanging fruits).
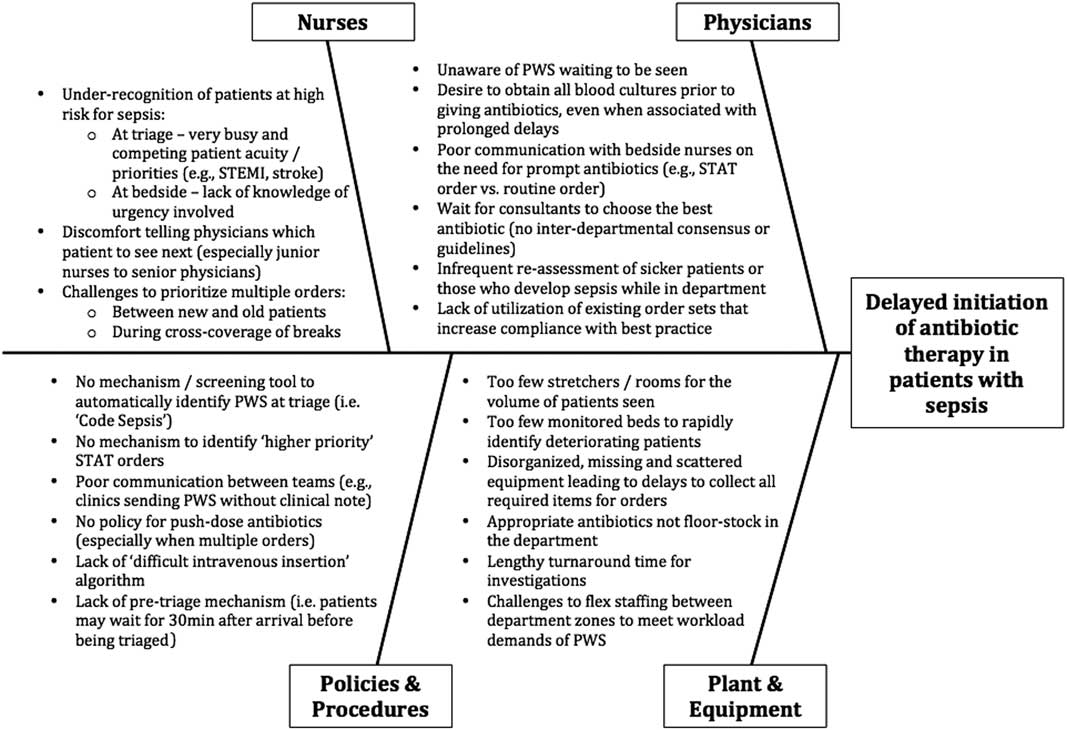
Figure 2 Ishikawa diagram for sepsis project. PWS=Patients with sepsis.
Pareto chart
A second tool for root-cause analysis is the Pareto chart. It relates to the Pareto principle, or the 80/20 rule, which states that 80% of the outcomes in a system are due to 20% of the causes. This is not a strict mathematical rule, but in complex systems where many issues are involved it can help your core change team identify and focus on the highest-yield interventions. To create a Pareto chart, you must first collect data through direct observation, chart audits, or interviews of stakeholders. For example, for your sepsis project you present stakeholders with the list of issues identified through the Ishikawa diagram and ask each of them to select the top five most problematic ones. The tally can then be presented in graph form, known as a Pareto chart, which is a histogram that lists the identified issues in decreasing order of frequency from left to right, with a line representing the cumulative frequency.Reference Tague 20 A pattern that more or less approximates the 80/20 rule often emerges and clearly demonstrates the most problematic issues. Armed with this information, you can make a more informed decision as to what problems (and therefore solutions) you will tackle. Figure 3 shows that for your sepsis project four issues were chosen 80% of the time by your stakeholders as being the most problematic. These will therefore merit greater attention from your team going forward in terms of devising potential solutions to address them. It is important to note that there are unintended consequences to every change you seek to affect. A swing too far in one direction—for example, treating all patients with possible sepsis with antibiotics—can have negative outcomes at the patient and system levels. The goal remains the right care given to the right patient at the right time, not necessarily more care.
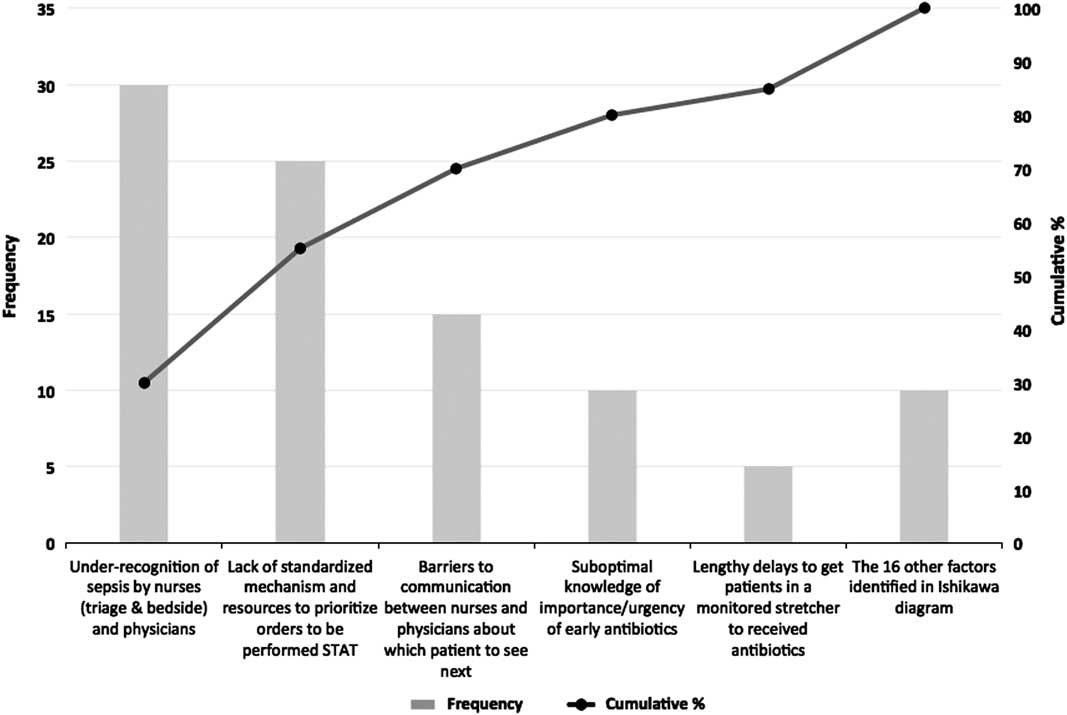
Figure 3 Pareto chart of factors chosen by stakeholders that cause delays to prompt antibiotic therapy in patients with sepsis.
Process mapping
To improve any process, you must have an accurate understanding of how it actually operates at baseline—in comparison with how it is supposed to operate. Only then can you move toward identifying the biggest bottlenecks and possible remedies. Process maps help to identify: 1) the sequential flow of the steps involved in the process; 2) responsibilities between the parties involved; 3) the relationship between actions; and 4) possible bottlenecks, non-value-added steps, and those that are duplicated or unnecessarily complex.Reference Langley 21 For this exercise, it is essential to involve the frontline workers in your system.
Using agreed-upon conventions, your team pictures the chronological sequence of events that a typical patient with sepsis would go through in your ED. The resultant process map, from patient triage in the ED to receipt of antibiotics, is shown in Figure 4. It is important to note that this process map is drawn at a high level, where each step could potentially be expanded into multiple different steps as needed. For example, as any nurse will tell you, the step “bedside nurse administers antibiotics” is actually a collection of many more individual steps. Depending on the scope of the project, and given that each of these substeps may actually hold the key to improving efficiency, you may want to review all of these individual components at least once with the people who perform them.
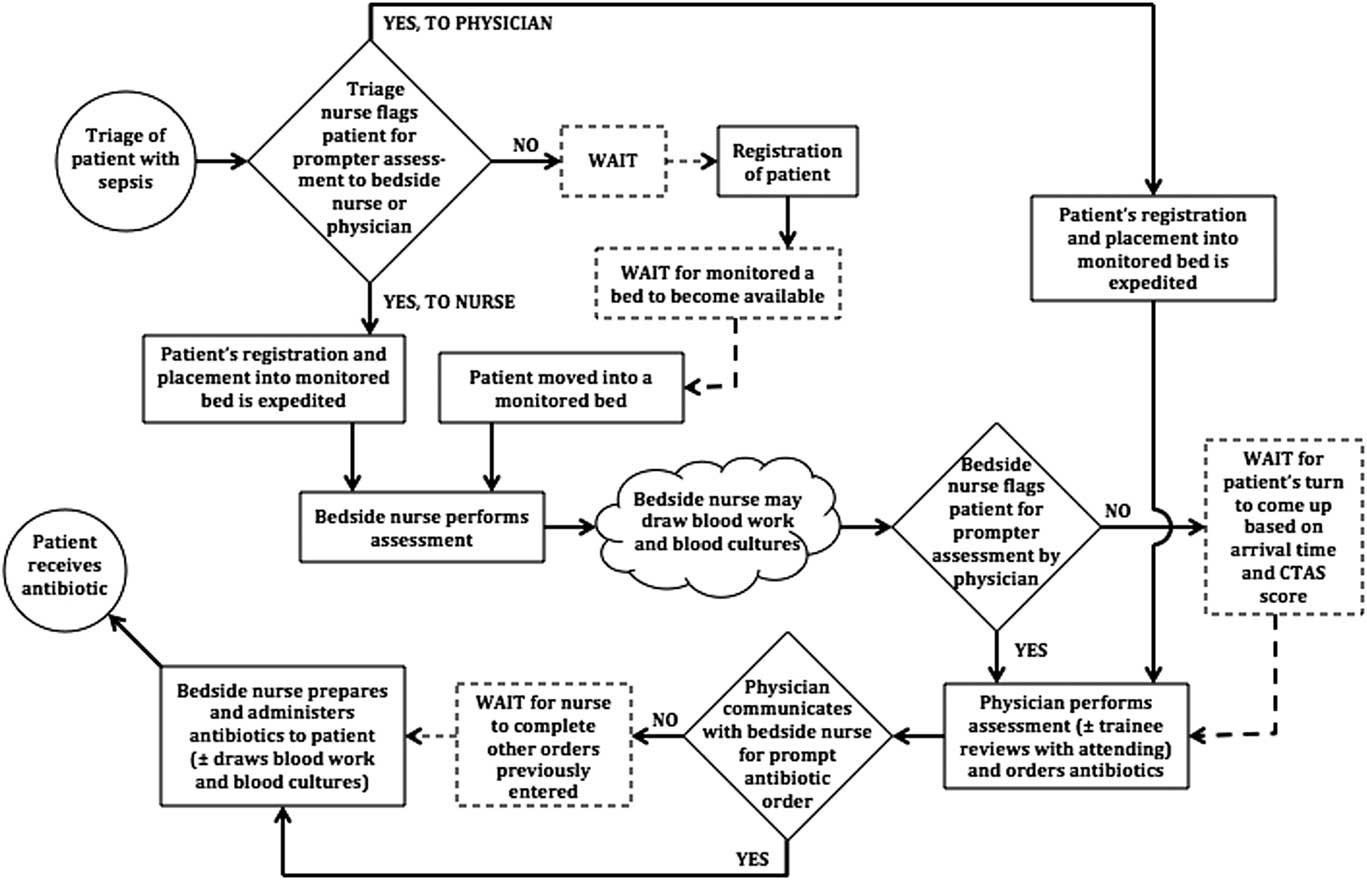
Figure 4 Process map of sepsis project. Circles denote the start and end of the process, squares denote tasks or events, diamonds denote decision points for the people involved, and clouds denote events that have been amalgamated together or that are poorly defined or variable. Dashed events denote inconsistent and sometimes absent events.
Once your process map is complete, members of the core change team should be invited to share their insights and ask questions to uncover whether some steps should be removed or modified, if certain actions can be performed more efficiently, and if the right people and resources are employed in the best possible ways. In doing so, your sepsis team identifies that the inconsistent communication between triage nurses and physicians about the presence of patients with sepsis in the ED is an important issue. This is felt by many to cause unwarranted delays in the initiation of antibiotic therapy. Given this, you decide to pick this concern as one of the first issues to tackle for your project.
CONCLUSIONS
EM physicians are used to finding creative solutions to the clinical problems they encounter every day. For problems that require system solutions, QI methodologies can help foster a deeper understanding of the problem and of the desired and undesired ramifications of potential solutions, which can maximize the chances of interventions having a positive, sustained impact. These include clearly identifying the problem and developing a thorough understanding of the system at hand through root-cause analysis. At the same time, relevant stakeholders must be characterized, and a core change team should be created to launch the implementation phase. In this article, we have introduced QI methods to accomplish this and provide an example of delays in the delivery of antibiotics for patients with sepsis. In the next two articles in this series, we will describe the methods utilized to execute a QI project, as well as those used to evaluate and sustain it.
ACKNOWLEDGMENTS
The authors would like to acknowledge the mentorship of Dr. Eddy Lang for his support in the development of this series, Ms. Carol Hilton for her review and improvement of the manuscript, and Dr. Jonathan Dreyer and Mr. Muhammad Ali Abid for their insightful comments on the challenges of conducting QI work in smaller institutions.


