


Introduction
The hemlock woolly adelgid, Adelges tsugae Annand (Hemiptera: Adelgidae), is a non-native insect pest of eastern hemlock, Tsuga canadensis (Linnaeus) Carrière, and Carolina hemlock, T. caroliniana Engelmann (Pinaceae), in eastern North America. This adelgid has caused significant mortality of hemlock throughout the Mid-Atlantic region of North America, but the mortality rate of trees is highly variable, usually between four and 15 years of infestation (McClure Reference McClure1991; Nuckolls et al. Reference Nuckolls, Wurzburger, Ford, Hendrick, Vose and Kloeppel2009; Krapfl et al. Reference Krapfl, Holzmueller and Jenkins2011). The loss of hemlock in riparian habitats has important ecological consequences, such as changes in vegetation and wildlife communities, forest hydrologic function, and water nitrification (Jenkins et al. Reference Jenkins, Aber and Canham1999; Spaulding and Rieske Reference Spaulding and Rieske2010; Cessna and Nielsen Reference Cessna and Nielsen2012; Adkins and Rieske Reference Adkins and Rieske2013; Brantley et al. Reference Brantley, Ford and Vose2013).
The most conspicuous sign of A. tsugae on a tree is ovisacs. Ovisacs form after first-instar crawlers have dispersed and become sessile: nymphs engulf themselves with waxy white filaments (“wool”) produced from glands on their abdomen (McClure Reference McClure1987). This wax protects the developing nymphs and adults of the current generation and eggs of the next generation. Ovisacs increase in diameter from approximately 1 mm in fall to 3–5 mm in spring, are located primarily on the underside of branch tips and their abundance is affected by host vigour, predation, and adverse environmental conditions (e.g., McAvoy et al. Reference McAvoy, Mays, Johnson and Salom2017; Mech et al. Reference Mech, Tobin, Teskey, Rhea and Gandhi2017; Tobin et al. Reference Tobin, Turcotte, Blackburn, Juracko and Simpson2017).
As of December 2017, established infestations of A. tsugae were reported in 20 states and the District of Columbia in the United States of America and Nova Scotia, Canada (United States Department of Agriculture, Forest Service 2016; Canadian Food Inspection Agency 2017). The first detections of A. tsugae in eastern Canada were made in 2012 (Etobicoke) and 2013 (Niagara Falls) (North American Plant Protection Organization 2015), but these populations may have been present for several years at each location. The management response to these detections was to mandate the removal of the infested trees. These removals occurred. However, additional infested trees were found in Etobicoke in 2012 and 2013 and in Niagara, Falls in 2013, 2014, and 2015 during delimitation surveys that followed the initial detections. It is assumed that the new detections represented populations that were missed during the initial surveys in 2012 and 2013. It is not clear why some infested trees were missed in the annual delimitation surveys. One reason could be that populations were located in the upper half of the tree crown that was not assessed in the initial surveys and had since spread to the lower crown. McClure (Reference McClure1990) considered that the within crown distribution of A. tsugae during establishment was likely random because adelgids could arrive at a tree by one or more vectors. However, there is some evidence that A. tsugae is more abundant in the upper crown of trees when present in low densities (Evans and Gregoire Reference Evans and Gregoire2007; Joseph et al. Reference Joseph, Hanula and Braman2011). Given that the distribution of new infestations within a tree is unknown, a survey tool that can reach most of the hemlock crown would improve detection and delimitation surveys for A. tsugae.
Fidgen et al. (Reference Fidgen, Whitmore and Turgeon2016) reported a nondestructive method of sampling A. tsugae wool from the upper crown of T. canadensis. The technique (hereafter “ball sampling”) consisted of shooting a racquetball covered with patches of Velcro hooks (hereafter “ball”) at branch tips in the outer crown with a slingshot. When this method is used it is important that the ball reach most of the upper crown (suitable flight height) because mature hemlock crowns can be > 30 m in height (Farrar Reference Farrar1995). The ball should also contact as many branch tips as possible as it travels through the outer crown in order to maximise the probability of trapping wool on the Velcro hooks, instead of deflecting away from the outer crown. Reduced deflection when the ball lands (i.e., bounce) makes it easier to recover the ball after a sample.
When we have used this ball to sample hemlock we have observed the following: the ball ascends through the hemlock crown impacting the underside of branch tips until it reaches its apex and then descends the interior of the hemlock crown, exits the crown and then bounces and rolls a short distance across the forest floor (Fig. 1). Alternatively, during flight the ball could have deflected out of the crown, reached its apex and then descended through open air or the crown of another tree until it finally landed on the forest floor (e.g., Fig. 1D). It was unclear when balls were most likely to trap wool during flight (i.e., during the ascent or descent phases), or if the ball trapped wool on the ground after landing, or how the size (i.e., diameter), and density of ovisacs present on the tree may have affected the probability that the ball trapped any wool. We also observed that balls often struck non-hemlock foliage, large woody material, rocks, pavement, mud, and water. It was unclear whether this caused wool to be dislodged. We were also uncertain of the false negative rate of ball sampling.
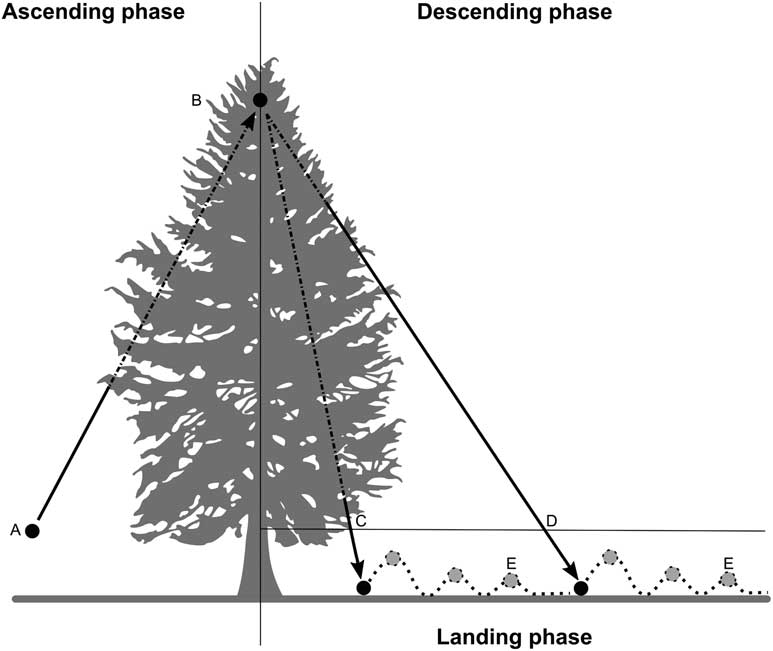
Fig. 1 Flight phases and typical flight paths (arrows) of the ball after being launched through the crown of Tsuga canadensis. The ball was launched (A) from a hand-held slingshot and ascended through the crown (broken portion of left arrow) hitting the underside of branch tips until it reached the apex (B). The ball descended striking the top of branches (broken portion of right arrows) either passing through the crown of the tree (C) or exiting the crown soon after hitting the apex (D). When the ball landed it hit the ground, bounced and rolled to a stop (E), whereupon it was retrieved.
Herein we report the results of six experiments designed to evaluate new modifications to the ball from the earlier design (Fidgen et al. Reference Fidgen, Whitmore and Turgeon2016). We assessed the ballistic performance of the new ball as well as the ability of the ball to trap and retain A. tsugae wool during flight and landing. We also evaluated the detection rate when using the ball to sample individual trees as compared to other detection techniques.
Materials and methods
Device
The first sampling device described by Fidgen et al. (Reference Fidgen, Whitmore and Turgeon2016) was a blue, 5.8-cm diameter racquetball with a surface area of 103 cm2 (Penn Ultra-Blue; Penn Racquet Sports, Phoenix, Arizona, United States of America), with 5–6 rectangular patches of Velcro hooks (black general purpose; Velcro USA, Manchester, New Hampshire, United States of America) glued to the ball, for a total trapping surface of 31–38 cm2. The remainder of the surface area was bare. This design needed frequent repairs and its light weight resulted in frequent deflections during sampling, making sampling of the crown, and recovery of the ball after landing difficult. The ball also had a tendency to curve away from branch tips, which resulted in samples having to be repeated. We tested several modifications to this design (unpublished data) and settled on two changes. First, we varied the area and pattern of Velcro patches on the ball to see if that improved the flight path of the ball and we evaluated the influence of Velcro surface area on the amount of wool trapped and retained by the ball. Second, we added different “fill” materials to the interior of the ball to reduce the amount of deflection off branches and bounce off the ground. In all, we tested four versions and compared these to unmodified balls (V0).
The first version consisted of replacing the 5–6 Velcro patches with two Velcro strips, 0.9 cm wide×14 cm long, glued at right angles to each other around the approximately 18 cm circumference of the ball to obtain 25 cm2 (V25) of Velcro surface area (Fig. 2, right). These Velcro strips divided the ball into four quadrants. The second version (V50) was constructed in the same way as V25 but we added four, approximately 0.9 cm wide×6.9 cm long, strips of Velcro to the centre of the quadrants created by the circumferential strips of V25, resulting in 50 cm2 of hooks (Fig. 2, left). A bead of super glue (Henkel Corporation, Rocky Hill, Connecticut, United States of America) was applied to the ends of each strip to increase adhesion. We added fill to the centre of some of the V25 and V50 versions to create the last two versions. We tried several fill materials (e.g., rice, pasta, plastic beads, and wooden beads) (unpublished data), but we found that wooden beads (Horizon Group, Dayton, New Jersey, United States of America) were durable and lightweight. We added approximately 12 large (14–16-mm diameter) and 1-9 small beads (9–11-mm diameter) to the centre of each ball through a 4-cm long incision along its seam. The incision was resealed with super glue and allowed to cure for approximately 12 hours. We also filled several balls without Velcro (FV0) as needed in experiments.
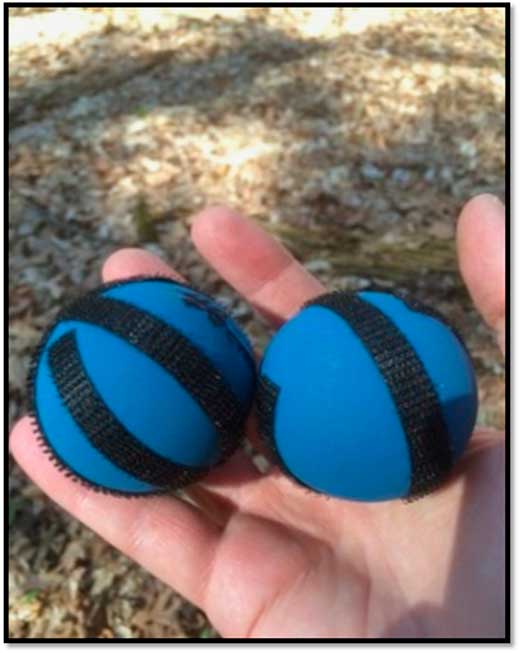
Fig. 2 Sampling balls with strips of Velcro patches of hooks, 50 cm2 (left) and 25 cm2 (right), used to sample for wool of Adelges tsugae on Tsuga canadensis. See section “Device” for detailed description on how to build and use this tool.
General sampling approach
Unless otherwise stated, we used a hand-held slingshot (Hyperdog 4; Hyper Pet, Wichita, Kansas, United States of America) to launch balls. The slingshot was held on its side so that it was positioned on the inside of one arm then the pouch of the slingshot was pulled back until the hand contacted the collarbone. Once the hand reached this point, it was moved to a consistent location on the opposite cheek (anchor point), aimed at the distal portion of branch tips and then the pouch was released smoothly. We were interested in evaluating the wool trapping and retaining potential of the balls when they ascended through the underside of distal branch tips (ascent phase), descended through the top side of branches (descent phase), and when the ball landed, bounced, and rolled on the forest floor (landing phase) (Fig. 1). Woolly twigs can snap during winter and spring storms, landing on the forest floor. Thus, a ball could have contacted wool during the landing phase. We recorded the presence or absence of A. tsugae wool on the ball after each sample and cleaned the ball with a medium bristle toothbrush. Unless otherwise stated, experiments were carried out at several woodlots with established populations of hemlock woolly adelgid near Ithaca, New York, United States of America (Table 1).
Table 1 Locations in New York State used for field experiments evaluating Velcro-covered balls at trapping and retaining Adelges tsugae wool.

Notes: Average diameter at breast height (cm) and height (m) estimates were of hemlock only; and incidence was the average number of twigs out of 100 with at least one ovisac based on a sample of twigs from 20, 30-cm-long branch tips cut from the lower crown with pole pruners. See text for further details.
* No hemlock trees sampled at these locations.
Experiment one: ball ballistics
This experiment was carried out in the laboratory (Great Lakes Forestry Centre, Sault Ste. Marie, Ontario, Canada). Sixty balls were randomly selected out of a large group of balls and modified to create 10 balls for each combination of trapping surface and fill (V0 [control], V25, V50, FV0, FV25, FV50). All balls were weighed (± 0.1 g) before experimentation.
It was difficult to measure flight height by shooting balls in the air. Instead, we measured the initial velocity (v 0) of the ball as soon as it left the slingshot pouch. We then calculated flight height using the formula:
 $$H_{{max}} {\equals}{{v_{0}^{2} {\times}\sin \theta } \over {2g}}$$
where H max is the maximum height, θ the launch angle (degrees), and g the acceleration due to gravity (9.80 m/s2). H max is the predicted apex height of the ball (Fig. 1B) in the absence of deflection caused by hitting obstacles during flight.
We estimated v 0 (± 0.1 m/s) of the balls by releasing them over a shooting chronograph (Shooting Chrony, Amherst, New York, United States of America). This chronograph has two photosensors approximately 30 cm apart: as the ball passes over the first sensor, it triggers a timer that stops when the ball crosses the second sensor (v 0=time÷distance traveled). We placed the ball in the slingshot pouch, drew the pouch back approximately 72 cm and released it approximately 0.5 m in front and approximately 0.3 m above the chronograph. We measured v 0 of each ball three times and calculated H max (± 0.1 m) for both θ=90° (peak flight height), and θ=75° (typical angle for sampling) using equation (1).
To determine bounce height (Fig. 1E), we dropped each ball onto a flat asphalt surface from a height of 190 cm in front of a 180-cm tall measuring scale. The apex of the first bounce (± 1 cm) was measured by examining videos taken with a smartphone (Apple iPhone 5S; Apple, Cupertino, California, United States of America). We dropped each ball three times.
Experiment two: factors affecting the trapping of wool on balls during flight
We compared the likelihood of the ball trapping wool: (1) during ascent and descent through the crown (Fig. 1) for balls with 25 and 50 cm2 of Velcro (Fig. 2) with increasing size and density of ovisacs on branch tips. We simulated the flight of a ball through an infested hemlock using a suspended ball hit by a moving hemlock branch.
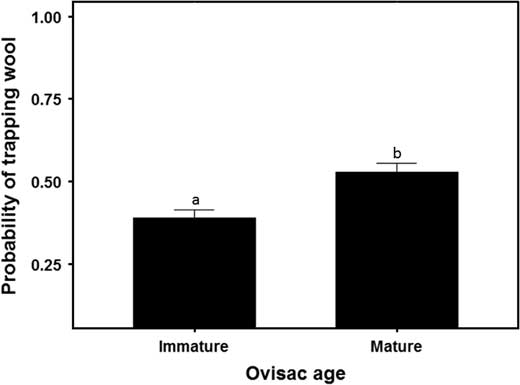
Fig. 3 Influence of ovisac diameter (e.g., immature ~1.5 mm; mature ~3.5 mm) on the probability of trapping Adelges tsugae wool (±SE) on the ball. Different letters above error bars denote significantly different means.
To suspend a ball, we affixed a 1-m-long tether of 3.2 mm diameter type III parachute cord by gluing one end to the ball and tying the free end to a tree branch overhead. Next, we brushed the suspended ball with a hemlock branch tip (swatting) to evaluate the ascent and descent phases of flight separately. To simulate ascent, a branch tip was held at a natural orientation as seen on hemlock trees (approximately 20° downward angle from the horizontal plane) and rapidly swatted in a downward motion over the top of the ball. To simulate descent, the branch tip was held with the same orientation but was swatted upwards from the bottom to top of the ball.
To test the effects of ovisac size and density on the amount of wool trapped on the balls, we collected branch tips from infested trees in early spring, when ovisacs were still immature or small (~ 1.5 mm), and again in late spring, when ovisacs were maturing or large (~ 3.5 mm). The tips were trimmed to include approximately the 10 distal-most one-year-old twigs (hereafter twigs) before swatting. We counted the number of ovisacs on all twigs and divided this number by the total length of all twigs (± 0.1 cm) on the tip to calculate ovisac density. After three swats, we replaced the branch tip. We repeated swatting 8–12 times for each combination of flight phase, ovisac diameter, ovisac density, and amount of Velcro on the ball (n=732).
Experiment three: factors affecting the trapping of wool on balls during landing
To test if the abundance of woolly twigs on the forest floor influenced the probability of trapping wool, we simulated the ball landing on the forest floor (rolling) (Fig. 1E). This work was carried out in a hemlock stand at Texas Hollow State Forest (Table 1), which was heavily infested with A. tsugae but trees only showed light twig dieback. Twenty-four 2×10 m patches of forest floor were selected in this stand. These patches were first inspected to confirm that woolly twigs were present then we removed any large branches or other obstacles that could have affected the path of the rolled ball. Woolly twig abundance was estimated by placing a 50×50 cm (0.25 m2) wooden frame at three random locations within each patch and counting the number of woolly twigs inside the frame. We averaged the counts of woolly twigs for each patch.
Two observers were stationed inside each patch during sampling. Then the ball was thrown by the first observer at the forest floor in the direction of the second observer. The ball rolled along the forest floor as it would during a landing, eventually stopping within the patch. It was then retrieved by the second observer, examined for wool, cleaned, and then rolled back to the first observer. This procedure was repeated five times for each ball that was tested. A roll was counted when the ball traveled at least 8 m and stayed within the patch; otherwise the ball was re-rolled. We also tested the influence of Velcro surface area on the probability of trapping wool during rolling using the filled versions of the balls (FV25, FV50). In some patches, only the FV25 or FV50 version of the ball was tested. In other patches, we tested both versions: in such instances we randomly selected one version to test first, then followed with the other version.
Experiment four: factors affecting the retention of wool on balls during flight and landing
We tested the effect of landing surface, the amount of Velcro on the ball and the amount and location of wool loaded on balls to see how these factors influenced the probability of the ball retaining wool during flight and landing. To do this, we marked two 1 cm2 areas on the FV25 and FV50 versions of the ball: one on the bare surface of the ball and the second on the Velcro hooks. We then placed wool in one of these locations (loading) and shot the ball at a landing surface. To vary the amount of wool, we placed either approximately 1/3 of the wool from a mature sistens ovisac (a “wisp”) or the wool from a full ovisac (positive control). A wisp was the minimum amount users felt was required to make a confident identification of adelgid wool. To test the landing surface we located different surface types at our sampling locations (Table 1) in parts of the stands with no hemlock trees (but see below). This was done to reduce the probability that adelgid wool present in the testing area would contaminate the ball.
Our procedures used to evaluate the landing surfaces varied. To test the effect of landing on asphalt and gravel, balls loaded with wool were tossed by hand ~ 10 m high into the air and allowed to bounce and roll up to 3 m over the surface. To test the effect of striking conifer foliage, we shot balls at eastern redcedar, Juniperus virginiana Linnaeus (Cupressaceae). We selected redcedar because its dense array of branch tips represented a “worst case scenario” for the ball contacting conifer foliage without wool. To test the effect of embedding in the forest floor, we shot balls at the forest floor from a height of ~ 1 m. To test the effect of striking water, we threw (~ 45 km/h) loaded balls into a pond, allowed them to stay in the water for 15 seconds and then retrieved them. Unfortunately, our test pond at Fall Creek (Table 1) was located near adelgid-infested trees and so we were concerned that wool was present in the water. Therefore, we included negative controls in this trial using balls without wool. After each ball was thrown or shot and came to rest, we assessed it for wool and cleaned it before re-use. In all tests using the slingshot, we orientated the ball in the pouch so that the wool faced the direction of travel. We tested 10 balls for each combination of landing surface, Velcro surface area, and amount and location of wool loaded on the ball (n=400).
Experiment five: influence of Velcro surface area on detection of wool
In this experiment, we evaluated the detection rate of the two Velcro surface area treatments using only the filled versions of the balls (e.g., FV25, FV50). To sample a tree, we randomly selected one of these versions and shot it into the tree crown, taking care to shoot at a new portion of the crown each time to cover as much of the crown as possible. We sampled 19 trees at Fall Creek, 11 trees at Ellis Hollow Nature Preserve, and two trees at Stevenson Forest Preserve (Table 1): adelgid populations on these trees were light. At Fall Creek, we sampled each tree 30 times with each version of the ball. At Ellis Hollow Nature Preserve and Stevenson Forest Preserve, we sampled each tree with each ball until the first detection of wool for a maximum of 30 times.
Experiment six: comparison of sampling techniques for detection of wool
In this experiment, we compared several techniques used to detect A. tsugae infestations to ball sampling. We first sampled 124 trees across our study sites (Table 1) and then either visually examined foliage from the ground (hereafter visual sampling), climbed trees to visually scan foliage in the interior of the crown, or examined twigs on branch tips that were cut using a pole pruner (hereafter twig sampling). We also assessed the false-negative rate of the visual, twig and ball sampling techniques.
When visual sampling, all trees were examined from the ground by two observers looking at the distal 1 m portion of branches up to 3 m above ground. Each tree was inspected for ovisacs up to one minute. When twig sampling, we haphazardly selected and cut twenty 30-cm-long branches tips from the lower and middle crown (4–8 m above ground) of each tree with pole pruners (Gilmour Commercial Tree Pruner, Robert Bosch Tool Corporation, Peoria, Illinois, United States of America). Once all branch tips were cut, the twigs were examined for wool. Finally, each tree was ball sampled as in experiment five. We also further sampled a subset of 11 trees at Fall Creek (n=6) and Spring Brook (n=5) (Table 1) with the aid of a tree climber. Each tree was climbed and the interior branches from the middle half of the live crown were inspected for wool. We also evaluated false negative rate of climbing because the tree climber was assessing a portion of the crown not targeted by the other methods (i.e., the tips of branches in the interior of the crown). To do this, we directed the climber to ascend five trees (two at Fall Creek; three at Spring Brook) that were known to be positive as indicated by at least one of the other methods. The climber did not know if these trees were infested. Climbing was stopped when the climber found ovisacs, for a maximum of 20 minutes per tree.
Statistical analysis
We fit linear or generalised linear models to the response variables (flight height, bounce height, probability of trapping and retaining wool, number of positive samples out of 30 per tree, number of samples until first positive, detectability) in each experiment using Velcro surface area, flight phase, ovisac diameter, ovisac density, or abundance of woolly twigs on forest floor, as appropriate, as predictor variables. For all analyses we fit full models, considered all possible interactions and tested the statistical significance of the main effects using analysis of variance (F, Deviance or Log Ratio (LRT) tests). For all models we examined the fitted values versus residuals using graphical methods described in Zuur et al. (Reference Zuur, Ieno, Walker, Saveliev and Smith2009) to assess departures of the residuals from the prescribed distribution. We found no significant departures. Where we detected significant main effects, we examined the differences among levels using post hoc tests.
All analyses were done in the R statistical computing environment version 3.4.2 (R Core Team 2017). Linear and generalised linear models were fit using functions in the “stats” package (R Core Team 2017). Differences among levels of the main effects (post hoc tests) were examined using functions in the “multcomp” (Hothorn et al. Reference Hothorn, Bretz and Westfall2008) and “emmeans” (Lenth Reference Lenth2017) packages. Results were considered significant at P≤0.05.
Results
Experiment one: ball ballistics
Both Velcro surface area and fill significantly influenced the flight and bounce height of the balls (Table 2). Filled balls flew ~ 25% less high than unfilled balls. However, flight height decreased significantly for filled balls with increasing Velcro surface area as compared to those without Velcro. Interestingly, unfilled balls with 25 cm2 Velcro flew less high than unfilled balls without Velcro or with 50 cm2 Velcro (Table 2). This resulted in a significant interaction between both factors for each of the launch angles tested (θ=90°: F(2,54)=7.04, P=0.002; θ=75°: F(2,54)=7.06, P=0.002). Filled balls bounced ~ 49% less high than unfilled ones. However, Velcro did not significantly reduce the bounce height of filled balls like it did for unfilled balls (Table 2). This caused an interaction between both factors (F(2,54)= 13.66, P<0.0001).
Table 2 Selected ballistics (±SE) of balls with Velcro (0, 25, or 50 cm2) and fill (none or wooden beads).
Note: *Letters within a column indicate significant differences among means (Tukey’s honest significance test).
Experiment two: factors affecting the trapping of wool on balls during flight
The density of A. tsugae ovisacs on the branch tips we used to swat balls varied from 0.2 to 51.0 per 10 cm of twig. The four-factor general linear model indicated one interaction and three main effects significantly influenced the probability of trapping wool on the ball (Table 3). The probability of trapping wool on the ball was significantly higher for mature (large) ovisacs as compared with immature (small) ones (Fig. 3). The probability of trapping wool increased faster with increasing ovisac density when the ball ascended as compared to descended through the crown, resulting in a flight phase×ovisac density interaction (Fig. 4).
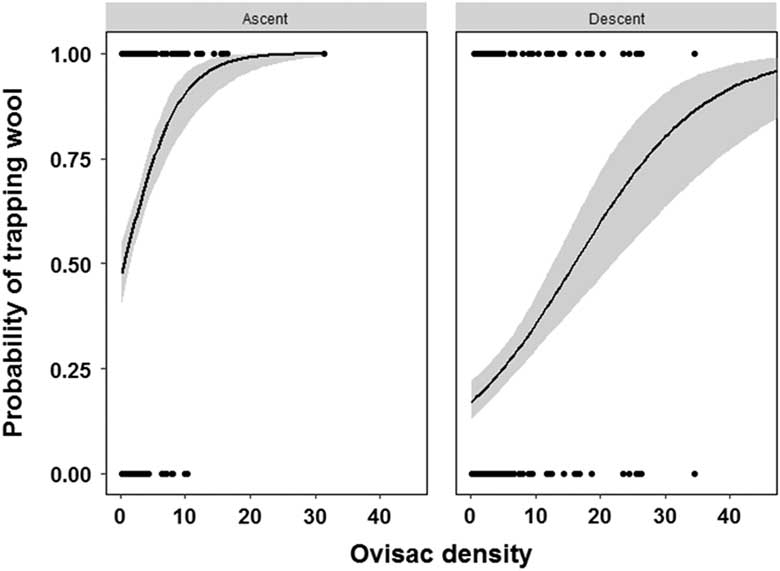
Fig. 4 Influence of flight phase and density of Adelges tsugae ovisacs (number of ovisacs per 10 cm of twig) on twigs on the probability of trapping wool on the ball during swatting.
Table 3 Influence of Velcro surface area, flight phase, ovisac diameter, and ovisac density on the probability of trapping Adelges tsugae wool on the ball.
Note: Bold font indicates a significant factor(s) in the analysis.
Experiment three: factors affecting the trapping of wool on balls during landing
The average number of woolly hemlock twigs per patch varied from 0 to 5.33 per 0.25 m2. The surface area of Velcro on the ball did not significantly affect the trapping of wool on the ball during landing (D 1, 299=0.24; P=0.62). However, the probability of trapping wool on the ball increased with increasing abundance of woolly twigs on the forest floor (r 2=0.53; P<0.0001; y=0.002+0.056x) (Fig. 5).
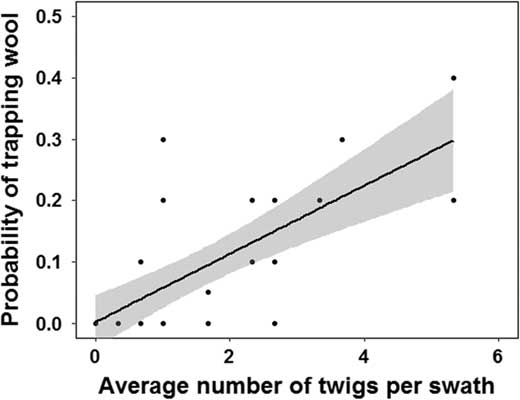
Fig. 5 Relationship between the average probability of the ball trapping Adelges tsugae wool when rolled in a patch and the average number of woolly twigs inside a 0.25 m2 wooden frame (regression equation: y=0.002+0.056x).
Experiment four: factors affecting the retention of wool on balls during flight and landing
We observed an effect of both the amount of wool loaded on the ball and the location where wool was placed on the ball on the probability that wool was retained by a ball (Fig. 6). However, the probability of retention varied with the amount of wool loaded in the Velcro of the ball whereas the probability of retaining wool on the bare surface was the same for each amount of wool loaded on the ball. This result caused an interaction between both factors (Table 4).
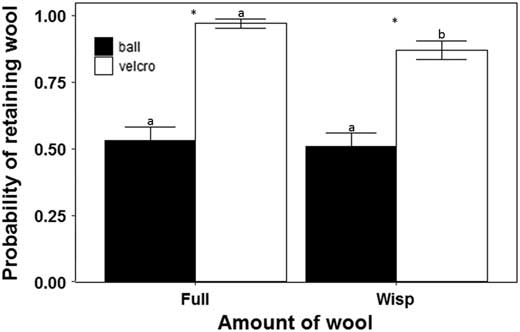
Fig. 6 Influence of the location and amount of Adelges tsugae wool loaded on the ball on the probability of a ball retaining wool (±SE) after it had landed on various surfaces. Asterisks indicate significance in the probability of retaining wool between the two surfaces (bare, Velcro) on the ball. Different letters above error bars denote significantly different means.
Table 4 Influence of landing surface, Velcro surface area, and location and amount of Adelges tsugae sistens wool placed on the ball on its retaining wool.

Note: Bold font indicates a significant factor(s) in the analysis.
We also observed an effect of both landing surface and Velcro surface area on the probability that wool was retained by a ball (Fig. 7). However, the probability of retention varied depending on the landing surface tested and the surface area of Velcro. In some tests, balls with a larger surface area of Velcro had a lower probability of retention, while in others it was the same, or higher. This result caused an interaction between both factors in our statistical analyses (Table 4). Wool was not detected on any of the control balls thrown at the water surface so the likelihood of accidental contact with wool was extremely low. For the other landing surfaces, wool was not observed anywhere else on the ball except the marked locations.
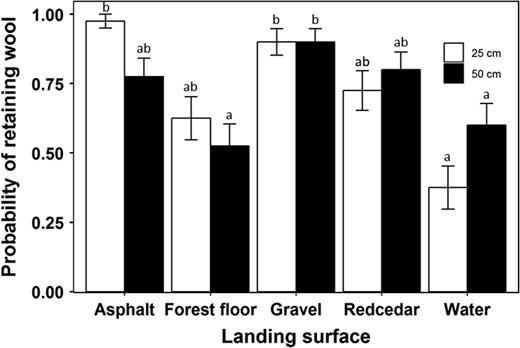
Fig. 7 Influence of the Velcro surface area on the ball and landing surface on the probability of the ball retaining Adelges tsugae wool (±SE). Different letters above error bars denote significantly different means.
Experiment five: influence of Velcro surface area on detection of wool
Detectability of A. tsugae wool on individual trees was not influenced by the area of Velcro on the ball (D 1, 1109=0.95, P=0.33). Likewise, the number of positive samples out of 30 per tree (LRT 1, 38=0.82, P=0.36) and the number of samples until first positive (LRT 1, 60=0.71, P=0.40) were not influenced by the area of Velcro on the ball.
Experiment six: comparison of sampling techniques for detection of wool
Adelgid wool was found on 106 of the 124 sample trees using visual sampling, twig sampling, ball sampling, and climbing. The tree climber found wool on one of 11 trees that were previously sampled by the other methods and found to be negative. For the other five climbed trees, that were declared positive for wool after ball or twig sampling, the climber did not detect any infestations. For the ground-based methods, no one method detected wool on all of the positive trees. Visual, twig and ball sampling found wool on 19, 92, and 90 of the 106 positive trees; alternatively these methods failed to detect wool on 87, 14, and 16 of the 106 positive trees. Detectability of twig sampling and ball sampling were similar, but both techniques detected wool on significantly more trees than visual sampling (D 2, 371=119.78, P<0.0001).
Discussion
Slingshots and throw lines have been used to obtain foliage and seed samples from tall trees (e.g., Youngentob et al. Reference Youngentob, Zdenek and van Gorsel2016) or to install insect traps in the canopy (e.g., Hughes et al. Reference Hughes, Johns and Sweeney2014). Fidgen et al. (Reference Fidgen, Whitmore and Turgeon2016) and our results show that sampling insects directly with a ball shot from a slingshot can improve A. tsugae detection surveys by increasing how much of the crown can be sampled. However, the method still has limitations. For example, it was difficult to obtain a consistent sample unit size (e.g., Pedigo Reference Pedigo1993) because the number of branch tips contacted by the ball varied among samples. Moreover, the method cannot provide absolute estimates of population density on trees as other methods like twig sampling (Gray et al. Reference Gray, Evans and Salom1998; Costa and Onken Reference Costa and Onken2006; Fidgen et al. Reference Fidgen, Legg and Salom2006; Evans and Gregoire Reference Evans and Gregoire2007). With the improvements tested here, we now argue the method is appropriate for use in detection surveys for A. tsugae and possibly for insects with a similar life history (e.g., balsam woolly adelgid, Adelges piceae Ratzburg). However, more work is required to extend the method to determine an appropriate sampling intensity per tree and per stand.
Velcro improved the wool trapping and retention potential of the ball. Except under a few circumstances, the surface areas of Velcro we tested performed similarly. We suspected that the amount of wool trapped and held on balls would increase with Velcro surface area. This suspicion was not confirmed. Trapping more wool samples with each ball is advantageous as some can be lost during flight and landing, particularly if they are not trapped in the Velcro. We also found that the addition of weight improved ball ballistics: weighted balls contacted more branch tips before they deflected away from the outer crown. The additional weight also caused a reduction in bounce during landing, which decreased the probability the ball would lose its wool sample(s) or pick up wool samples from the forest floor, or become lost.
The downside of adding weight to the ball was a reduced ability to sample the entire crown. To sample the upper crown of trees taller than 23 m (Table 2) with a weighted ball, it will be necessary to increase the velocity of the ball. This can be done by increasing the draw length or shortening the bands of the slingshot, or using a more powerful slingshot like the SherrillTree “Big Shot” (SherrillTree, Greensboro, North Carolina, United States of America). With the slingshot we tested, the draw length could be increased by 10–15 cm by changing the anchor point from the cheek to the collarbone or upper chest. A second, though less desirable, solution to improve flight height is to use the V50 version as it can reach ~ 30 m with a 72-cm draw length (Table 2). However, we found that unfilled balls deflect wildly during sampling and could become lost during landing. We do not recommend at all the V25 version due to concerns over accuracy. In chronograph testing, the V25 version followed a curvier path than the other versions, which resulted in a lower velocity (Table 2). We suspect that the lower surface area of Velcro on the ball resulted in inconsistent friction in the pouch of the slingshot because one side of the pouch contacted Velcro whereas the other contacted bare surface of the ball. This may have imparted more spin on the ball resulting in a more curved path, lower velocity, and a less predictable flight path than balls with 50 cm2 Velcro. Some preliminary testing has suggested it may be possible to improve ballistics if balls are made from other materials or are of different diameters, or both.
We evaluated several factors affecting the probability of a ball trapping and retaining adelgid wool during flight and landing. We first evaluated which phase of flight the ball was most likely to trap wool, relative to the size and density of ovisacs it may encounter during flight and the number of woolly twigs on the forest floor during landing by simulating ball flight and landing. We were not surprised that balls were more likely to trap wool during simulated ascent as compared to descent (Fig. 1) as most A. tsugae ovisacs occur on the underside of twigs. However, our testing may have overestimated the probability of trapping wool during simulated descent than would be expected during an actual sample. This was because it was uncommon for a descending ball to fall through branch tips as we simulated. Instead, the ball tended to deflect out of the crown (Fig. 1D) or into the interior of the crown after contacting several branch tips during ascent.
The probability of trapping wool on the ball was higher when sampling mature (i.e., larger) ovisacs (Fig. 3), increased with ovisac density on branch tips used to simulate flight (Fig. 4) and increased with increasing abundance of woolly twigs on the forest floor in simulated landings (Table 4). These results suggest sampling for A. tsugae with the ball would be best done when ovisacs are large and the wool is pliable. This typically occurs between the time sistens are laying eggs until the next generation of sistens crawlers have hatched (e.g., between late April and mid-July near Ithaca, New York). Sampling outside this window is less likely to be successful, as beforehand most ovisacs are small and afterwards the wool is either removed by weathering or becomes brittle and less likely to adhere to the ball. Similarly, sampling after a harsh winter that kills most adelgids would also be challenging.
The ovisacs on the branch tips we used for swatting tended to be aggregated amongst twigs, which is consistent with two previous studies (Gray et al. Reference Gray, Evans and Salom1998; Fidgen et al. Reference Fidgen, Legg and Salom2013). Knowing this, we expected to observe a higher probability of trapping wool (Fig. 3) in experiment two (i.e., after one swat with lightly infested twigs). This lower than expected probability may have been be due, in part, to the speed the branches contacted the balls (i.e., 5–7 m/s) compared with the greater speed the balls contacted branch tips when shot (e.g., 20–25 m/s). Also worth noting, was that in the swatting experiment the balls were held stationary while when the balls were shot they experienced spin: this could have influenced their likelihood of trapping wool. In spite of the low predicted probability of trapping wool when the density of ovisacs on twigs was light, the likelihood of trapping wool would have increased with each successive contact of infested branch tips by the ball during a single flight. For example, if the ball contacted five branch tips, each with low density of ovisacs, the probability of trapping wool increased to 0.76.
A ball sample that was negative for A. tsugae wool as it exited the crown of the tree could become positive during landing by bouncing and rolling across the forest floor on woolly twigs (Table 4). This suggests that the ball method could be further modified by simply rolling a ball across the forest floor in sampled stands. We suggest that this method is likely to be inefficient, especially when infestations of A. tsugae are light (e.g., a density of 0.1 twigs per frame gave a probability of detection of ~ 0.03) (Table 4). Indeed, these findings were corroborated by hours of inspecting the forest floor beneath lightly infested trees and finding few woolly twigs (J.G.F., personal observations). We suspect that rain likely removed much of the wool from twigs on the ground during spring. However, a visual inspection of the forest floor for woolly twigs is recommended in situations where lower crown foliage is not accessible to surveyors. That method could also be extended by determining the relationship between density of ovisacs in the hemlock canopy and abundance of woolly twigs on the forest floor.
We found that Velcro was effective at retaining wisps of adelgid wool even after contacting all the landing surfaces we tested. However, when the ball embedded itself into the forest floor, the wool we placed on the ball was sometimes obscured by leaves or other debris, or the wool was clarified when the ball landed in water (though only until the ball dried). These factors likely explain the lower probabilities of retaining wool that we observed for these surfaces. Even after careful cleaning of the leaves and debris, the wool was difficult to discern at the location of placement. We therefore advise that when the ball becomes embedded in the forest floor that the surveyor examine the unaffected portion of the ball for wool. If the ball is too obscured by debris, we recommend cleaning the ball and repeating the sample. We did not test the balls after submersing in mud, which is often present in wet sites. Balls landing in mud can be treated the same way as those imbedding in the forest floor if they can be cleaned as residual mud reduces the wool trapping quality of the Velcro. Otherwise a fresh, clean ball should be used.
The FV50 version used here was very durable. Out of 200 balls constructed to these specifications, about 24 needed repairs with most (20) requiring regluing of patches and the remainder requiring regluing of the incision. We lost at least one ball for every five trees sampled (150 samples) whereas the probability of losing a ball on any given sample was 0.006 (n=1500 shots).
There are some issues to consider when using these balls to sample tree crowns. We do not recommend the use of the ball to sample trees ≤ 15 m tall as the ball may quickly pass through the crown. When this happens there is a potential for the ball to become lost, or strike bystanders or property at high velocity. Such incidents can also occur when the ball is deflected outside the crown during descent. It is therefore critical to wear eye, head, and hand personal protective equipment when sampling, and sample only when risk rate to bystanders and property are low. We recommend wearing appropriate protective equipment (e.g., climbing helmets, long-sleeved shirts, and black leather or suede gloves) during sampling. Beige or white gloves should not be worn as they may contaminate the sample, giving a false impression that wool is present on the ball. The dark blue colour of the balls (Fig. 2) makes it difficult to observe balls as they exit the crown, particularly under the low light conditions of a hemlock stand. The visibility of the ball could be improved with the use of red or hot pink racquetballs.
Ball sampling was comparable to twig sampling and 5–6 times better than visual sampling at detecting A. tsugae-infested trees. In other words, for every tree found infested by a visual sampling, there may be 5–6 other A. tsugae-infested trees. Twig and ball sampling had equivalent detection rates, but twig sampling took approximately six times longer per branch than one ball sample. Moreover, we suspect that carrying a set of pole pruners for twig sampling is laborious. For these reasons, we recommend ball sampling over twig sampling for detection of A. tsugae. We advise that twig sampling is likely best done during intensive delimitation surveys for A. tsugae alongside other techniques. In comparison to both ball and twig sampling, visual sampling may be negative in spite of the presence of infested trees in a stand until infestations spread to easy-to-reach lower crown branches. These undetected infestations have the potential to contribute individuals that spread long distances and create satellite infestations. Thus to slow the spread of A. tsugae, it is important to improve the odds of detecting nascent infestations. Ball sampling compliments visual sampling as it allows the surveyor to access more of the hemlock crown. In particular, our method should be used in situations where the lower crown foliage is out of reach.
Acknowledgements
The authors thank J. Sweeney, Z. Lindo, and M. Stastny for their valuable contributions to this manuscript. The authors also thank Aaron Bose and Isabelle Ochoa (Natural Resources Canada); Janet Fidgen; Erin Bullas-Appleton and Julie Holmes (Canadian Food Inspection Agency); and Becky Sibner, Jon Liebherr, and Blake Wetherbee (Cornell University) for assistance with data collection. Special thanks to Cornell University, the United States Department of Agriculture Forest Service (Finger Lakes National Forest), the New York State Department of Environmental Conservation, Finger Lakes Land Trust, and Stevenson Forest Preserve for permission to use study sites. Funding for this project was provided by Natural Resources Canada – Canadian Forest Service, Spray Efficacy Research Group – International (SERG-I), the Canadian Food Inspection Agency, and the Invasive Species Centre (Ontario Ministry of Natural Resources and Forests).


 Open access