


Introduction
Just outside of Minneapolis, Minnesota, people can enjoy the great outdoors at the General Mills Nature Area in Golden Valley. The General Mills Nature area is a public, municipal nature preserve that happens to be on land donated to the city of Golden Valley for public use by the General Mills Corporation. If they want a rest after their nature walk and prefer a more urban setting, they can drive closer to the city center and sit on the Target City Steps at Waterworks Park near Downtown Minneapolis, where they can take in views of the Mississippi River. Afterward, if they happen to live in suburban Oakdale and find themselves in need of emergency services, they may soon have their police dispatched from a brand new public works facility purchased from the 3M Corporation for $1.
All three of these are examples of public services that are provided by local governments with the aid of a financial or in-kind donation from a private company. These kinds of corporate donations may help cities struggling with budget cuts, alongside other strategies such as outright privatization of service delivery and inter-municipal cooperation (see, e.g., Kim and Warner, Reference Kim and Warner2016; Dawkins, Reference Dawkins2021). Yet there are reasons to believe these donations may not be strictly beneficial, because although they may help cities financially, it is unclear if, or how, these kinds of contributions affect the residents of the municipalities that receive them.
In this paper, we investigate whether corporate donations for public service provision leads people to not hold the government responsible for the quality of those services. Specifically we ask whether the source of funding for public services influences whether people hold the government responsible for the quality of the services it provides. We argue that services funded by corporate donations decrease the probability people hold the providing government accountable, but only when the corporate funds are perceived as replacing taxpayer funding for the service. We theorize that this occurs because paying for services through taxes makes people feel that they are the principal, the government is the agent, and the government ought to be performing to their specification. Thus, when the government provides a poor-quality service, the residents can interpret that poor-quality service as a failure of the government to perform as it should. When corporate donations are used alongside or instead of taxpayer funds, the identity of the principal is less clear, and a poor-quality service could reflect a failure to perform or, potentially, following the directions of a corporate principal. Thus we expect that when corporate donations occur and interpreting the poor-quality service is less clear, people are less likely to hold their governments accountable.
In the next section we go into more depth on the underlying concept of corporate donations for public services. Following that, we explain our theory. Afterward, we explain our research design, present and explore our findings, and conclude with areas for future research.
Background
Providing public services is a common governmental responsibility worldwide. A public service is something of use to a population and widely available to that population free of charge at the point of service. Footnote 1 Although what is and isn’t an available public service varies—sometimes these services are private, fee-based, or club services—some examples of common public services include public parks, public education, mail delivery, public safety, fire-fighting, public roads, snow plowing, public libraries, and waste management. Governments typically provide these services primarily through taxation (see, e.g., Bird, Martinez-Vazquez, and Torgler, Reference Bird, Martinez-Vazquez and Torgler2008).
Although these services are typically provided by governments, it is not uncommon for non-state service providers to contribute to public service provision as well. These non-state providers include, but are not limited to, NGOs (Boulding and Gibson, Reference Boulding and Gibson2009; Boulding, Reference Boulding2010; Nelson-Nuñez, Reference Nelson-Nuñez2019), individual citizens (Adida and Girod, Reference Adida and Girod2011), rebel groups (Heger and Jung, Reference Heger and Jung2016; Huang and Sullivan, Reference Huang and Sullivan2021; Mampilly and Stewart, Reference Mampilly and Stewart2021), religious groups (Calderisi, Reference Calderisi2013), and firms (Frye, Reference Frye2006; Polishchuk, Reference Polishchuk2009; Hönke and Thauer, Reference Hönke and Thauer2014). The phenomenon of non-state actors “acting” like states—supplementing or replacing the state as the legitimate provider—is one that has attracted considerable scholarly attention as we grapple with what, if anything, this non-state involvement does to the relationship between individuals and the state. Nelson-Nuñez (Reference Nelson-Nuñez2019), for instance, uses evidence from Peru to demonstrate that NGOs can either strengthen or weaken relationships between individuals and the government, based on whether the NGOs appear to be replacing the need for government interaction or not, and how much information the NGO provides. Work on rebel groups by Loyle et al. (Reference Loyle, Braithwaite, Cunningham, Huang, Huddleston, Jung and Rubin2022) and Loyle et al. (Reference Loyle, Cunningham, Huang and Jung2023) questions whether our focus on the state as the default provider may be misguided. In the context of firms specifically, Dawkins (Reference Dawkins2021) finds that government contracting—companies delivering a service that is funded by governments—can reduce citizen buy-in, creating a situation where people blame governments for failures and do not believe the government to be accountable.
The history of companies providing public services to their workers and communities dates back to the very first multinational corporations (Rothkopf, Reference Rothkopf2012). In the very early days, the overlap between multinational corporations and the state was, in some cases, almost complete — India was the British East India Company and Indonesia was the Dutch East India Company (Stern, Reference Stern2011). These companies not only provided public services, but also performed other tasks commonly associated with governments, such as raising armies (Rothkopf, Reference Rothkopf2012). As the role and strength of states grew, corporate service provision remained prominent but became slightly more modest in scale. By the early Twentieth Century, it was not uncommon for companies to house, educate, protect, and entertain their workers, both in response to weakness on the part of the state and to slow the development of labor unions (Jacoby, Reference Jacoby1997), although some corporate service provision in that time period can be attributed to CEOs with grandiose visions of social change (Grandin, Reference Grandin2010). Footnote 2
In more modern times, companies are involved in service provision in multiple ways. The primary way is through taxation: companies pay taxes on many aspects of their business (e.g., income, property), and some portion of these tax dollars go to fund public services. Some companies also explicitly partner with governments, through public–private partnerships (PPPs), to provide services, especially infrastructure (such as roads and bridges). In other instances, there is private contracting contracting, in which a company is contracted and paid by the government to provide a service (Dawkins, Reference Dawkins2021).
Companies also sometimes provide grants to support public services in communities where they operate or provide public services in-kind to these communities. These are often one-time gifts in which a company decides to gift money or assets to a government specifically to support the creation or delivery of some particular service. Although this is like taxation in that companies are merely providing assets to the government to support service delivery, it is voluntary and gives the company say over how the money is spent. Unlike PPPs and privatization, which also are voluntary and allow the company to dictate where the money is spent, however, the company does not profit directly from the service provision.
Even without profit, there are many reasons why companies may opt to involve themselves in public services. There is some evidence, for instance, that it may help with reputation management (Kerner and Sumner, Reference Kerner and Sumner2020; Sumner, Reference Sumner2022). It may be also be useful for advertising, public relations, and employee recruitment and retention. In his 2018 letter to CEOs, Larry Fink, CEO of the investment management company BlackRock, made the case for companies engaging in service provision as follows, focusing both on government failures and societal demand:
“We also see many governments failing to prepare for the future, on issues ranging from retirement and infrastructure to automation and worker retraining. As a result, society increasingly is turning to the private sector and asking that companies respond to broader societal challenges. Indeed, the public expectations of your company have never been greater. Society is demanding that companies, both public and private, serve a social purpose. To prosper over time, every company must not only deliver financial performance, but also show how it makes a positive contribution to society. Companies must benefit all of their stakeholders, including shareholders, employees, customers, and the communities in which they operate.”
Many individual companies self-report some subset of their community engagement efforts on corporate websites, which can give us some sense of prevalence. For instance, on a web page titled “What does Walmart do for local communities?”, the retail company describes its efforts to be “intentional about leveraging our strengths, associates and other resources to build resiliency in communities,” including engaging in disaster relief and awarding local cash grants of up to $5,000 to address local community needs, including animal shelters and services for elders. Footnote 3 In its 2022 Community Impact Report, Amazon draws attention to its efforts to improve affordable housing stock and its partnerships with food banks to fight food insecurity (Amazon Corporation, Reference Corporation2022). Apple and CVS Health both have local community grant programs. Footnote 4,Footnote 5
These corporate donations blur the lines between public and private service provision, since the funds are private and how they are spent is directed by a private company, but the delivery of the service is done by a government. Footnote 6 In addition, services supported by corporate donations are often branded in ways that highlight the corporate origins of the funding, in the form of a sign or a name (e.g., General Mills Nature Area, Target City Steps), which distinguish them from other public services. This raises the question of whether this blurring also changes how people respond to the quality of the service. In other words, when companies are responsible for funding a public service, do people still hold the providing government accountable for its quality? In the next section, we explain why we expect corporate donations to reduce the probability people hold their governments accountable for service quality.
Theory
Typically public services are delivered by local governments (see, e.g., de Benedictis-Kessner and Warshaw, Reference de Benedictis-Kessner and Warshaw2020; Rugh and Trounstine, Reference Rugh and Trounstine2011), but funded largely by taxes from residents and resident businesses. Footnote 7 This is an example of a principal–agent relationship: the resident, as principal, has an interest in receiving good-quality public services but cannot do so on their own. Instead, they pay money to the government (the agent), entrusting it to use the money in part for public services. Footnote 8
In this particular principal–agent dynamic, the resident has limited ability to monitor what the government is doing. Even if it’s possible, the average resident is unlikely to scour budgets for the details of service delivery expenditures or take pains to figure out the logistical details of how and why any given public service is delivered by the government. Depending on the service, it can be possible under certain conditions to monitor aspects of service delivery—for instance, watching government workers renovate a park, or pave potholes—but it’s not possible to monitor all aspects of service delivery or delivery of all services. Ultimately, residents are typically best able to merely observe the services they receive and make some judgment about whether those services are bad and whether their taxes were well-spent. Footnote 9 Even if residents can monitor, it isn’t clear monitoring would change the outcome, and the ability to actually intervene is also substantially limited.
This raises the question of what residents learn and do when they observe public services that are bad. We argue that when people observe that public services are bad, they conclude that the agent is not carrying out the interests of the principal.
Residents have limited options for sanctioning the government if they think the services they receive are bad. Since taxes are compulsory, residents cannot withhold their taxes if they think the government is providing services poorly. They can’t get their money back. Unlike consumer goods, they can’t “return” a park, a road, or streetlights for a better version. In lieu of sanction, they could potentially “exit” (Hirschman, Reference Hirschman1970) the principal–agent framework by moving to a place where they think the “agent” will spend the money better, but moving is a dramatic, expensive option, and often prohibitively so for people with lower incomes.
Consequently, for most people, the clearest and perhaps only option for dealing with bad quality services is to try to change the agent, substituting an agent who might be more responsive to their desires. In this case, that means rejecting the incumbent government and aiming to replace it with a government they think might be a better steward of their resources. Changing the government requires political action: voting against the incumbent who provides poor-quality services and in favor of a challenger who might do a better job. This implies that when people feel the government is spending their money badly on public services, the quality of those services ought to inform their vote.
Voting is, however, a blunt instrument. A simple vote for or against a suite of incumbents will be informed by many different things: experience with public services, general partisanship, a view of what the best future might look like, or an interest in lower taxes or more aggressive economic development, and the availability of more favorable candidates, to name a few. With so many different factors influencing how someone votes, they might also tend to push in different directions. For instance, someone who disagrees with how the government is spending their money on services might still vote for incumbents because they don’t see any of the challengers as an improvement, or because other candidates might raise their taxes or have differing views on social policy. So the link between a bad quality public service and voting is, we argue, present, but likely to be a weak relationship.
When people know that companies are funding or providing public services, the game changes and so too do our expectations about holding elected officials accountable. The underlying dynamic behind service provision is still principal–agent—the entity providing the funding and interests is not the one carrying out the task—but it introduces another principal: the company making the donation. In the case of a company providing money, as well, the additional principal may be seen as having its own political motives and agendas. The addition of another principal, and one with its own political agenda, raises the question of whether the resident is the “primary” principal, the one the agent listens to if the interests of the two principals diverge, or whether the agent is prioritizing the corporate principal. A bad public service might, under these circumstances, be indicative of an agent carrying out the interests of another principal with a divergent interest, rather than evidence of failure to perform to specification.
We argue that whether people perceive themselves as being the primary principal in this relationship hinges on whether they perceive the corporate donations to be letting taxpayers “off the hook” for funding the service. That is, corporate donations can be perceived as reducing the taxpayer’s expenses (letting them off the hook) or just supplementing taxpayer expenses that either stay the same or increase, in which the corporate donations function as something extra, but not taking over the funding burden from the taxpayers. If people perceive the company’s role as letting them off the hook, then they are less likely to perceive themselves as the primary principal. If the company’s donations are seen as adding to—not reducing—the taxpayer’s expenses, we expect that the resident still sees themselves as primary principal, as their contribution is not changing.
If the resident does not perceive themselves to be the principal, as is the case when the company’s donation reduces the taxpayer’s contribution, then changing the agent—voting against incumbents—no longer necessarily follows, since the resident cannot know if the agent is accurately carrying out the corporate principal’s interests instead of failing to carry out their interests. Changing the agent, in this case, might result in exactly the same service quality if the underlying problem is divergent principal interests. As such, corporate public service provision severs the logical link between observing bad service quality and voting. Since voting is how people hold their governments responsible for public service delivery, this implies that corporate public service donations ought to reduce the probability people hold their governments responsible for public service delivery.
As such, our expectation is that when companies donate to public service provision in a way that reduces perceived taxpayer burden, people are less likely to hold their elected officials responsible for poor-quality services than they would in other circumstances.
Research design
Observational data about corporate public service donations is limited, as is survey data and electoral data at the municipal level. As such, we employ a two-pronged research design approach that couples the observational data that do exist with a survey experiment. For both, we use data on public parks, due to the general familiarity people have with them, the high incidence rate of corporate donations to fund them, and the availability of the truly excellent data from the Trust for Public Land which is, to the best of our knowledge, the only cross-city data set on private spending on public services. Although we cannot definitively state that our findings generalize to other services, we do not have theoretical reasons to expect our findings to be limited to parks. Footnote 10
First, as a very preliminary test, we use data from the Trust for Public Land on the funding of public parks in the 100 most populous cities in the United States, which gives us an idea of how much private money is spent on parks in major cities in the United States. We pair this with election data collected from Ballotpedia for those same cities, which permits us to see whether and how voter turnout is associated with private funding of parks. Footnote 11 This type of analysis has the benefit of external validity, in that it reports how actual people really respond in a certain situation, but at the cost of being an imperfect test of the hypothesis. Specifically, our theory is at the individual unit of analysis and focuses not on turnout, but whether people hold their elected officials responsible for poor service quality. As such, the observational data is descriptive and informative, and, paired with the experiment, it paints a more complete picture of how private funding of public services influences the relationship between individuals and the government. Footnote 12
For a more complete test of our hypothesis, we use a survey experiment. Survey experiments of this type have the benefit of internal validity (testing the specific hypothesis being proposed while being able to hold constant many other factors), at the cost of external validity: we ask people to tell us how they might hypothetically respond in a given fictional scenario. Despite the lack of external validity, there are aspects of our theory that make a high level of control over the description and messaging around the service and the company’s donation desirable. There are two primary reasons for this. The first is that we assume a single unitary resident-principal, which permits us to further assume no variation in how they would define a “bad” service. Given this assumption, we want the ability to describe the service and clearly convey that the quality is bad. The second is that how people learn about corporate public service donations (or whether they know about them at all) are likely theoretically important, but assumed away in our theory. As such, we want to control how that information is delivered such that the delivery mechanism and the information provided are held constant.
In our experiment, we provide people with an email newsletter from a fictional city (“Blaisdale”). The newsletter contains an announcement of a new city park and information about the city council agreeing to change local taxes for the next year. To maximize external validity and realism, the newsletter is adapted nearly verbatim, including formatting but omitting identifying details and images, from a newsletter sent to residents of the City of Minneapolis in early 2022 announcing the opening of a new park. The park that is described, in its original form, is funded largely by corporate donations and has park elements named after major corporate donors. The original email also describes the city council approving a 2023 budget with a local tax increase.
Delivering the information in this format has several benefits. First, it allows us to hold constant what information people have about the funding of a public service and how they receive that information. Second, it allows us to provide information in a realistic format that mirrors how people may receive this information in real life, increasing the external validity of our findings.
Within the email, there are two treatments. The first treatment is whether the funding for the city park came from a corporate donation or from taxpayers. If the funding came from corporate donation, three elements of the park bear the names of large sponsoring corporations (Bank of America, Columbia, General Mills). Participants are also told “The Blaisdale Parks Foundation provided the majority of funding for this project through its capital campaign, which raised more than $18 million from corporate donations for riverfront park projects.” If participants are in the taxpayer-funding group, the three park elements are given generic, non-corporate names (Linwood, Clawson, Elmhurst) and they are told the Parks Foundation raised more than $18 million from taxpayers for the riverfront park projects.
The other treatment is whether taxpayers are told local property taxes are decreasing or increasing. This is meant to provide people with information from which they infer that the corporation contribution is reducing the taxpayer contribution (decreasing taxes) or not (increasing taxes) in the most realistic way possible, since typically corporate donations are not paired with any discussion of the composition of the rest of the funding. Participants in the tax decrease group were told that the city’s 2023 budget, adopted by the City Council, included a 5.45% levy decrease and that “The City portion of the property tax of a residential homestead property valued at $297,000 will decrease about 10%.” Participants in the increasing group are told that the budget included a 5.45% levy increase, and that City portion of the property tax would increase by about 10%.
Our tests combine these two treatments. The group of primary theoretical interest is the group told that the park is funded by corporate donors and that taxes are decreasing, meant to convey that the companies’ money was reducing what taxpayers otherwise would have paid. We can compare this with the group that had corporate donors and increasing taxes—a group of people we expect to see themselves as primary principal despite the corporate donor, due to the increased tax burden—and with the group of people who believe the park to be strictly taxpayer-funded. Footnote 13
After reading the newsletter, participants are asked to respond to fictional scenarios based on the email they read. The primary question of interest to us in this paper describes a situation in which the public service (park) is in very bad shape and asks people whether the state of the park would factor into their decision to reelect the current city council. Footnote 14 Possible options are to blame the city council for failures (yes), not blame the city council (no), or “I’m not sure.” To analyze this, we will omit the “I’m not sure” group and run a logistic regression predicting blame (“yes”). We chose this way to measure the underlying dependent variable concept because we wanted to tie political action to the service in question. We also think this phrasing of the question is less likely to result in social desirability bias than simply asking people if they intended to vote.
The independent variables are the two treatments and their interaction term. We expect that people in the corporate donation group are less likely to blame the government for failures than people in the taxpayer group, but only if they expect their tax burden is decreasing.
Sample
Observational data
For our observational tests, we first collected data from the Trust for Public Land, a US non-profit that, among other things, produces an annual ParkScore that scores and ranks the 100 most populous cities on the basis of the quality of their public parks. In addition to this score, they also publish some of the data that underlies the scores, including the per capita private spending on parks and per capita public spending on parks. We use the data from the two most recently available fiscal years, 2021 and 2022 (Trust for Public Land, 2023). Footnote 15 For each city-year, we also collect data from Ballotpedia on whether the city had a mayoral election, how many votes were cast total in the general election for that mayoral election Footnote 16 We divide the total number of votes cast by the population of the city, as provided by the Trust for Public Land, to produce a turnout number that is the proportion of the total population—not necessarily the total eligible voting population—that voted. As such, this number should correlate strongly with the percentage of the total voting population that voted, but should not be exactly the same. A complete list of cities and mayoral election years is in Appendix 1. The lowest votes per capita was in Garland, TX in 2021 (2.80%), and the highest was in Louisville, KY in 2022 (43.22%). The median votes per capita was 19.06%, and the mean was 18.69%.
In 2021, 53% of cities in the sample report zero per capita private spending on their public parks and in FY 2022, 39% of cities report the same. As Figure 1 illustrates, the majority of cities have little private spending per capita on their public parks. Indeed, 70% of cities report $3.00 or less per capita in private spending in FY 2021 and $3.15 or less in FY 2022. For FY 2021, the cities with the highest per capita private spending were San Francisco ($104), St Louis ($55), Des Moines ($39), Austin ($38), Pittsburgh ($35), Detroit ($33), and Atlanta ($31). Although the Spearman rank-order correlation between FY 2021 and FY 2022 are high (0.95) and 2021’s per capita private spending is highly predictive of 2022’s per capita private spending (β = 1.07, p < .001), the top spenders of private money in 2022 were slightly different: Memphis ($94.98), San Francisco ($65.96), Atlanta ($52.83), St. Louis ($49.90), Boston ($42.79), and Houston ($41.24). Private and public spending per capita are not highly correlated (ρ = .0.10 in FY 2022 and ρ = .0.21 in FY 2021), suggesting that places that have high per capita private spending are not simply places with high spending overall.

Figure 1. Private spending on public parks per capita for the 100 most populous cities in the United States in FY 2022, as collected by the Truth for Public Land.
Experimental data
We fielded the experiment on Lucid in September 2022. After filtering out people who gave incomprehensible responses to a text-box question for gender, we had 966 responses. In addition, we asked a single attention check question to gauge whether people were reading and understanding the treatment. We asked whether the city council had announced an intention to raise, lower, or keep property taxes the same. 50.5% of respondents answered the question correctly, and those people remain in the sample while those who answered incorrectly are removed. This results in a sample of 490 people. Footnote 17
Results
Observational
For our observational results, we use mayoral votes per capita as our dependent variable, the percentage of total per capita spending that came from private sources as our independent variable, and we control for year and whether the election had an incumbent. In a second model, we use private spending per capita as an independent variable on its own, and control for public spending per capita, alongside incumbent presence and year. We consider the presence of an incumbent in the race as an important confounding variable as it is likely correlated with turnout and also because the incumbent mayor may have had a hand in attracting private donations and thus be associated with those donations.
As Table 1 illustrates, we find that private per capita spending—whether as a percentage of total spending (1) or simply on its own per capita, controlling for public per capita spending (2)—is strongly associated with an increase in votes per capita in mayoral elections in 2021 and 2022. Footnote 18 In Model (2), we also find an increase in public spending per capita is also associated with an increase in votes per capita, although the magnitude of the effect is smaller than private spending. Although the theory is silent on whether people vote, but instead speaks to what aspects of government performance influence how someone votes, the results are nonetheless useful in identifying a clear link between parks spending and voting at the city level, at least in the largest US cities. Whether this is an association or whether there is a causal link, and in what direction that causal link exists if it does, are beyond the capacities of this data. For a clearer test of the theory itself, in the next section we analyze the experimental data.
Table 1. Regression results for observational data
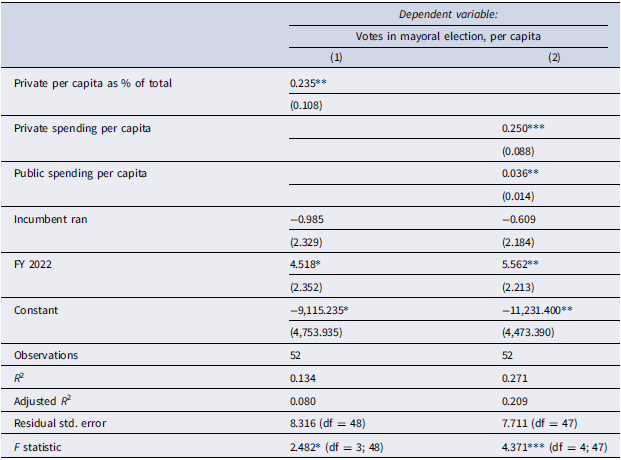
Note: *p < 0.1; **p < 0.05; ***p < 0.01.
Experimental
As our dependent variable for the experimental analysis, we recode the underlying variable (If the park is bad, would it factor into decision to reelect city council?) into a dichotomous variable that takes on a value of 1 if yes and 0 otherwise. Accordingly, we run a logistic regression in which the key independent variables are the two treatments—whether the person was in the corporate donation or taxpayer group, and whether they were told taxes were going down or up—and the interaction between the two. Our theoretical expectation is that the combination of the two—corporate donation and taxes going down—will be associated with a decreased probability of factoring the park’s (bad) quality into reelection decisions.
Because we remove people who failed the attention check, we include controls in the model, since although the treatments were randomly assigned, attention to treatment was not. We opt to control for whether people frequently go to parks, as we expect it to be correlated with reading the treatment (which was about parks) and also factoring park quality into a reelection decision. We also control for where someone lives (rural, sub-urban, or urban), gender, whether the respondent identifies as white or not, education, and age.
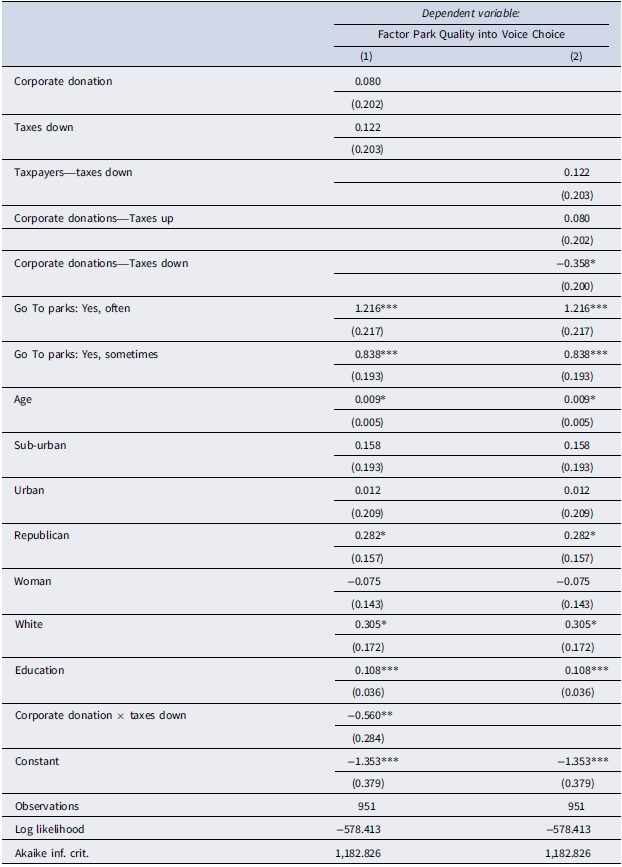
The results in Table 2 support our expectations. Footnote 19 In Model 1, which includes the interaction term, the interaction term is statistically significant and in the same direction as anticipated by the theory (negative), whereas neither constituent term is significant. What this means is that the effect of being in the corporate donation treatment on the probability of factoring park quality into reelection has no effect when taxes go up (the coefficient on philanthropy is positive but not significant), but is negative when taxes go down—indicating that the combination of the two results in a lower probability of factoring parks into reelection. Similarly, the effect of taxes going down may be zero when in the taxpayer group (coefficient on taxes going down is negative but insignificant), but it is negative and statistically significant when in the corporate donation group. This is as the hypothesis predicted: corporate donations decrease the probability of factoring service quality into voting, but only when it’s seen as replacing tax dollars.
Table 2. Logistic regression for which dependent variable is whether park quality factors into someone’s decision to vote when the park quality is bad. Omitted categories are “rural” (for location), “not Republican,” “not woman,” and “non-white, including bi- or multi-racial”

Note: *p < 0.1; **p < 0.05; ***p < 0.01
Figure 2 illustrates these results, presenting the predicted probabilities of answering yes to the dependent variable for each combination of treatment groups. What the predicted probabilities highlight is that the key treatment group of interest—people who are told companies donated money to fund the park, and also that taxes were going down—were significantly less likely to answer that the state of the park would factor into their voting decision. Although there is some overlap of the confidence intervals between this category and the taxpayers-taxes down group, the point estimate itself is not within that confidence interval and is visibly much lower than in the other three groups, which have more substantial overlap.
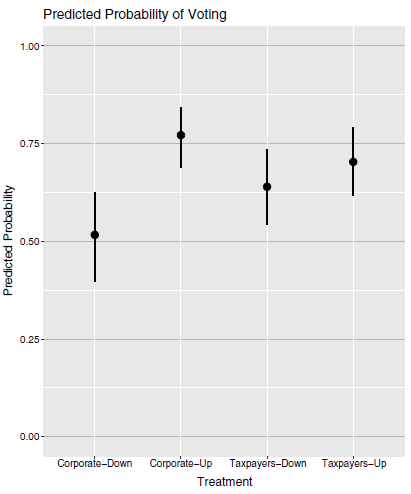
Figure 2. Predicted probability of answering yes to the dependent variable. 84% confidence intervals are simulated. All controls held constant at their median (continuous) or mode (categorical).
Table 3 replaces the interaction term and constituent terms with a 4-category independent variable that combines the 2x2 treatments of the experiment. As the results show, the resulting coefficients are nearly identical, as one would expect: interacting two dichotomous variables is roughly equivalent to creating a single 4-category independent variable, in which the omitted category is equal to having zeros for both dichotomous treatments. The benefit of this model is ease of interpretation: what we find is that relative to people in the taxpayers-tax increase category, people in the category of interest (corporate donations-taxes decrease) are significantly less likely to report factoring park quality into their reelection decision. Although this interpretation varies somewhat based on which category is omitted for reference, the substantive results remain the same: the combination of the two treatments drives down the probability of incorporating park quality into the reelection decision.
Table 3. Logistic regression for which dependent variable is whether park quality factors into someone’s decision to vote when the park quality is bad. Omitted categories are “rural” (for location), “not Republican,” “not woman,” and “non-white, including bi- or multi-racial.”
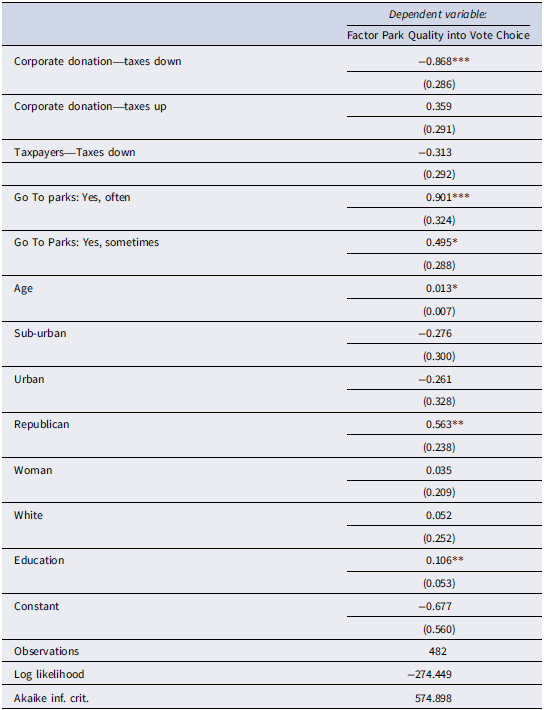
Note: *p < 0.1; **p < 0.05; ***p < 0.01.
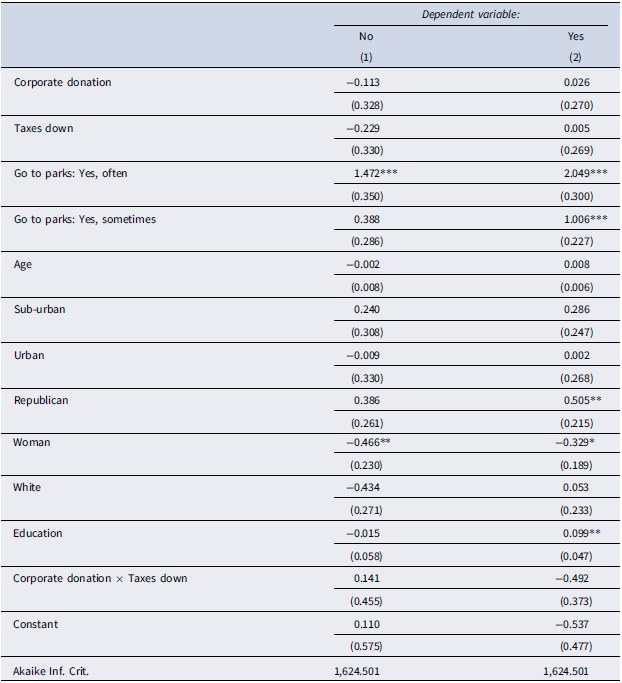
Table 4 relaxes the decision to dichotomize the original dependent variable into yes or not yet and instead shows the results of a multinomial logit when that variable is treated as categorical (Yes/No/I’m Not Sure). Each of the two columns in Table 2 represents the effect of each variable on the probability of answering No (Column 1) or Yes (Column 2) relative to answering “I’m not sure.” The key finding in this table is that, as predicted, people in the corporate donation-taxes down group (the interaction term) are less likely to say yes when asked if they will factor the bad quality of parks into their decision to reelect the city council, as compared with people who said they don’t know. The coefficient on the interaction term for reporting no is also negative, but not statistically significant. The signs on the control variables indicate that these variables often predicted having an opinion at all relative to answering “don’t know.” For instance, Republicans are more likely to say yes than don’t know (and this is statistically significant), but the coefficient predicting saying no relative to saying don’t know is also positive (if not statistically significant).
Table 4. Multinomial logistic regression predicted saying “no” or “yes” when asked if park quality factored into the vote decision, compared with “I’m not sure”
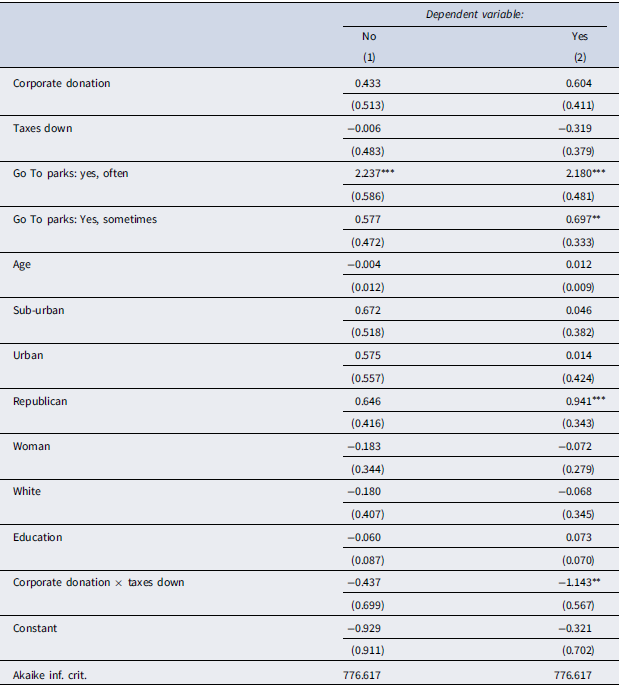
Note: *p < 0.1; **p < 0.05;***p < 0.01.
Discussion and conclusion
Under certain circumstances, it can be beneficial for companies to voluntarily contribute money or assets, such as land, to a municipal public service. Doing so may provide some benefits to the company and can help municipal governments cope with tight budgets. In this paper, we ask whether this phenomenon of corporate donations to public services changes how residents respond to a bad quality service. We argue that when companies donate, and that donation is seen as reducing the amount that residents would otherwise have paid, that residents no longer perceive themselves to be the “primary principal” in the principal–agent relationship with the government. Instead of viewing a poor-quality service as they otherwise would have—as evidence the government is being a poor steward of the residents’ resources—they can instead interpret poor-quality services as possible evidence the government is instead taking their directions primarily from the corporate donors.
Using data on private funding of parks in large US cities from the Trust for Public Land, we find an unanticipated finding, that greater private spending on parks per capita is linked—at least in a small sample of large US cities, and with few control variables—with higher voting per capita in mayoral elections. Then in a survey experiment, we find convincing evidence that the combination of corporate philanthropy and tax cuts, meant to mimic how people would receive information about both corporate donations and its likelihood of reducing taxpayer burden, reduces the probability people would factor the poor quality of a service into their vote to reelect the local government. When we take these two findings together, it suggests to us that corporate spending on parks may increase aggregate voting (though through mechanisms we have not theorized about), but that there is the potential for corporate donations in public services to influence the reasoning behind and content of that vote. In other words, after our analyses, we do not expect that corporate donations in public services reduce the probability of voting, but instead, as our theory suggests, the donations shift how people think about and relate to their government, and how or if they hold the government accountable.
Our findings in this article are strictly limited to the United States. Our observational data is limited to a subset of 100 large US cities that had a mayoral election in 2021 or 2022, and our experimental data is limited to residents of the United States. Thus we can say with some confidence that our findings hold in the United States. Our theory, however, does not necessarily have such narrow scope conditions—the principal–agent relationship (and breakdown thereof) that we describe could, in principle, occur in any democracy in which (a) people generally expect their local government to provide public services and (b) they generally expect their tax dollars to fund said services, conditions which plausibly broaden the theoretical scope to most wealthy democracies. Similarly, our empirical results are limited to the funding of parks, but our theory is less constrained. Future testing of this theory, with different services and in different contexts would provide not only additional evidence, but further nuance.
As with any experimental study, our research design is primarily intended to test a hypothesis in a controlled way, and while it does that, it also raises questions about how these findings can be built on and extended. For instance, it is likely that how someone finds out about corporate public service donations might influence how this information affects them. In our study, we use a city government email to convey the information, but this raises questions about whether someone would react differently if they learned about this from other sources, such as a sign at the point of service delivery itself, through a corporate website or mailing, from a newspaper, or from an activist group that opposes the donation. Each of these information delivery mechanisms would frame the information differently, which could influence both what people know as well as how they feel about it.
Similarly, in our study we carefully deliver information about whether taxes are going up or down to imply to participants whether the corporate donations might be offsetting taxpayer money. In reality, this is likely to not be delivered as cleanly or in as close of proximity to the information about corporate donations, and thus in many cases people might reasonably be forming their own conclusions about how the corporate donation relates to their financial contribution to services. How people form these beliefs in a low-information environment warrants further theorizing and would suggest further hypotheses about the effects we predict vary by, for instance, demographic variables that might shape those beliefs.
Finally, in the real world, these types of corporate donations in public services are unlikely to be uniformly distributed geographically or throughout society. If the distribution of corporate donations to public services is correlated with other variables that might predict a lack of government trust or belief in political efficacy, one might expect our results to change, and either to be heightened (if people are primed to believe the government isn’t listening) or perhaps attenuated (if people’s belief the government doesn’t listen to them is stable regardless of who funds the services). Alternatively, if they occur in places where people have high levels of political trust and political efficacy, it is against possible that the results might either be heightened or attenuated. The best way to test this would be to collect systematic observational data about corporate donations in public services, both to evaluate how the occurrence of the phenomenon covaries with demographic variables that might predict these orientations toward government, and then to test resulting theories observationally. Our evidence is suggestive that corporate donations in public services may have negative consequences, indicating the importance of additional research to determine if these types of donations may degrade democratic participation under real-world settings.
Acknowledgments
The authors would like to thank Andrew Kerner for his detailed feedback and Ellen Key for her assistance with data and methods. In addition, the authors would like to thank seminar participants at Michigan State University as well as the reviewers for their thoughtful and constructive feedback.
Competing interests
The author(s) declare none.
Appendix
A List of cities and mayoral election years
This section contains a list of every city in our sample, along with whether they had a mayoral election in 2021, 2022, or neither. The statistical models include only the cities that had mayoral elections in these two years. The remainder of the cities are not included in the statistical models but are included in the descriptive data. For consolidated city-counties (e.g., Charlotte-Mecklenburg, NC), the mayoral election data is for the city, not the entire covered region. Election data is from Ballotpedia and was compiled by the authors.
2021 elections: Albuquerque, NM; Anchorage, AK; Arlington, TX; Atlanta, GA; Boston, MA; Buffalo, NY; Cincinnati, OH; Cleveland, OH; Detroit, MI; Durham, NC; Fort Worth, TX; Garland, TX; Hialeah, FL; Jersey City, NJ; Miami, FL; Minneapolis, MN; New Orleans, LA; New York, NY; Omaha, NE; Pittsburgh, PA; Plano, TX; San Antonio, TX; Seattle, WA; St. Louis, MO; St. Paul, MN; St. Petersburg, FL; Toledo, OH.
2022 elections: Anaheim, CA; Austin, TX; Chandler, AZ; Charlotte/Mecklenburg, NC; Chula Vista, CA; Corpus Christi, TX; Greensboro, NC; Henderson, NV; Irvine, CA; Laredo, TX; Lexington/Fayette, KY; Long Beach, CA; Los Angeles, CA; Louisville, KY; Lubbock, TX; Milwaukee, WI; Newark, NJ; North Las Vegas, NV; Oakland, CA; Oklahoma City, OK; Raleigh, NC; Reno, NV; San Jose, CA; Santa Ana, CA; Washington, DC
Elections in neither year but included in descriptive data: Arlington, VA; Aurora, CO; Bakersfield, CA; Baltimore, MD; Baton Rouge, LA; Boise, ID; Chesapeake, VA; Chicago, IL; Colorado Springs, CO; Columbus, OH; Dallas, TX; Denver, CO; Des Moines, IA; El Paso, TX; Fremont, CA; Fresno, CA; Gilbert, AZ; Glendale, AZ; Honolulu, HI; Houston, TX; Irving, TX; Jacksonville, FL; Kansas City, MO; Las Vegas, NV; Lincoln, NE; Madison, WI; Memphis, TN; Mesa, AZ; Nashville/Davidson, TN; Norfolk, VA; Orlando, FL; Philadelphia, PA; Phoenix, AZ; Portland, OR; Richmond, VA; Riverside, CA; Sacramento, CA; San Diego, CA; San Francisco, CA; Santa Clarita, CA; Scottsdale, AZ; Spokane, WA; Stockton, CA; Tampa, FL; Tucson, AZ; Tulsa, OK; Virginia Beach, VA; Wichita, KS; Winston-Salem, NC
B Full sample results
In this appendix, we show the model specifications from the main text but we do not drop people who did not pass the attention check (Table B.1). This means it includes people who did not read or did not understand what was happening to taxes in the newsletter. As expected, our results are substantively unchanged, but are less significant and are closer to zero, in accordance with the increased noise of including observations who did not take the treatment. In the multinomial logit, however, we find that our results do disappear when we no longer dichotomize the dependent variable (Table B.2).
Table B.1. Results from Models 1 and 2 in main text but including people who did not pass attention check
Note: *p < 0.1; **p < 0.05; ***p < 0.01.
Table B.2. Results of multinomial logit models predicting answering “No” (Model 1) or “Yes” (Model 2), relative to people who answered “I’m not sure”.
Note: *p<0.1; **p<0.05; ***p<0.01.
C Results without controls
In the main text, we included controls because although the treatment was randomly assigned, paying attention to the treatment (and thus remaining in the sample after we dropped people who failed the attention check) was not. In this appendix, we present the models with no controls. As the models show, our findings remain unchanged.
Table C.1. Models 1 and 2 from the main text without controls

Note: *p<0.1; **p<0.05; ***p<0.01.
Table C.2. Multinomial logit results without controls

Note: *p<0.1; **p<0.05; ***p<0.01.


 Open access