

The President-Elect (Mr J. Constantinou, F.F.A.): I am pleased that Michael Green, the executive director of the Social Progress Imperative, is going to be delivering the Spring Lecture.
The lecture is part of our commitment to events that promote thought leadership and advance actuarial science. These lectures are useful resources for our members and non-members alike on subjects of relevance, not only to actuaries but to society in general. This year’s lecture is no exception.
Some of you might be aware that the IFoA’s thought leadership campaign for 2018 is around the United Nations’ Sustainable Development Goals (SDGs). We have been asking our members, actuaries and actuarial bodies across the group, how can we contribute to the achievement of these goals? We are obtaining some interesting feedback which will be in place to share with you sometime in the future.
I am particularly looking forward to Michael’s lecture. I am keen to hear a lot more about the work of the Social Progress Imperative and how it collects and interprets data to measure this aspect of global development.
In his lecture, Michael will be explaining what social progress really means. He will also be highlighting the importance of rigorous and meaningful measurement to help quantify how our nations are coping with the world’s biggest challenges.
Michael is a thought leader on these matters. An economist by training, he previously served as a senior official in the UK Government Department for International Development, where he managed British aid programmes to Russia and the Ukraine. His technology entertainment and design (TED) talks have been viewed more than 2 million times. His 2014 talk was chosen by the TED organisation as one of the most powerful ideas of 2014, and by the Telegraph as one of the ten best ever.
He is the co-author of Philanthrocapitalism: How Giving Can Save the World and The Road from Ruin: A New Capitalism for a Big Society. In 2016, he was named one of the hundred most connected men in Britain by GQ magazine and featured in the Non-Profit Times Power and Influence Top 50. Without further ado, please join me in welcoming Michael Green.
Mr M. Green (Executive Director, Social Progress Imperative): Thank you to the Institute and Faculty of Actuaries for the chance to come to speak to you. For me it is a real opportunity. The work that we are doing on social progress we really think is relevant to the actuarial profession, and I think that the actuarial profession has a huge contribution to make towards the way we rethink finance to deliver SDGs. I will talk a bit more about that later.
Let me take you back in time to 4 January 1934 when a young man presented a report to the US Congress that still shapes the lives of everyone in this room today. It still shapes the lives of everyone on this planet. That young man was not a politician. He was not a captain of industry or a titan of Wall Street. He was not a faith or civil society leader. He was that most unlikely heroes, not quite an actuary but an economist.
His name was Simon Kuznets. His report was entitled the “National Income, 1929-32.” It does not look much of a best seller, does it? A bit dry. But this report is the foundation of the system of national accounting that we know best in its form as gross domestic product or GDP. For those of you who are very precise, I am going to talk about that whole system of national income accounting in its various forms just by referring to it all as GDP.
Kuznets’s innovation has had a huge impact on this world. Trillions of dollars move around our planet based on whether countries are going up or down in terms of their GDP. Politicians campaign on whether their GDP is going up or down. Remember Bill Clinton: “It’s the economy stupid. Economic growth is the way to get re-elected.” GDP has had a huge influence on our world. It has shaped our world for more than 50 years.
I want to talk about a different way of looking for the progress of our world, a different way to think about how we can develop our world more sustainably in a more inclusive way for the next 50 years.
First, we have to understand why Kuznets’s innovation was so important. This was, of course, the moment when the United States was plunging into the Great Depression, and the problem that policymakers had was that they did not know what was going on. Basic statistics, like GDP, that we rely on all the time did not exist.
What Kuznets’s report gave policymakers was regular, reliable estimates of what the US economy was producing. Armed with this information, eventually the US Government found a way out of the depression. This innovation proved useful. With the support of many other economists spread around the world, it was embedded in the reconstruction of Europe after the war. It was embedded in the Bretton Woods system. It has driven so much of our global economy for the past 50 years, as a metric to guide policy-making and has become the key metric and measure of progress.
But there is a problem. The person who first told us about that problem was Kuznets himself. In the introduction of his report, he writes: “The welfare of a nation can, therefore, scarcely be inferred from a measurement of national income as defined above.” It is not the greatest sound bite. But the message is clear. This system of national accounting is there to guide policy-making. It is not there to be the measure of the well-being of our societies.
But how have we ignored it? This has become the measure of the well-being, the success, of our societies, and our policy-making results from this decision. We follow the guidance of GDP in our policy-making, even though we know that GDP is blind to the environmental constraints that our planet is running up against.
GDP has nothing to say about fairness or justice. GDP counts bonds and prisons as progress.
GDP is a hugely flawed measure. Is it any surprise that we have experienced the financial crisis, the Arab Spring, the rise of populism in contexts where we have seen our economic numbers supposedly improving when clearly something else is going on in our societies?
Today I want to talk a bit about how we think differently, about how we think about the progress of our societies, how we have to give up this assumption that economic growth necessarily means improvement in our societies.
Is this a radical proposition? I do not think so. I want to show you a quotation from Michael Porter. He is the Chairman of our Advisory Board. Anyone who has done an MBA will have done Porter’s Five Forces, and he is of course the great guru on economic competitiveness. Here is a guy who has spent 30 years helping countries, regions and cities to be more economically competitive.
The lesson that he has learnt that is that economic growth on its own is not going to deliver social progress. “Economic growth alone is not sufficient to advance societies and improve the quality of life of citizens. True success, and growth that is inclusive, requires achieving both economic and social progress.”
It is this insight which is the basis of what we call the social progress index (SPI). The Social Progress Imperative is an American non-profit organisation that I run from my kitchen table in London. We have a number of core supporters, including the Avena foundation, from Latin America, the Dr Scholl Foundation, from California and Deloitte globally. We are a non-profit organisation building up this idea of a SPI, very generously advised by Michael Porter.
So what is this thing, this SPI? The one thing that you really need to remember about the SPI is that, unlike other measures of well-being, it is based entirely on social and environmental indicators. I am sure that many of you are familiar with the UN Human Development Index or the OECD Better Life Index or even Bhutanese Gross National Happiness. All these measures of well-being have conflated a range of economic and social and, in some cases, cultural measures into one super measure of well-being of society.
What we have done with the SPI is taken a different approach. We have to separate out the social from the economic, measure social progress independently and directly, and then we can understand the relationship between economic progress and social progress. The first key design principle you have to note is no economic indicators, exclusively socially environmental indicators, not because the economy does not matter, but so that we can understand how the economy matters and how the economy drives social progress.
The second design feature is we built it entirely, as far as possible, on outcomes. You are not measuring inputs. We are not measuring how much a company spends on healthcare or spends on education. We are not measuring what laws a country passes. We are measuring what is achieved in health, in education, in freedom from discrimination, those kinds of things.
Third, we want to make it relevant to all countries. It is surprising how persistent is this idea of the North/South divide, the global north and the global South. Our world has changed enormously since the Brandt report. However, we still have this language of the North and the South. Increasingly, countries are struggling with the same challenges across the income spectrum. That divide between the rich and the poor world has come together.
Fourth, critically, this was not created as just an academic exercise. We really wanted this to be something that was actionable that provides some practical value. That is through people like you, as I will come on to talk about.
Those were the design principles for the SPI. All we had to do now was define social progress. We have been working at this since at least the days of Aristotle. I do not claim that we have cracked it in the way that Aristotle did. But we have come up with a definition of social progress that we think is pretty robust.
What we are saying it is that a good society is one that does three fundamental things. First of all, does it deliver to every citizen the basic needs of survival: food, water, shelter and safety? Second, does it give citizen the building blocks of a better life: education, information, health and a good quality environment? Third, does it give every citizen the opportunity to pursue their hopes and dreams with rights, freedom of choice, freedom from discrimination and access to the world’s most advanced knowledge? This is our basic definition of social progress. It is very much grounded in the literature. Many of you will have read the Stiglitz-Sen-Fitoussi report of 2009, “Mis-Measuring Our Lives.” There is a whole literature in economics which has been about how we define social progress.
There is also, of course, the SDGs, which I will talk about later, which have been very much a foundation, along with other things like the UN Declaration of Human Rights.
Of course, we have taken this out for extensive testing with economists, political scientists, people in pubs and around the world. Figure 1 shows what has come back.
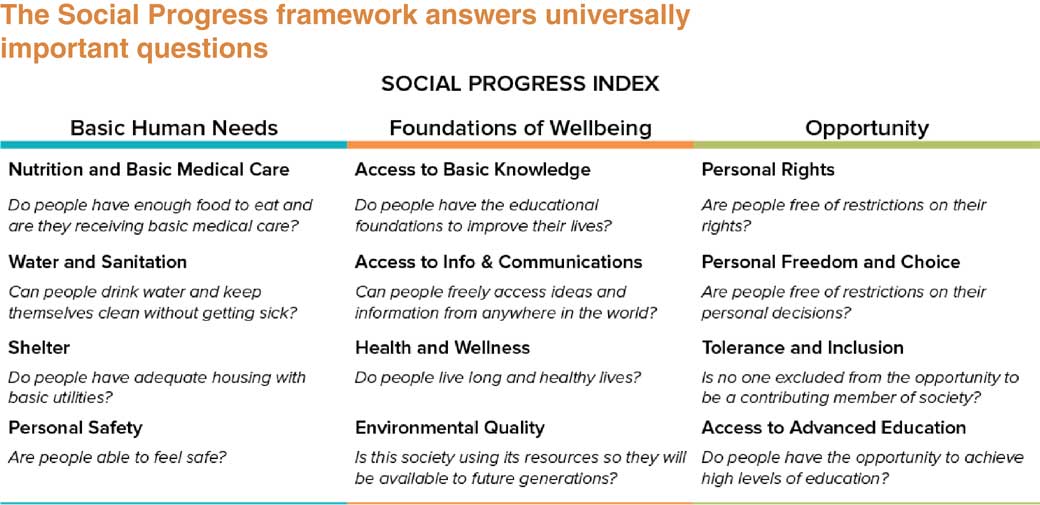
Figure 1 The social progress framework
That is the basic framework for the SPI. What we have to do now is find data to measure these things. What we do not do is do primary data collection ourselves. All our data are taken from the existing secondary sources, particularly sources that are trusted. I am not going out checking whether North Korea’s education data are correct. I am taking it from trusted global institutions. We are looking to populate this framework with indicators.
Figure 2 is a slightly complicated slide. It does not matter about the detail. This is the decision tree we make in selecting indicators. Sadly, the world has too many indices out there that are not very good. They are just a random selection of different numbers. We have gone through a very rigorous process. We have tested literally hundreds of different indicators to find the right ones that will fit together, that meet our data standards and will measure social progress accurately.
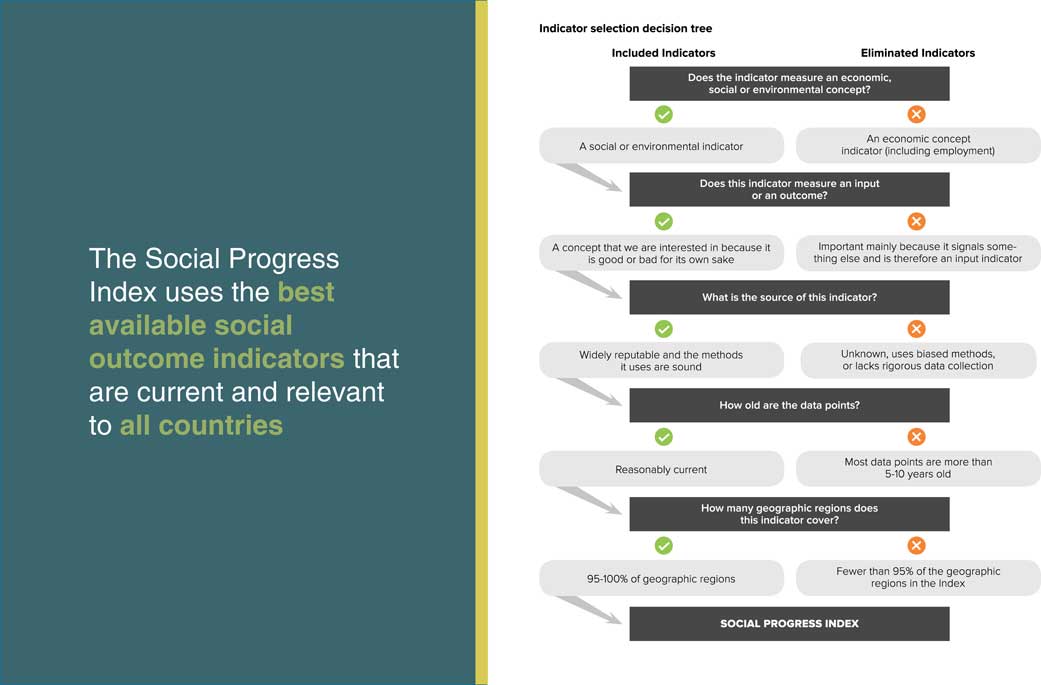
Figure 2 Indicator selection decision tree
Figure 3 shows the framework that we have. We have chosen 50 different indicators, between 3 and 6 indicators for each of the 12 components in the model, to measure in a robust way the underlying concepts. The data have taken a lot of it from the UN, from WHO, from UNESCO. We used some expert assessments, like the Pew Research Centre. We also take some data from Gallup because people’s realistic experience is meaningful data to be included in the framework.
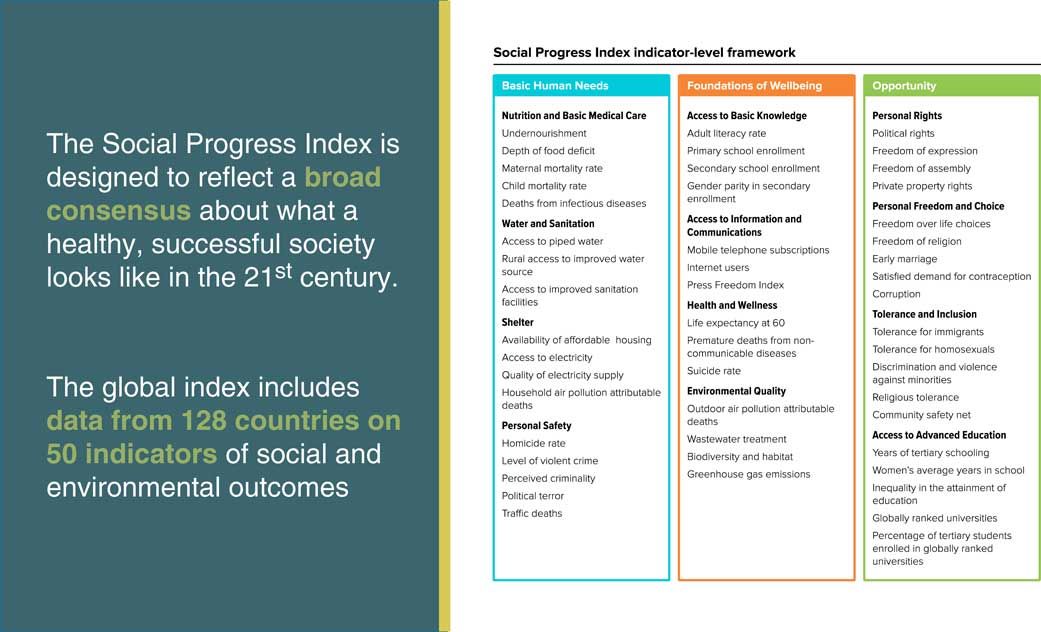
Figure 3 SPI indicator-level framework
I know there are some technicians in the audience. A brief technical digression is that the indicators themselves, the weights of indicators and selection of indicators, is based on some principal component analysis, and then the components themselves are equally weighted. In a sense, the most neutral decision we can make is to have equal weighting of the index and simplicity is a virtue.
The methodology is on our website as is the underlying data. There is no black box here. You can go in, have a look: we welcome your feedback. Every year, the index becomes better because people like you generously support what we are doing by providing your wisdom.
So that is a technical interlude. Now let us talk about who comes top. I am going to show you on Figure 4 social progress on the vertical axis and then, just for fun, it is not in the model, GDP per capita.
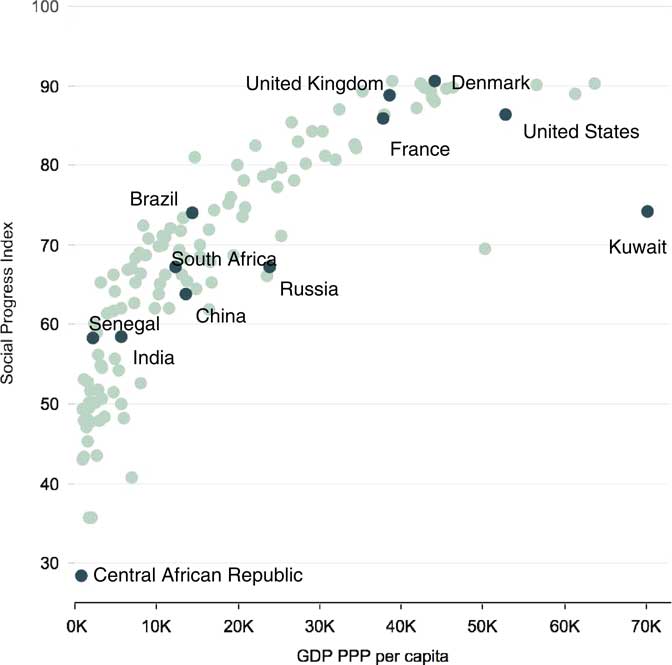
Figure 4 SPI versus GDP per capita. GDP, gross domestic product
So, the number one country in the world for social progress is Denmark. I know; 70% of you probably guessed Denmark. 99% of you guessed a Scandinavian country. I should say that Denmark is now the happiest country in the world. Social progress and happiness are conceptually distinct. The SPI is not a happiness measure. It is interesting that happy countries and social progress countries are similar, and Denmark is number one in both.
Sadly, at the bottom of the pile is the Central African Republic. You are smart people so you will notice that Denmark is, in fact, a lot richer than the Central African Republic.
The United States has quite a bit more GDP per capita than Denmark but significantly less social progress. Senegal has not that much more GDP per capita than the Central African Republic, but a lot more social progress. So, what is going on? The UK is kind of doing all right. We are not as high as Denmark, we are not as rich as Denmark, but we are certainly doing better than the United States on social progress – and, much more importantly, we beat the French!
Of the emerging economies, the number one BRIC is Brazil, then South Africa, then Russia, then China and then India. On the right-hand side of Figure 4, you will see a dot for a country that has a lot of GDP but not so much social progress. That is Kuwait. Then tucked above Brazil is a social progress superpower, which is Costa Rica.
Let us have a look at the stories of the relationship. The first key finding is that GDP is strongly associated with higher social progress. Getting more GDP is not a bad strategy for improving your social progress. Indeed, especially at the poorer end of the spectrum, each extra dollar of GDP per capita is buying a lot of extra social progress in its own right. That makes sense.
We have seen this with countries, whether it is China or India, in the last 15–20 years, how economic growth has driven an extraordinary reduction in poverty. And how, when countries have good governance, investing in the right issues, you can see huge leaps forward in social progress.
GDP is a key driver of social progress. But it is also not the whole story. At every level of GDP, there are opportunities for more social progress and risks of less.
If your country, if your society, has a development plan based entirely on GDP per capita, your plan is incomplete. You need to be thinking about how you are turning those resources into social progress.
In Figure 5, I have pulled out the countries and how they are performing relative to the GDP.
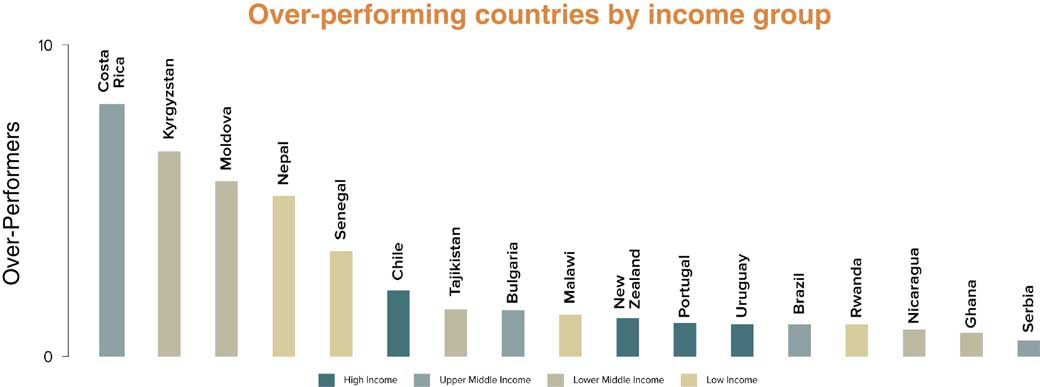
Figure 5 Overperforming countries by income group
Most rankings of the best-performing countries in the world have the Scandinavians at the top. But when we do a pound for pound assessment of who are the best countries of the world at turning their GDP into social progress, it is a rather different set of countries. Costa Rica is the champion. Then we have something interesting: Kyrgyzstan, Moldova, Nepal and Senegal.
Then we get to our first high-income country, Chile. Then, among the high-income countries are New Zealand, Portugal and Uruguay. They are also doing relatively well in social progress compared to GDP per capita.
The countries making the best use of their resources are not necessarily those in the top of the table.
At the other end, as we see in Figure 6, those that are underperforming, I think there is a pretty familiar group.
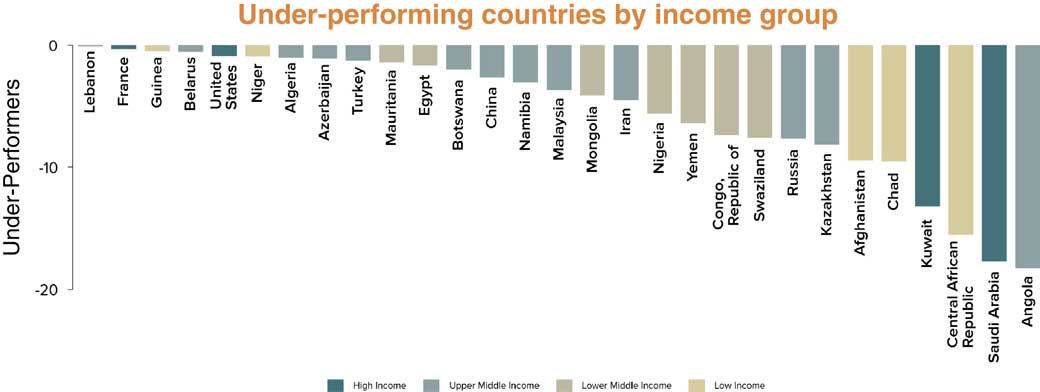
Figure 6 Under-performing countries by income group
They are countries that are based on resource extraction. Angola has the dubious distinction of doing an appalling job at turning its GDP per capita. It is a middle-income country but its social progress level is appalling. Saudi Arabia, the Central African Republic, Kuwait, Chad are a mixture of resource extraction and state dysfunction. Fragile states; failed states; among those least effective at turning their GDP into social progress.
We also see, as we go a bit further up, some other richer countries, including the United States, in this category. More on that in a moment.
This is a different way to look at how countries are performing. How good are you using your resources for delivering real well-being for your citizens?
What we can also do is crack open the score and say that for any country how are you performing across the different aspects of social progress, the different 12 components?
Figure 7 shows you a social progress scorecard, as we call it. Let us pick Denmark as our top performing country.

Figure 7 Social progress scorecard – Denmark
It is quite complicated but let me highlight a couple of things for you, the first of which is that Denmark is number one country in the world for social progress. It has a yellow light at the top. It is not doing significantly better than you would expect for a country whose GDP per capita compares to other countries of similar wealth. It is doing well, but not exceptionally.
One area where it is doing well is in shelter. This is one of the reasons why Denmark comes out top.
Compared to other countries like Sweden, Finland and others, it does seem to have done a lot better, especially around the issue of affordability of housing. That is a particular strength for Denmark.
It is also strong on access to information and communications. It is also showing a weakness, a weakness first of all in health and wellness. Denmark’s health performance is not as good as we would expect of a country of this wealth. It has issues about life expectancy and mortality rate of the over 60s.
What is driving that? We would have to dig into this. Is it too much bacon? Is it too much sitting on sofas watching Borgen? I do not know. But all we are flagging here is that there is a health issue in Denmark.
There is also an issue around the higher education system, which seems to be a little bit weaker than we would expect.
Even the number one country in the world we can see has lessons for other countries where it is doing well, but also areas where it needs to improve, even though it is the number one country.
Let us look at another country that is a little bit more colourful. The United States. You can see in Figure 8 the scorecard for the United States. Overall, it is a country that is underperforming on its social progress relative to its GDP per capita. Why?

Figure 8 Social progress scorecard – United States
There is a little warning around water and sanitation. There is a red light around safety, not just homicides and road traffic accidents. Access to information and communications. Here is the home of Silicon Valley and there are problems with people being connected to the Internet. Health and wellness: the country that spends the way the highest percentage of its GDP on its healthcare system achieves outcomes about the same as Turkey.
Environmental quality – perhaps less surprising. Personal freedom and choice and tolerance and inclusion. All of these are weak areas in the United States with a little bit of encouragement around having good access to higher education.
This is the picture that we see of the United States. Let me say very clearly that this is not Donald Trump. This is a picture that we have seen consistently since we produced the first SPI in 2014. This is a pre-existing condition. This is a product of decades of failure to invest in aspects of social progress for all Americans. It really is a long-running failure.
We did have for the United States a significant trend around the deterioration in scores on tolerance and inclusion since 2014. That is definitely an area where we have seen America going down. Rather than seeing it as a consequence of Trump, this may be more cause of Trump. This is showing the failure of the US social model and why people may have good reason to be angry.
That is the United States scorecard. We have them for every country that we measure. We measured 128 countries with complete data; another 60 countries with partial data from what we could obtain.
Let me talk a little bit now about SDGs. In Figure 9, you can see the SDGs, 17 of them.
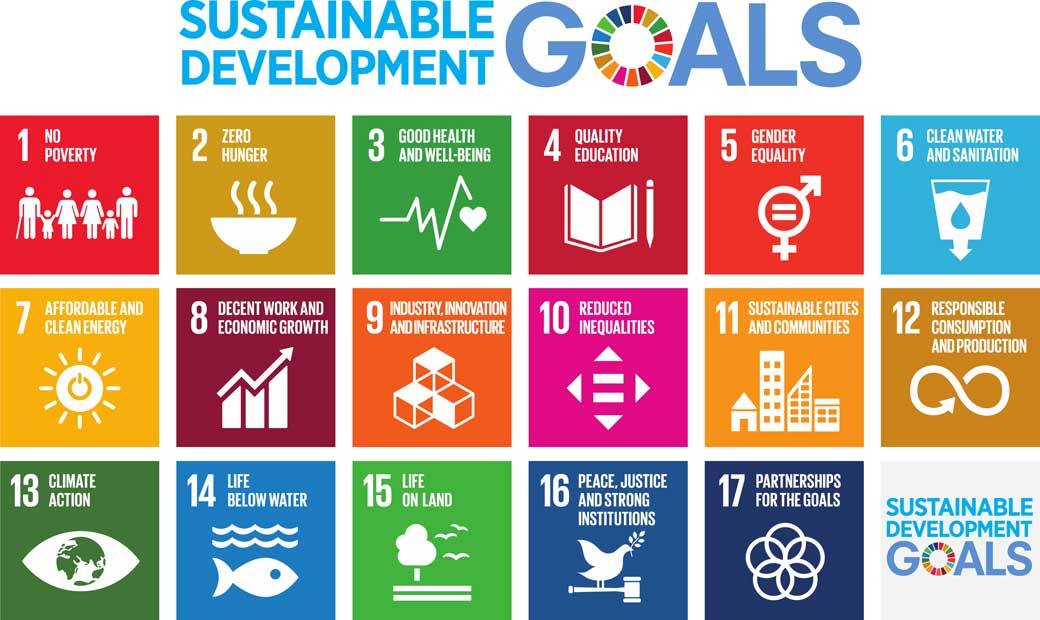
Figure 9 Sustainable development goals
If you want to run a public campaign that really inspires the citizens of the world choose a prime number higher than 10 for the number of goals. Give them a name that I can barely pronounce. The SDGs are an incredibly important thing. This is a critical promise that the leaders of the world have made to the citizens of the world. It is absolutely fundamental. But it also has some challenges.
One of the big challenges is the framework for measurement of these goals is not in place. I approximate slightly, but the last expert working group on indicators for SDGs said, basically, a third of the indicators exist. A third of the indicators exist for only some countries. And a third of the indicators exist for none of the countries.
This is a real measurement challenge for those SDGs that I do not think is going to get fixed very soon. There is also a problem which is what I call SDG à la carte. It is that people will start picking off one or two or three or four of these issues and say, “That is what I am doing for the SDGs,” rather than thinking about this as it was designed to be, as being an integrated package that is really about every country stepping up and improving.
What we are trying to do with the SPI is fix some of this measurement gap by offering a way of looking at the goals.
The SDGs do not look like the SPI. But fundamentally the underlying concepts are the same. You cannot build an index of SDGs if there is not really a conceptual model for building an index. That is very challenging. That is why the SPI, which is a composite index which has been built to be aggregated, works as a way of measuring the aggregate performance against SDGs.
Also, we could be more flexible about the indicators and data that we use so we can measure things that are currently unmeasurable. What we are trying to do now is support SDGs’ implementation by providing a practical measurement tool for the goals, for the whole package, that can be applied to countries, cities and regions, etc.
So, what do we know about the SDGs from the social progress perspective? Let me start with some good news. The good news is that the world is getting better. We are able to calculate the total world score for social progress, population weighted, of course. From our first index in 2014–2017 – the last index which came out (the 2018 index is coming out in September) we have seen real progress, from 63.19 to 64.85. 1.66 points of progress may not seem like a lot, but remember we are measuring outcomes, we are measuring the stock of human progress.
In a fairly short period, we have seen real improvement in the stock of human progress over time. That is a really important finding. So often our news is dominated by all the negative stories, the negative problems around the world, but in places we do not hear about, and on issues we do not hear about, progress is happening slowly and steadily. We see that in our data. There is a lot of improvement.
In some cases, it is countries like Nigeria which has had quite a big spurt in social progress coming from a low base. In other cases, it is countries like Spain or Norway making steady progress. There are, sadly, examples of countries that are going backwards, like Hungary.
The overall picture that we see is the world is making progress. The question is: is the world going to make progress fast enough to achieve the SDGs? Here is a way that we can think about it. In Figure 10, I have gone back to the scatter plot and inserted the world score.
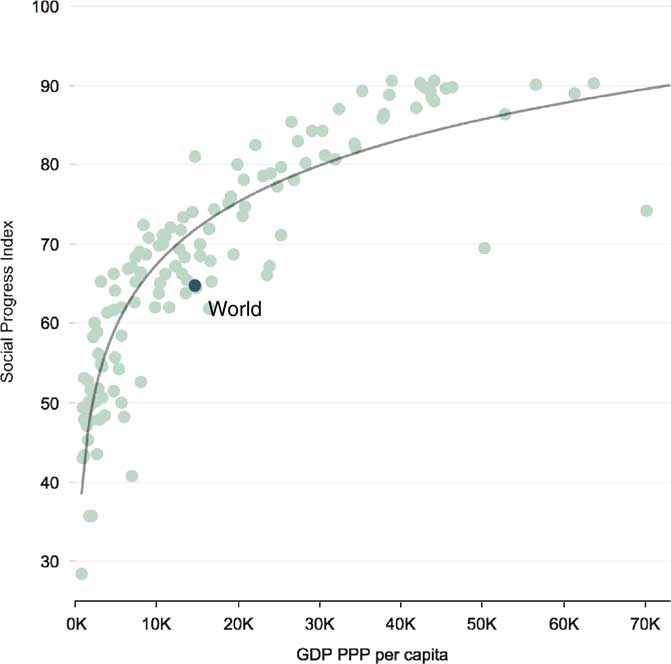
Figure 10 SPI versus GDP per capita including world score. GDP, gross domestic product
This highlights one of our problems which is that the world as a whole is not doing a particularly good job of turning world GDP into social progress.
How far have we got to go to get to SDGs? The SDGs are not about making the world perfect, they are making a significant step change in world progress in a relatively short period of time – little more than a decade.
Our estimate is that if the world could get to a score of 75 on social progress, then that would be achieving the SDGs.
Using the SPI, what we can say is we know something about the relationship between GDP per capita and social progress. What would happen if we make a forecast of our future economic growth for the countries of the world? What does that tell us about where social progress could get to?
To do this calculation we asked our friends at Deloitte. We did this when they launched the social development goals, and they produced a report. What they found was that the returns to economic growth are pretty low. There is very little improvement in the world social progress as a result of even quite optimistic economic growth scenarios.
Why? The problem is that we have so many countries that are sitting below the line, big countries that are not doing a good job in turning their GDP to social progress. If they stay on the current trajectory we are not going to get there.
We have other big countries which are around the line but even that is not good enough. We really have to get the world moving better, getting better and better at producing social progress from its GDP – being more like Costa Rica – if we are going to get anywhere near the social development goals.
We were all a little surprised in 2015 when it turned out that the world had achieved at least millennium development goal one, on the halving of poverty. There was much scepticism when that was launched. I think that there is a danger that we can assume that because economic growth got us to that goal, that economic growth will get us to the next set of goals.
Certainly, our forecast with Deloitte suggests that we cannot rely on economic growth alone on our current trajectory. We need a productivity revolution in how we are turning our GDP into social progress if we are going to come anywhere near achieving SDGs.
What we are trying to do with the SPI is to try and help in that process. What we call from index to action to impact. We are working in a whole range of places around the world where we are working with governments and, in some cases, businesses to use SPI data to come up with solutions, and make resources work more efficiently. I will give you a couple of examples now, one of which is the European Union.
The European Commission has spent a huge amount of money on what is called cohesion policy: the regional policy of the EU. If you have travelled around Europe, you will have seen the signs: “This road built by the European Commission”; “This bridge built by the European Commission.”
A lot of focus of European regional aid has very traditionally been on those kind of economic infrastructure investments. The European Commission has been interested in how they can humanise the story, how do they bring people, the human factors of development, into the story about EU cohesion aid? Together with the European Commission, we have built a SPI for the regions of the European Union. These are what are known as NUTS to the European Union.
This has now been integrated into the cohesion policy. This is going to be used around monitoring EU cohesion policy. There is an implementation tool. The hope is that this will help the regions of the EU to direct resources more effectively towards the real needs of the populations in order to accelerate and improve social progress.
It is a pressing need. The map in Figure 11 shows the broad picture of absolute performance on social progress across Europe.
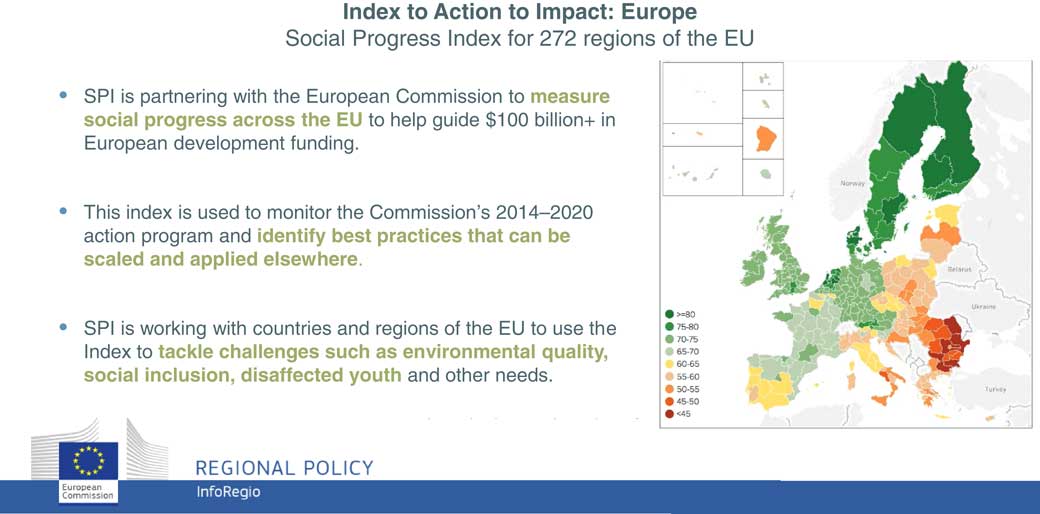
Figure 11 SPI for 272 regions of the EU
Yes, the Scandinavians are doing very well. Northern Europe is doing very well. It is interesting to see that parts of Eastern Europe, Poland, the Czech Republic are starting to catch up with Spain and Italy, even parts of France, and so it is a pattern that is showing an increasingly mixed story.
There are real opportunities here to focus and accelerate development for these regions. But it is not just about the most deprived regions of Europe. Because we have built this for the regions of European Union we have scorecards for each of these regions.
I want to show you now, in Figure 12, since we are in London, a scorecard for inner London.
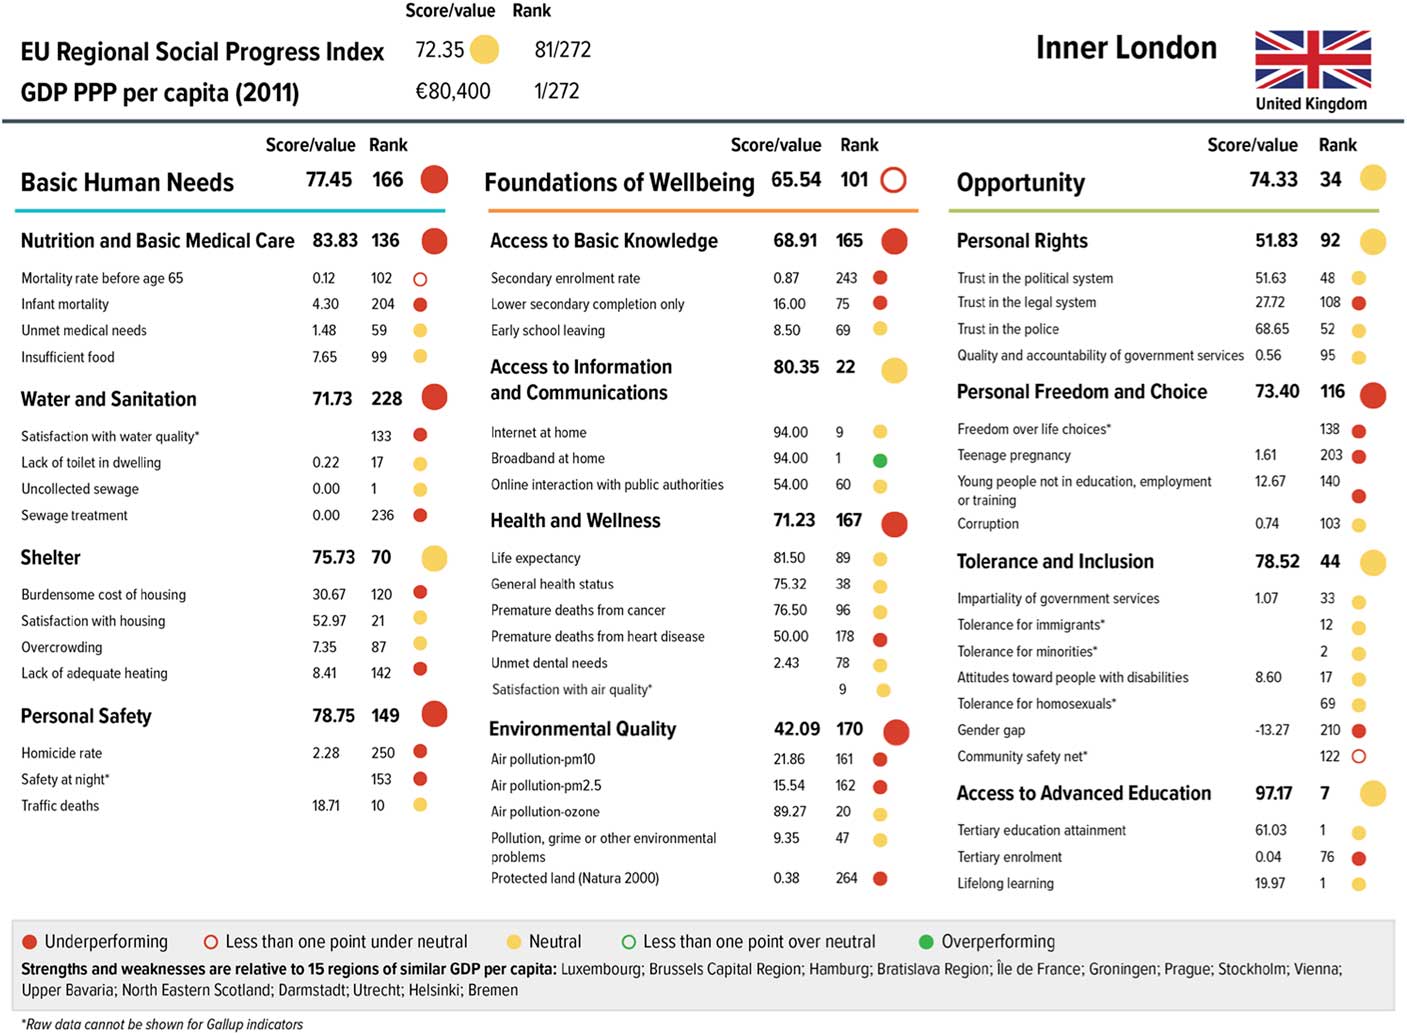
Figure 12 Social progress scorecard for inner London
Quite frankly, as a proud Londoner, I am ashamed. We are living in the richest region of the European Union and quite frankly our scorecard describes a huge amount of failure. The red traffic lights are comparing our performance to other rich regions of the EU. We are not comparing just the Central African Republic. We are saying compared to other rich regions of the EU, how is inner London doing?
The story is: Nutrition and basic medical care, not good enough; water and sanitation, not good enough; safety, not good enough; basic education, not good enough; health and wellness, not good enough environmental quality, not good enough; personal freedom and choice, not good enough.
I think that it is absolutely shameful that we are doing so badly.
Our hope is that London, and other regions round the UK, take these data to identify problems, to build collaborations around finding solutions and, critically, maybe learn from other regions that have scorecards that are showing more positives. Where can we learn about tackling some of the problems of health and wellness? Where can we learn about tackling some of the problems around education? The SPI can help us identify problems but also identify solutions so we can share those solutions and make better use of our resources to achieve better lives for our population.
That is the European SPI. Figure 13 shows you another, which is one we did last year, which was with the government of India.
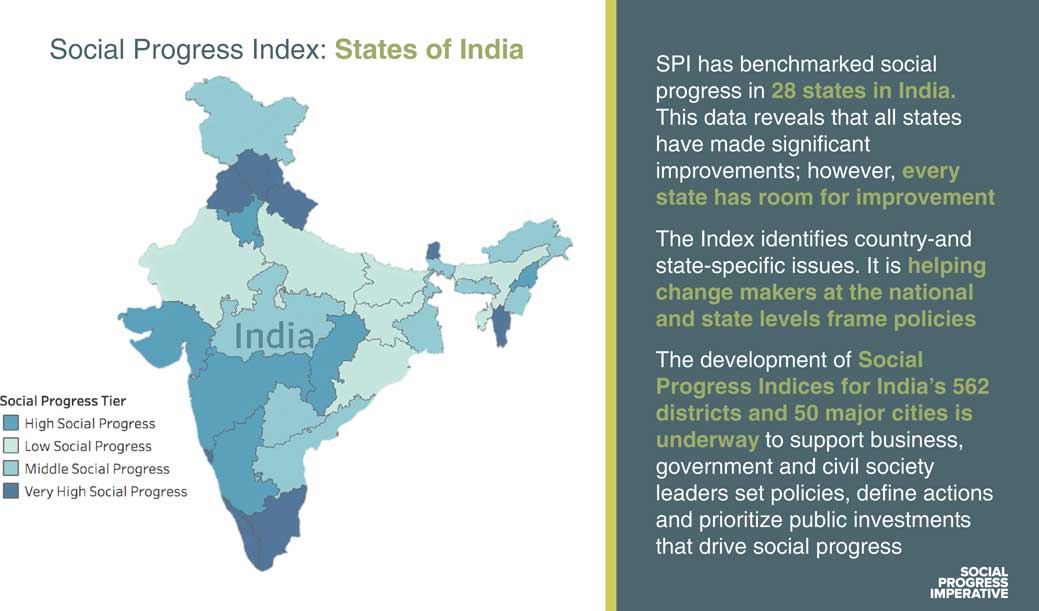
Figure 13 SPI: states of India
India has now built a SPI for the states of India. Next month we will be releasing a SPI that is for districts of India. It is very much part of Prime Minister Modi’s transformation agenda for India.
One of the things that we see, given transparency about the performance of states and districts and who is doing well and who is not, is where lessons can be learned. Also, critically, it is a way of tracking India’s progress against SDG s. These data, on which we have worked with the Indian government, are now out there and being used by the federal government but also by state and, soon, district governments to really try to improve how resources are used.
Also in India, there is a critical use of these data, which is around corporate social responsibility. As many of you know, there is a law that requires 2% of corporate profits to be used for socially responsible investment, or corporate philanthropy. These data can help people target the biggest needs.
Sadly, too often the philanthropic sector is one that is immune to data or is not guided enough about what are the real issues. That is the real power of the SPI, to take all these different issues, whether it is education, health or the environment or rights, and put them into one consistent framework so that we can see where the problems are, where the priorities are, and also create a dialogue between government, business and civil society around the biggest problems and how can they most effectively can be addressed.
So India is the next one. We have a range of other initiatives. We are launching in the United States at the moment. We have just built a 50-state index for the United States; we are building US cities as well; and also expanding into Africa later this year as well.
The thing that has really picked up about the SPI is it is very easy for governments to adopt because it is not a replacement for GDP, it is a complement for GDP. It works alongside traditional economic measurement. We are not asking anyone to stop doing anything. We are saying carry on measuring your economic performance, carry on measuring your economic competitiveness, but if you measure social progress alongside, then you may make some smarter decisions. We are seeing that is getting enormous traction around the world, both with governments and also with some corporations.
What does this all mean for actuaries? I think that it is very clear what it means for actuaries. I think that it is captured very well in this quotation: “The financial services industry has a vital role to play in meeting the sustainable development goals. Whilst policymakers often focus on the roughly £150 billion worth of official development assistance, there needs to be increased focus on the £300 trillion of capital in the global markets. If this £300 trillion is harnessed to support, rather than undermine, sustainable development globally it could be transformative in achieving the goals.” Amen!
Who said this wonderful thing? Of course you all know, it was the Institute and Faculty of Actuaries. Yes, I absolutely agree with you. This is the big prize. It is not just about governments delivering on their programmes, it is how do we take these resources? How do we, taking Lord Turner’s memorable phrase, make our capitalism more socially useful? How do we make our pounds and dollars in the global capital markets deliver more good? How do we make our economic growth deliver more social progress?
Our hope is that our SPI data can help do that, help us understand which forms of capitalism, which institutional structures, are more or less socially useful.
We recently did a project in Costa Rica where we were looking at tourism sites and looking at which forms of tourism have a more positive impact on social progress for communities. This is now helping Costa Rica develop a tourism strategy so it can focus on encouraging more socially useful tourism and less of the less socially useful.
It can really help guide us in thinking about how we use our capital to get more social progress bang for our buck.
I think that there is something much more fundamental here. This is about how do we make our £300 trillion get more social progress. There is another question which is what role does social progress play in driving our future prosperity?
Lord Turner mentioned about how the profession of actuaries is about the long-term and the short-term. A huge problem with our global economic system is the way that we prioritise short-term at the expense of the long-term. This is what we see in some of our social progress data, the way that we can see countries like Tunisia before the Arab Spring being superstars in economic metrics but being societies really in a state of collapse.
So can the SPI data tell us about risk and opportunity in the global economy by giving us a different perspective on how countries are performing, how regions are performing, how cities are performing? The mood seems to have changed globally on an issue like gender equality. It is such a no-brainer that in poorer countries, you get girls into school.
There are massive social economic spin-off benefits. We are seeing here how if you start getting gender equality on boards and pay it is going to have massive positive spin-offs because you are utilising the resources of our whole population. If this is true that if we are living in societies that have got more social progress and are more equitable, then there should be a feedback loop back into our economic growth. If we can stand that up, if we can prove that, it starts to make the SPI data material financial information.
I think it was James Carville, one of Bill Clinton’s advisers, who was asked if you were reincarnated, what would you want to be, and he said, “I want to come back as a bond market.” Well, we all want to be a bond market. If we could create positive incentives towards social progress, towards human development, to achieving the SDGs through the power of the bond market, through the power of the equity market, then we would have an enormous transformation of our global system.
Who can do that? Not me. I just run a non-profit organisation producing data. Who could do it? The people who help make the decisions, who drive the metrics which are the driving force of our financial markets. It is down to people like you. Thank you.
The President-Elect: Well, right, how are we going to follow that? Okay, we are in Q&A mode. Any questions from the floor?
Mr M. G. White, F.I.A.: I am sure it is going to vary hugely between different types of company, but what key principles would you challenge companies to adopt in relation to their employees?
Mr Green: I do not know. I would love to find out. We have done a little bit of work in Central America looking at some coffee producers, looking at the structure of companies and how that relates to social progress with their employees. We would love to do more of that, thinking about whether there are particular organisational forms or particular policies that companies employ, are there particular wage regimes, etc? What are the ways to drive social progress? There is a whole vista of research that can be done building on this data and using this data. We are just at the beginning of a journey.
I should say that my organisation, the Social Progress Imperative, is 10 people split between London and Washington, DC. What we do is work through a network of partners in business schools and institutes throughout the world who are the people who are then building on this work and applying it. We need to do more. We are at the beginning of this journey. I would love to have an answer to your question, but we are not there yet.
Mr I. McKeever, F.I.A.: I was feeling that I disagreed with a lot of what you said in the beginning, and then in the end you made the point that I was thinking of most, that we tend to think of social progress as a product of what we buy with our economic production. It all feeds back on itself because if you look at an issue like education in Asia compared to here, we seem to think we are educated because we are rich. In Asia, the attitude tends to be that we need to be educated in order to become rich.
You covered India. These social indicators interact. One of the facts that stayed in my mind for years is that Kerala, in India, is not one of the richest states. It is in fact one of the poorest states. But it has one of the longest life expectancies in India. The thing about Kerala is that it educates its women. It treats its women completely differently from the rest of India. That seems to be the thing that gives them their extra-long life expectancy because the mothers are educated and the mothers teach the children.
So I would like to hear more about the benefits of these things that you are measuring in terms of the way they feed back into other social benefits.
Where do the poorer states differ? What particular aspects of these social benefits do these poorer states score well in, and how do these facts interact with each other, education versus health care, etc?
Mr Green: This is again something we are trying to understand. One example I have looked at in some detail is Costa Rica. But if we look at the story of Costa Rica’s success it is a couple of factors. One is the fact that it was never colonised in the same way. There were not the big land estates. Very early on, it was a country of small farmers, and that meant it had quite a strong civic culture. It meant that there were quite strong democratic institutions, and also because it was quite a civic culture it very early on introduced universal primary education.
It was very early in bringing a higher education institution for women at the end of the 19th century, which then fed through to a generation of women leaders in Costa Rica who then drove the reforms which it is famous for, things like getting rid of the army, and building a welfare state.
These are the stories that we try to understand about what is driving these patterns. It is an analysis that we really want to do.
Where we are constrained in doing this analysis is around like time series data. Our global index goes back to 2014. We cannot take the existing dataset backwards. The indicators just do not exist.
One project on which we are working at the moment is how do we build a longitudinal SPI that goes back 20–30 years covering a couple of economic cycles and see what we can learn about those interactions over time?
We would have to build a new, different, set of indicators measuring the same concepts. If we give a decent sample of countries or regions going back over time, then we can start understanding more about the mechanism.
It is very much a work in progress. If we can generate those insights, that would help drive improvements.
I think the things that are good for the economy are not just the things that we tend to think of in terms of infrastructure and education.
Deloitte did a report for us looking at foreign direct investment flows and social progress. For richer countries, they found a significant relationship between scores on tolerance and foreign direct investment which makes sense. If you are competing in the global market, trying to attract global capital, trying to attract the best global talent, it is a positive thing to be a tolerant place, and a negative thing not to be tolerant. And so how do even those more ephemeral factors of social progress factor in to actual material economic things is something we want to understand more.
The President-Elect: I should like to encourage everybody who is on the live stream to please send your questions through.
Mr D. C. E. Wilson, F.I.A.: Just building a little bit on the last question and answer, I was wondering whether there was anything that you could do from a cross-sectional analysis about the underlying factors that lead to underperformance or outperformance.
I appreciate that some of the countries will have different constraints, different geographic conditions, that put them potentially above or below the line, but we had a very interesting discussion here last week with the Foundation for Sustainability and Democracy, for example. They were asking questions about what can we do, principally to our democratic institutions, in ways that will encourage us to make decisions that are good for the long-term, and presumably would improve your SPI as well. Any thoughts around that?
Mr Green: We have done a little bit of analysis about some of the drivers. One of the striking findings we obtained from the EU regional dataset was that we found no relationship between the headline unemployment rate and social progress level. I think what that is telling us is that the headline unemployment rate is becoming a less and less useful measure of the inclusiveness of our economy. One is problems about how we measure unemployment. There is a shift to the gig economy, and all those other factors.
We are starting to do some of this analysis about what those underlying factors are, but we would love to do more of that.
We are interested in things like hypotheses, but also collaboration. There are business people who are fantastically good at this kind of analysis, and we would love to find people with whom we could work who can help us do this kind of analysis of datasets.
Ms C. Howarth: Thank you very much for that excellent lecture, Michael. I just wanted to get your further thoughts on the inner London data that you showed us, especially in light of the fact that, thanks to pensions and automatic enrolment, a very large number of Londoners on their wages are now pension savers.
That raises a quite interesting question about what their fiduciaries are undertaking to act in their best interests. There is a DWP consultation going on in investment regulations to have a look at maybe opening that up and redefining somewhat the fiduciary duties of trustees of pension schemes to think a little bit more broadly about this question of how do you drive the social progress of your beneficiaries, and what feedback loops might there be in terms of investment strategy.
I would be interested in your thoughts on that, which is quite an involved question.
Mr Green: Thank you. One thing I should have said is, even at the level of inner London, it is a pretty high level of aggregation. The story that dominated the news and horrified us all last year was the Grenfell Tower incident, and the fact that in the most prosperous borough there are pockets of deprivation.
One thing we are doing now is starting to drill down to as local a level as possible to try to understand that pattern of social progress. Even the level of inner London, or in a borough, there can be huge variations for different communities. One of our pilots in London is Barking and Dagenham which have taken great ownership of using this SPI for tracking their borough plan. They are going to be releasing a SPI at the ward level later this year.
We hope with that level of granularity you have then got actionable data to help not just the council to think about how it spends money, but exactly, as you say, thinking about how we can target other resources.
The example you give is fantastic about how we can think about the responsibility. What does fiduciary duty mean, and how can that be applied to the beneficiaries of a fund, especially if we know what the issues and what the challenges are. I think that is a fantastic example. We would love to see more of that as well.
Mr M. Elshemmy: My question is related to the SPI. How is that different from the index of multiple deprivation (IMD)? Are we going to see the SPI replacing the IMD?
Mr Green: IMD is specifically a deprivation index, so it is measuring for poverty and deprivation, whereas we are trying more broadly to measure social progress, so it is definitely not trying to replace that. There is IMD in the UK; there are things like the multi-dimensional poverty index globally that have tried to do a specific thing about measuring poverty and deprivation. They absolutely have a role to play. They are great products and they are very much complementary to one another.
I think what the SPI can do is to get a different lens, not just on poverty, but on some of the wider social progress of a society, but that is not to detract from or distract from measures of deprivation and poverty.
Dr L. M. Pryor, F.I.A.: Are you worried about the dangers of success? That if too many people start using this index, it will become unreliable as a measure because everybody knows that as soon as things are used for targets, things can go horribly wrong.
Mr Green: Absolutely. One thing is trying to make sure we are open about the methodology, which is why it is fully transparent in terms of the methodology and the data, so we can have feedback. It is open for scrutiny, and to see how it can be improved and revised over time. I think that is the best way that we can guard against that risk.
If you pick on one measure that can take you off in another direction. So being clear and open about the methodology, and checking how we progress over time is helpful – we are not there yet.
Mr J. Parmar, F.I.A.: I found the graph showing the relationship between the SPI and GDP fascinating. I wonder whether you have done any work to look at the effects of skewness of income. When we look at GDP, if you were looking at GDP per capita in some sort of medium context rather than the mean, I would suspect that countries like the United States and Kuwait would effectively be shifted further across to the left, and that sort of outlier effect would dissipate to some extent.
Mr Green: That is a great question. It is one we would love to do. The problem is often finding the data. We did do some analysis when we looked at the global results against the Gini coefficient as a measure of income and equality. We found no relationship at all. I think what we found was that the global Gini coefficient data are poor. I think that is the right finding I take from that analysis. There is definitely a problem.
Similarly, the World Bank is producing a measure called B40 which is the income share of the bottom 40, which has been useful when we have got it for some countries. It shows a closer relationship with social progress than GDP per capita. We do not have a global median household income measure so we are constrained by the data that we can get. But these are kind of things again we want to put against our data and start seeing what is the explanation here? What is driving this?
I used to work in government. Government is hard. I worked with brilliant people, both ministers and officials, but it is hard. Very often decision-makers are grasping for heuristics or the thing that sounds right.
The more we can inform about what really does work, that is driven by data, then we can really help the debate and move things on. Those are the kinds of questions we would love to do more to interrogate. But we are always constrained by the availability of data.
Dr D. J. Clarke, F.I.A.: I have two questions. First, this is a question that you will have heard before, I am sure, to do with weighting and value judgements. The World Bank got in trouble with this recently with their business index that led to the resignation or demotion of their chief economist.
Have you looked at how the SPI is related to the ability of people to live a life that they value? Presumably, there is a relationship between this index and people’s political affiliation, between liberal and conservative. Quite a lot of people these days are willing to sacrifice, shall we say, have a 28-inch television rather than a 32-inch television and have a bit of tolerance thrown in for that. So is there a relationship in terms of people’s preferences? You showed the relationship with GDP but have you looked at the indices of happiness and well-being?
The second question is your causality story in terms of this versus GDP and GDP versus social progress. Do you have any evidence of countries being hit by shocks to GDP that are exogenous, and that leading to changes or exogenous shocks to social progress that lead to changes in GDP at all over the long-term?
Mr Green: Thank you. I will reply to your second point first. The answer is no. We have not got a time series. That would be exactly it. Find a perturbation and see what happens. If we had that time series, we could start playing with some of those things.
On the other question, happiness, we have looked at the relationship between happiness, life satisfaction and social progress. The more recent work on this is by Justin Wolfers and Betsey Stevenson. Basically, there is not a tail off in happiness relative to rising GDP per capita. It flattens out but it does carry on.
We have looked at this and what we have found is that there is a close relationship between life satisfaction and social progress. Most of it is explained by GDP per capita, but not all of it. It is that third dimension of opportunity which seems to have an independent significant effect on life satisfaction. That is interesting. We find that there are some countries, especially the Arab Spring countries, which seem to have had a social progress scorecard that is strong on the basic human needs and not so good on the opportunity.
Therefore if that is a sign of our people satisfaction with life, could that be significant in some ways?
Coming out next month, Michael Porter, together with one of our other advisory board members, Scott Stern, is a paper about social progress and life satisfaction. That is coming out in the American Economic Review, I think it is. That is an area at which we are looking.
In terms of the weighting of choices, we have gone for equal weighting. It is simple and there is nothing that is clearly better than that. The really interesting thing would be to do some work on polling people around the weighting of the indices. There was a paper recently by Eric Brynjolfsson at the Massachusetts Institute of Technology (MIT) about using online games to measure consumer surplus. You could apply the same methodology I think to try to figure out weight. We would love to do that but that is a big project. It will be a fascinating thing to do to start teasing that out.
Mr N. S. Spencer, F.I.A.: I am interested in the impact of boundaries on social progress, in particular the potential influence of planetary and environmental constraints. You have a reference to environmental quality. I was wondering whether this reference allows for resource utilisation and progress to a more circular economy?
Mr Green: The simple answer is no. We would never pretend that this is a measure of sustainability. That is a hard question. It is for someone else to answer. What we are surprised about is how hard it is to answer.
If I may share a bit of pain: we would love to have some measure about greenhouse gas consumption or production. To get that per country, it does not exist. We cannot get that data. To have some robust measure about boundaries that we can agree on does not exist. This is why we very clearly say that that component of the index is about environmental quality in the sense that the impact of the environment on people’s lives and lived experience.
We would never pretend that we are a sustainability index. That is going to have to be somewhere else. If, however, you or anyone else has a wonderful, elegant solution, I am sure that there are solutions out there that we have not thought of, we would welcome ideas. We would like to be able to try to get a sense of boundaries, environmental boundaries, into the index in a more robust way. We just have not found it yet. The idea is very welcome.
Question from a member of the audience: Would you agree that quantitative easing and asset price inflation will have a negative effect on your index?
Mr Green: You will have to help me out here. What is the mechanism?
The member of the audience: The mechanism is most people would be spending far too much on house prices so their social ability would be decreased.
Mr Green: Again, we would probably need some time series to look at house prices and the relative price of assets against income. What is happening to those asset prices? How does that have an explanatory story in the relationship between income and social progress? An interesting question. I do not know; I would love to find out.
Mr M. G. R. Stickland, F.I.A.: I was wondering whether you had any view on the concept of looking at gross national happiness, whether it is effective and whether any countries do it well or not so well.
Mr Green: Gross National Happiness is the Bhutan model, which although it is called Gross National Happiness, is a dashboard that includes economic, social, cultural and life satisfaction measures as well. It is a different approach. What it has is it spans all these different aspects. Other countries have been working and experimenting with it. It is a different approach.
There is another approach which is just measuring happiness directly using that as your metric. We have very clearly chosen why we are just measuring social progress independently. We will see. I think that we have to find out which tools are most effective to help decision-makers solve the problems that they face. Wherever you go round the world, this whole question about the limits of GDP, the need to find the other paths, everyone gets it. What decision-makers are struggling with is what to do about it, how to manage it. What we are trying to do is to offer something that is practical and useful to help them.
I think that it is great that there is a range of different tools available to people to figure out which of the tools work.
The President-Elect: Let us go to Twitter. We do have a question talking about across boundaries and across national boundaries in some respects. The question is: is there a measure on how countries do in efforts to improve the sustainability or the social progress in other countries? Can richer countries impact the social progress on poorer countries? Does that equally reflect on their own index score?
Mr Green: I travel around and people say “I really enjoyed your TED talks.” I say “Thank you very much.” Then it turns out that they enjoyed someone else’s TED talks! There is a fantastic TED talk by Simon Anholt. It is called the Good Country Index.
He is doing a great job in answering exactly that question: which countries contribute most to the rest of the world? It is a separate one and it is a great product. The TED talk is excellent; the index is a great product, too.
The President-Elect: So we need to get him next year, I guess! The other question is you were talking about a productivity revolution. Are we set up really with the proliferation of data, technology and what all of that brings almost naturally to improve the index? What are your views?
Mr Green: I really hope so. I do think that we in the next couple of years are going to change completely the way that we measure social progress. At the moment, we are relying on a lot of official statistics and traditional measurement tools. There is a huge amount of data out there that is measuring the same concepts in much more granular ways in much more real time. Whether that are satellite data, social media data, data that companies are collecting, data that are probably sitting out there in an unstructured fashion that we need the power of machine learning to stick together and measure.
If we can do that and measure social progress in real-time, to be able to see what it is like for men and women, for young people, for older people, then I think the chance to put really powerful tools into people’s hands to make better decisions is incredible. I think we should try to create the space for that, but also really keen to talk to technology partners about how we can create that revolution. I think we are going to be able to measure social progress in ways that were unimaginable to Kuznets, and I think we can go beyond there and that is where there are huge prospects that with the right data we could make better decisions.
One thing I would emphasise is also to address the things for which we do not have good data. We think we have enough data to produce a robust index, but there are so many areas in which the data are not good enough.
I would pick up one which I know is of particular interest to this community: around ageing populations. There is no decent measure we can find around ageing – not whether ageing is happening, but what its impact is that is necessarily happening. We know ageing is happening, that is entropy. But the question is what is the quality of life for people as we get an older population?
This is asking different questions. We focus so much of the global public health effort on mortality, quite rightly so, saving lives; but we face a whole new set of public policy questions about how do we respond to a growing burden of morbidity? What is a good life to be living with disability or fragility? That is something for which we find no useful data at the moment.
Considering the speed with which this ageing issue is coming upon us, I think that it is quite shocking. So we are very keen to think through this issue and find data partners to measure those kinds of issues as well.
The President-Elect: Any more questions from the room? I have one more question on Twitter, so I will give you a bit of time to think.
Again, talking about the data gaps and what have you, is there a way of supplementing the data you have from a SPI perspective almost to be able to measure the SDG progress a little bit more completely?
Mr Green: I think we would say that what we have with the SPI is a pretty decent measure of the spirit of the SDG. We can capture what the SDGs are trying to achieve. It is never there to replace the officials reported mechanisms. That is its own process.
What we can do is we can take that and we can apply not just the country but to the level below that, to cities and districts and even different communities. What we can do is we can even say if achieving the SDG is 100, if we can calibrate the social progress score against that, we can say how far you are along the line, how you compare to others. We can disaggregate how you do it, and make it a very integrated, practical tool for SDG implementation. That is how we see our role supporting that initiative. That is where we are getting interest from countries and cities who want to use SPI for exactly that SDG measurement purpose.
The President-Elect: The first and the last question, Martin.
Mr White: The word “progress” has a major feel of change about it. A lot of the measures have a look of a static feel. Is the progress that you are talking about the overall change in society from cohort to cohort or is it a progress during individuals’ lives or is it something different?
Mr Green: If you want to measure outcomes, we do have this fact that outcomes do not change that quickly. Life expectancy, as you will know, is not going to jump suddenly about from year to year. Social progress will change slowly over time. We are trying to measure for the aggregate stock of progress for a society. That is the sense in which we mean it, and then see how that moves over time. What we also want to do is get somewhere thinking about being able to understand the direction of travel, and to be better at prediction. That is going to be important, especially for decision-making purposes.
The President-Elect: I thought that would be the last question but in an era of data and connectivity, we will take a last question from Twitter. This question is about the example that you gave about India. Policymakers using the SPI as a tool to inform their decisions. Are policymakers in the UK listening? Are they using the tools and to what effect?
Mr Green: We have started work with the European Commission. There may be something that may impact the UK’s engagement in that that I will not mention. We are now working to develop something in England first. We are planning work on building a SPI, probably at local authority level, to give a level of granularity, to make something actionable. We really want to build something up which will be really useful to local government. That is the next phase to our work in the UK, and we are very keen to work in other places. Scotland has had very strong leadership around well-being. Certainly in the EU SPI, Scotland has the highest social progress of the four nations that make up the UK. I know that Wales has a strong image around sustainability.
So we have some projects underway across the UK in different ways. But not yet dealing in detail with national government. In a way I think partly because national government in the UK has been quite focused on life satisfaction measures. That has been more the focus of the Office of National Statistics in recent years. But who knows, I am sure we will cover social progress systems sometime soon.
The President-Elect: Excellent. In the spirit of what you just said there Michael, we really appreciate the time that you have taken to come to talk to us about the SPI and the work you do. We are numbers people, fundamentally, and the fact that we can apply numbers to the things which we might have considered softer of less measurable in the past is, I guess, a great opportunity for the profession.
So thank you again Michael.


 Open access