


Introduction
Research on mounded tomb groups tends to focus on the mounds themselves, due to the fact that the expansive and relatively inaccessible (hilly, vegetated and built-up) surrounding landscape hampers extensive mapping by traditional means, thus limiting a holistic understanding of the relationship between the built and natural landscape. Constructed across a wide area and over varied terrain, the Tsukuriyama tomb group in Okayama Prefecture, Japan, provides an opportunity to employ innovative research methods in an effort to overcome these issues. As part of our case study, we conducted airborne LiDAR surveying to clarify the integrated relationship between the tombs and their environs. The Tsukuriyama tomb group was selected because previous digital surveys and trench excavations provide data for comparison, and its tombs, including the largest freely accessible mounded tomb in Japan, are open to direct investigation, allowing on-site confirmation of LiDAR point cloud data to verify accuracy.
The Kofun period (mid third to early seventh century AD)—Japan's period of ancient state formation—was characterised by the construction of countless mounded tombs (kofun) throughout the Japanese archipelago. These tombs represented the status of regional elites buried within them, and their construction was situated within a relationship with the political centre of the Kinki region (mainly Osaka and Nara, and home to the Mozu-Furuichi Kofun Group (UNESCO World Heritage Site))—a relationship centred on shared ritual and the distribution of prestige goods from the centre to subservient regional elites. These tombs therefore have the potential to reveal a great deal about ancient society and politics.
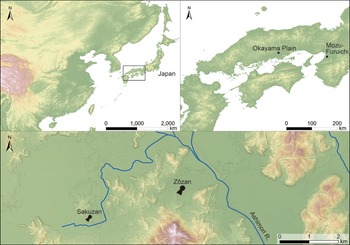
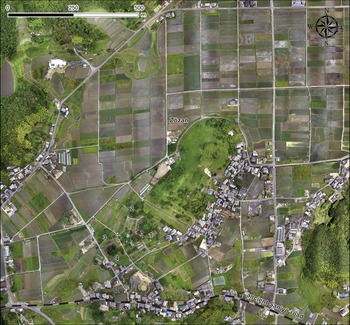
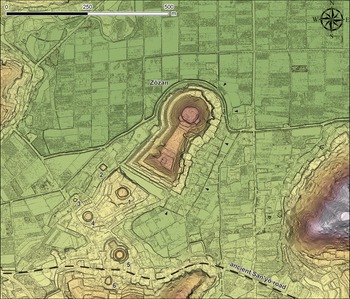
The principal Tsukuriyama tomb (commonly referred to as ‘Zōzan’ to avoid confusion with another tomb in Okayama of the same name) measures approximately 350m in length, making it not only the fourth largest tomb in Japan, but also the largest tomb outside of the Kinki region (Figure 1). It is accompanied by six smaller subsidiary mounds (Figure 2). Artefactual evidence dates the construction of the tombs to the first half of the fifth century AD.

Figure 1. Location of the Zōzan tomb group (figure by the authors using ArcGIS Pro).

Figure 2. Orthophoto of the Zōzan tomb group. Numbers indicate subsidiary tombs (figure by the authors using Metashape Professional).
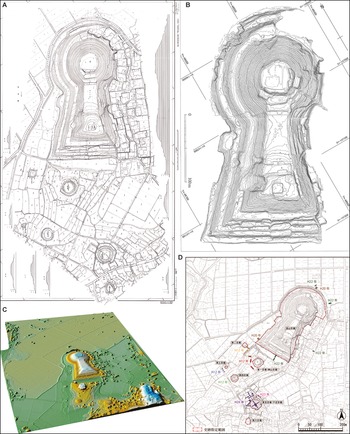
Full-scale mapping of the Zōzan tomb group began with an aerial photographic survey, which was commissioned in 1985 by Okayama Prefecture and Okayama City (Figure 3A; Okayama-ken-shi Hensan-iinkai Reference Hensan-iinkai1986). In order to attain more accurate mound surface data, Okayama University conducted a digital survey of all seven tombs between 2005 and 2009 using a total station (Figure 3B; Niiro Reference Niiro2008, Reference Niiro2012); a fully manual survey was also conducted using a plane table in order to compare methodologies. The digital mound data were subsequently combined with a digital elevation model, produced from aerial photographs in order to situate the tombs within the wider landscape (Figure 3C; Teramura Reference Teramura2008). In 2014, an additional survey was conducted by Okayama City using aerial photography and supplementary digital survey (Figure 3D; Okayama-shi Kyōiku-iinkai Reference Kyōiku-iinkai2014).

Figure 3. Previous survey maps of Zōzan and its surroundings: A) after Okayama-ken-shi hensan-iinkai Reference Hensan-iinkai1986: supplementary fig. 1; B) after Niiro Reference Niiro2008: fig. 2; C) after Teramura Reference Teramura2008: fig. 9; D) after Okayama-shi Kyōiku-iinkai Reference Kyōiku-iinkai2014: fig. 16.
While these have produced fine-grained data for each individual mound, the surrounding area and its varied terrain and ground cover have hampered direct survey of the tomb group environs and engendered a reliance on models using aerial photography. In addition, as the focus of these previous studies has been primarily on the mounds themselves, the relationship between the tombs and surrounding structures not directly part of the mound proper, as well as the surrounding topography, has not been sufficiently addressed. We aim to address these issues by conducting drone-based LiDAR surveying across an area of approximately 1km2 that integrates not only the mounded tombs but also the surrounding residential, hilly, cultivated and forested areas. In 2020–2021, ground surface data were compiled from 11 flights using a Phoenix LiDAR Systems miniRANGER mounted to a DJI Matrice 600 Pro (Figure 4). Point cloud acquisition was carried out in Phoenix Spatial Explorer and post-processing was done in NovAtel Inertial Explorer. The point cloud was then filtered in TerraScan. The resulting digital terrain model was composed of 28 120 002 points, with approximately 20 points per m2. The thick vegetation that characterises Japanese summers can interfere with ground-surface data acquisition; this was compensated for by decreasing drone speed where necessary and surveying troublesome areas multiple times from different directions.

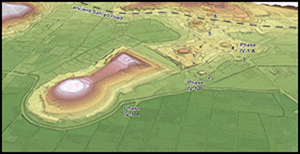
Figure 4. LiDAR map of the Zōzan tomb group and its surroundings. Black arrows indicate possible remains of the moat in the modern landscape (figure by the authors using ArcGIS Pro).
Tomb construction and land development
Partial excavation has clarified that the construction of Zōzan, in particular, involved the cutting away and working of the natural hill extending from the south (Niiro Reference Niiro2012; Nishida Reference Nishida2020), most clearly seen in the wide channel separating it from the southern hilly terrain. The LiDAR data, however, suggest that construction of the entire tomb group was intimately tied to large-scale land development in the form of cutting away, levelling and working of the natural hill to make flat, open spaces for mounded tombs and also to make Zōzan an independent entity.
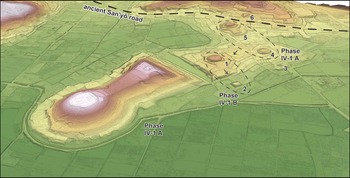
The location of the subsidiary tombs follows the contour of the hill as it descends onto the plain (Figure 5). Typo-chronological research on the earthenware figures (haniwa) recovered from the subsidiary tombs reveals that Tombs 4 and 5 were built concurrently with Zōzan (Phase IV-1 A), while Tombs 1 and 2 were built subsequently (Phase IV-1 B). Moreover, within this latter phase, the higher-elevated Tomb 1 preceded the lower Tomb 2 (Yasukawa Reference Yasukawa and Seike2019). While haniwa have not been found from Tombs 3 and 6, it is apparent that mounded-tomb construction was synchronous with systematic development of the hill from higher to lower elevations.

Figure 5. Bird's-eye view of the tomb group. Arrows denote order of construction. Typo-chronological phases of excavated haniwa after Yasukawa Reference Yasukawa and Seike2019 (figure by the authors using ArcGIS Pro).
The ancient San'yō road, built as a national infrastructure project in the late seventh century, runs east–west between Tombs 5 and 6. Although the mounds were built well before this iteration of the road, the fact that the three largest tombs in this region—Zōzan, Sakuzan and Ryōgūzan, all of which date to the fifth century—are all located along this route suggests the probable presence of a preceding thoroughfare. Indeed, the road's spatial integration with the Zōzan tomb group and the large-scale development of the hill as a result of its construction suggests that the two projects may have been intimately related. The inter-relatedness of tomb construction for the highest-ranking regional elites and the formation of a nascent transportation network may therefore betray a deep-seated relationship between politics, economy and ritual in the Kofun period.
The possible existence of a moat surrounding Zōzan
Given that LiDAR allows the acquisition of 3D data for those areas outside the mound proper that have not been sufficiently covered by traditional surveys, it has the potential to contribute to the ongoing debate over whether a moat once surrounded Zōzan. As the principal tombs within the Kinki political centre were fashioned with a moat encircling the mound, the adoption of a similar construction at Zōzan may indicate core-periphery relationships related to the creation of mounded tombs.
Previous excavations of the mound environs have revealed features believed to represent a moat; their planar shape is comparable to the layout of modern rice paddies and land plots to the north and east of the mound (Figures 4 & 6A; Niiro Reference Niiro2012). While the development of modern paddy-fields has made the identification of a moat on the western side of the mound difficult, a nineteenth-century map reveals rounded paddy-field plots similar to those seen to the north-east (Okayama-shi Kyōiku-iinkai Reference Kyōiku-iinkai2014: fig. 7). The existence of a moat is debatable, and some have interpreted the excavated features as part of a natural channel (Kusahara Reference Kusahara2014).

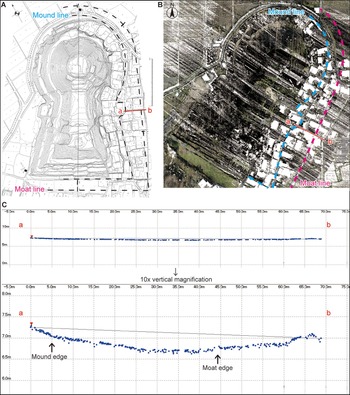
Figure 6. Cross-section of the proposed moat: A) a–b cross-section line superimposed on plane-table survey map of Zōzan (after Niiro Reference Niiro2012: fig. 2.23; note that the moat's southern edge differs from that proposed in Figure 4); B) LiDAR point cloud data, with location of the a–b line indicated; C) cross-section of the a–b line shown in original (top) and 10× vertical magnification (bottom) (figure by the authors using ScanSurvey Z).
Based on our LiDAR data, a cross-section through the area of the proposed moat (line a–b in Figure 6) reveals a slight depression in relation to the surrounding terrain. This microtopography could have been formed through the deposition and settling of fill, which would suggest that Zōzan may have been furnished with a moat similar to the principal tombs of the Kinki region. Additional research employing multispectral imaging and other innovative technology is expected to further contribute to our understanding of the mound's structure.
Conclusion
Drone-based LiDAR survey has clarified the relationship between the mounds of the Zōzan tomb group and its surrounding topography. The construction of this tomb group for powerful regional elites, which contains one of Japan's largest mounded tombs, now seems likely to have been just one element within a major project that reflects the intersection of politics, economy and ritual during Japan's ancient state formation process.
Acknowledgements
We thank the Okayama University Department of Archaeology students for their assistance.
Funding statement
This work was supported by Grant-in-Aid for Scientific Research on Innovative Areas JP19H05732 and JSPS Grant-in-Aid for Scientific Research JP20H05634.

 Open access